Managing Valuation Risks As Market Multiples Rise
On February 1, 2007, WisdomTree launched its U.S. Earnings family of Indexes. Over the course of this nearly 11-year live track record, many clients have asked us why we chose to weight these Indexes by earnings.
What’s happening in U.S. equities today provides an environment for a better answer than any we have been able to provide thus far. In nearly every conversation that we have the investor community seems to agree on the following:
1. Equity Multiples Are Elevated and Rising: U.S. equities1 have been increasing, and at different times in the second half of 2017 they have continued to hit and establish new record highs. One consequence of this has been that valuation measures, such as price-to-earnings (P/E) ratios, have been increasing and currently are hitting the higher end of their established historical ranges. While some may counter that bonds, seen through the persistent low interest rate environment, remain even more expensive than equities, it is becoming harder to argue that U.S. valuations represent cheap values today, at least in a broad market sense.
2. The U.S. Economic Expansion Has Been Going on for a Long Period: We’ve had 100 months of economic expansion.2 According to the National Bureau of Economic Research, which has been tracking U.S. economic expansions and recessions since the 1850s, there have been only two periods representing longer economic expansions than what we’re currently experiencing: February 1961 to December 1969 (106 months) and March 1991 to March 2001 (120 months).3
The Human Mind Has a Tough Time with These Data Points
We hear a lot of people combining these two ideas and coming to very similar conclusions:
1. The market has been going up for a long time, is at or near record highs and is ripe for a correction due in part to a more expensive valuation.
2.The U.S. economic expansion has been going on for so long that many wonder when the party will end.
Although it is a natural application of the heuristic of mean reversion to have these thoughts, we find it important to remind people that neither valuation alone nor the length of an economic expansion have been good predictors of future market corrections or impending economic recessions. The data on multiple fronts, especially earnings, remains strong, and the signs of impending recession on the immediate horizon just aren’t apparent, in our view.
Where We’ve Found Valuation to be More Important
While valuation alone hasn’t been the best predictor of future market corrections, we have found it to be important over longer time frames in helping to set expectations for real returns from equities. Over a variety of different long-term periods, work by Professor Jeremy Siegel in his book The Future for Investors has indicated that the after-inflation returns of equities have held a very close relationship to their earnings yield—the reciprocal of the P/E ratio. In short:
- Higher earnings yields (or lower P/E ratios) have been associated with stronger real returns.
- Lower earnings yields (or higher P/E ratios) have been associated with weaker real returns.
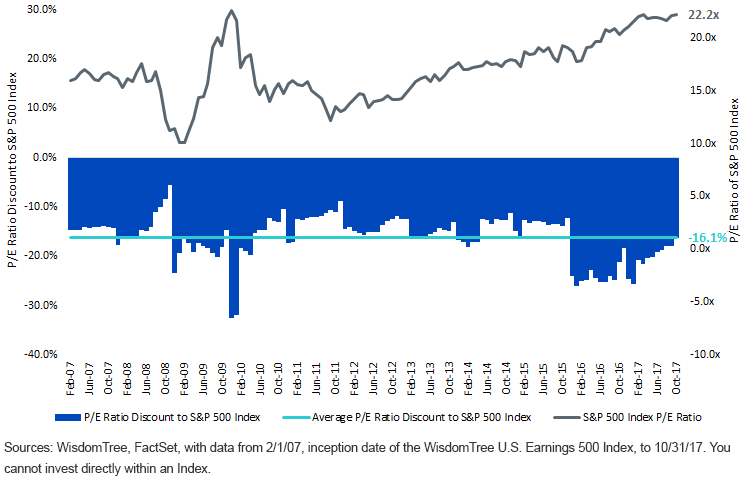
So if, for instance, we’re looking at the S&P 500 Index with a trailing 12-month P/E ratio of 22.2x as of October 31, 2017, that is associated with a 4.5% earnings yield, and it becomes more challenging to see real, after-inflation returns to U.S. equities that are very different than this 4.5% level—at least if history is any guide.4
Where WisdomTree’s U.S. Earnings Indexes Can Help
WisdomTree’s U.S. Earnings Indexes do two big-picture things at their annual rebalance:
- Include only profitable companies
- Weight companies by their core earnings
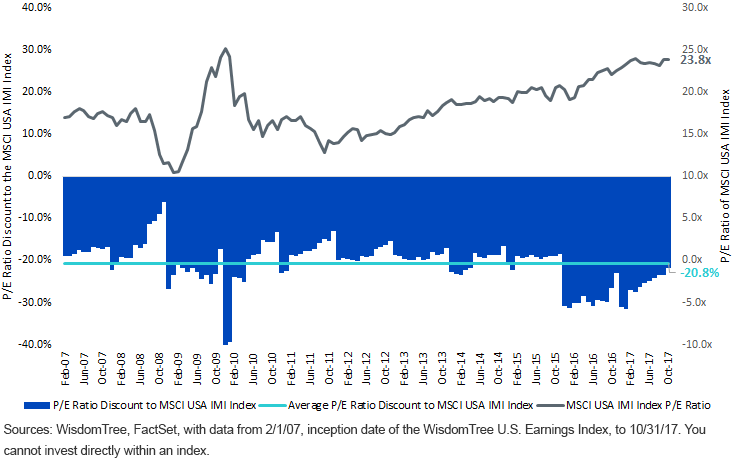
This process has tended to raise earnings yields (same thing said a different way: lower P/E ratios) relative to market capitalization-weighted universes of similar stocks. Below, we focus on the WisdomTree U.S. Earnings 500 Index, which is highly comparable to the S&P 500 Index, and the WisdomTree U.S. Earnings Index, which is highly comparable to the MSCI USA IMI Index of large-cap, mid-cap and small-cap stocks.
The WisdomTree U.S. Earnings 500 Index Has Had a 16.1% Average P/E Ratio Discount Relative to the S&P 500 Index over Its Live History

The WisdomTree U.S. Earnings Index Has Had a 20.8% Average P/E Ratio Discount Relative to the MSCI USA IMI Index over Its Live History

Conclusion: Why Does WisdomTree Have a U.S. Earnings Family of Indexes?
The bottom-line answer: this methodology has provided a capability to raise the earnings yield (or lower the P/E ratio), relative to a comparable market capitalization-weighted universe of stocks. For those investors looking to put assets to work in an environment where the markets are experiencing overall lower earnings yields (or higher P/E ratios), this approach could be even more important when considering longer-run returns.
The current P/E ratios of these Indexes (at 18.7x for the WisdomTree U.S. Earnings Index and 18.7x for the WisdomTree Earnings 500 Index), while elevated, represent discounts to the market to help investors manage the valuation risks of rising multiples.5 The higher the market multiples go, the more important we believe this methodology will become.
1Source: Bloomberg. Refers to S&P 500 Index universe between 6/30/17 and 11/3/17.
2Source: National Bureau of Economic Research (NBER), with expansion since June 2009.
3NBER.
4Sources: WisdomTree, FactSet.
5Sources: WisdomTree, FactSet, with data as of 11/3/17.
Disclaimer: Investors should carefully consider the investment objectives, risks, charges and expenses of the Funds before investing. U.S. investors only: To obtain a prospectus containing this ...
more


