
How Bad Is It? Pretty Bad
I use the 6 Exchange Traded Funds listed below as my market barometers. Except for the NASDAQ 100 ETF (NASDAQ:QQQ) there is little if any duplication or overlap in the stock contained in each ETF.
S&P 500 Large Cap Index Ishare ETF (NYSEARCA:IVV)
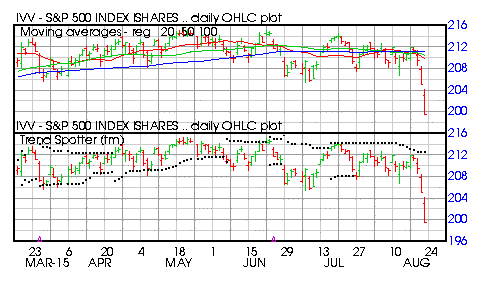
Barchart technical indicators:
- 100% Barchart technical sell signals
- Trend Spotter sell signal
- Below its 20, 50 and 100 day moving averages
- 7.11% off its 52 week high
- Negative 3.40 Weighted Alpha
- Relative Strength Index 26.63%
- Recently traded at 199.51 which is below its 50 day moving average of 210.48
S&P 400 Mid Cap Index Ishare ETF (NYSEARCA:IJH)
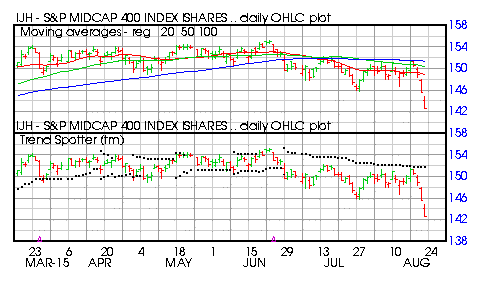
Barchart technical indicators:
- 100% Barchart technical sell signals
- Trend Spotter sell signal
- Below its 20, 50 and 100 day moving averages
- 7.85% off its 52 week high
- Negative 2.40 Weighted Alpha
- Relative Strength Index 30.49%
- Recenlty traded at 142.74 which is below its 50 day moving average of 150.31
S&P 600 Small Cap Index Ishare ETF (NYSEARCA:IJR)
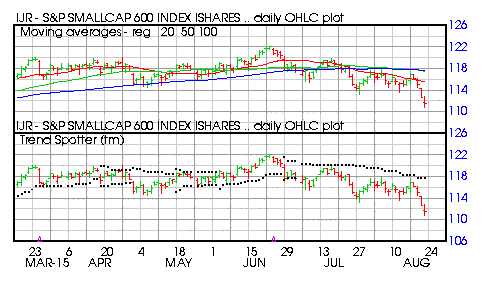
Barchart technical indicators:
- 100% Barchart technical sell signals
- Trend Spotter sell signal
- Below its 20, 50 and 100 day moving averages
- 8.72% off its 52 week high
- Negative 1.30 Weighted Alpha
- Relative Strength Index 30.81
- Recenlty traded at 111.34 which is below its 50 day moving average of 117.46
Russell Micro Cap Index Ishare ETF (NYSEARCA:IWC)
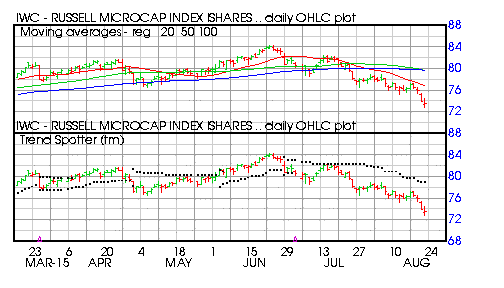
Barchart technical indicators:
- 100% Barchart technical sell signals
- Trend Spotter sell signal
- Below its 20, 50 and 100 day moving averages
- 12.72% off its 52 week high
- Negative 2.60 Weighted Alpha
- Relative Strength Index 25.88%
- Recently traded at 73.55 which is below its 50 day moving average of 79.63
NASDAQ 100 QQQ Index Powershares ETF (QQQ)
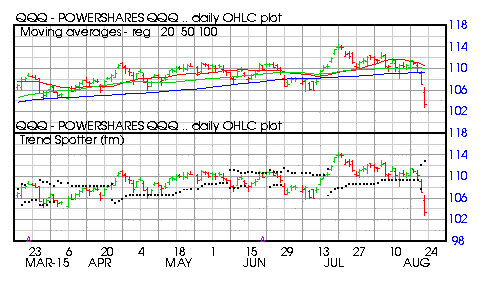
Barchart technical indicators:
- 56% Barchart technical sell signals
- Trend Spotter sell signal
- Below its 20, 50 and 100 day moving averages
- 9.71% off its 52 week high
- Positive .30 Weighted Alpha
- Relative Strength Index 26.16%
- Recently traded at 103.19 which is below its 50 day moving average of 110.00
Emerging Markets Index MSCI Ishares ETF (NYSEARCA:EEM)
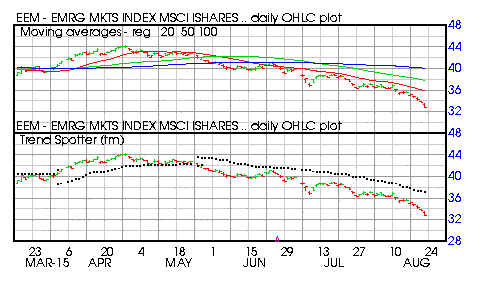
Barchart technical indicators:
- 100% Barchart technical sell signals
- Trend Spotter sell signal
- Below its 20, 50 and 100 day moving averages
- 28.38% off its 52 week high
- Negative 30.50 Weighted Alpha
- Relative Strength Index 19.64%
- Recently traded at 32.80 which is below its 50 day moving average of 37.81
Conservative accounts should be liquidating into cash. Aggressive accounts should be shorting individual stocks or buying inverse ETFs.
Disclosure: I have no positions in ...
more

