
Don't Worry About A Bear Market, Plan For It Instead
Fears about a potential trade war between the U.S. and China are creating lots of concern among investors lately. It’s hard to tell if this will be a major economic headwind or just a reasonable renegotiation of trade agreements between the two superpowers. In any case, markets hate uncertainty, and trade war fears are an important uncertainty driver.
Looking beyond the short-term outlook, it’s important to note that a bear market is coming sooner or later. Nobody knows for certain when it’s coming or how deep it will be, but that’s just the nature of markets. You can’t expect to enjoy the upside potential in stocks unless you also are willing to accept some downside risk from time to time. Even worse, bear markets usually show their ugly face when least expected.
Bear markets are practically impossible to predict with precision, but the good news is that you don’t really need a crystal ball to protect your portfolio when the bear market comes. Please note that the key word is “when” the bear market comes, not "if."
As opposed to making market predictions, relying on objectively quantified variables with a solid track record of performance is a far sounder approach to protecting your capital through the ups and downs in the markets.
The following paragraphs will introduce a quantitative system designed to increase returns and reduce downside risk by relying on a combination of stock-specific factors and trend-following in the broad market. No system is perfect or infalible, but the statistical evidence indicates that a well-designed quantitative system can be a remarkably effective tool to incorporate in your investing toolbox.
Stock Picking Based On Quantitative Factors
The following quantitative system applies the PowerFactors ranking algorithm to companies in the Russell 3000 Index. PowerFactors is a stock picking algorithm exclusively available to members in my research service: The Data Driven Investor. The system basically selects companies based on four main factors: quality, value, financial momentum, and relative strength.
The PowerFactors algorithm compares a wide variety of ratios and indicators across these three main dimensions, and then it averages those numbers to reach a final PowerFactors ranking for a particular stock.
Here's a quick overview of the variables considered by the algorithm:
- Quality includes profit margins such as gross profit margin and free cash flow margin. The system also includes long-term growth expectations for the company and profitability ratios like return on equity and return on assets. All else the same, the more profitable the business, the more value it creates for investors over time.
- A high quality company deserves an above average valuation. However, it’s important to keep valuation at reasonable levels and avoid companies with unrealistically high price tags. For this reason, the system includes traditional valuation ratios such as price to earnings, price to earnings growth, and price to free cash flow. Cheaper companies obviously get a higher ranking in the algorithm.
- Financial momentum is about the company’s ability to outperform expectations and drive increased expectations about future performance. Markets reflect expectations, and fundamental data in comparison to expectations can have a huge impact on stock prices. If the company is reporting better than expected numbers and expectations about future performance are increasing, this generally means that the stock price is increasing too.
- Money has an opportunity cost, when you buy a stock with mediocre returns, that capital is not available for investing in companies with superior potential. Besides, winners tend to keep on winning in the stock market, so you want to invest in stocks that are not only doing well but also doing better than other alternatives. For this reason, the system focuses on stocks delivering above-average returns over different timeframes.
Leaving the mathematical considerations aside, it’s important to understand the rationale behind the quantitative model. The PowerFactors system is basically looking to buy solid businesses (quality) trading at reasonable prices (value), beating market expectations (momentum), and generating superior returns (relative strength). It’s easy to understand why it makes sense to expect attractive returns by investing these kinds of stocks over the long term.
The system has produced solid backtested performance over the years. The chart below shows how the 50 stocks with the highest PowerFactors ranking in the Russell 3000 index performed in comparison to the iShares Russell 3000 ETF (IWV) since 1999. The backtesting assumes an equal-weighted portfolio, monthly rebalanced, and with an annual expense ratio of 1% to account for trading expenses.
(Click on image to enlarge)
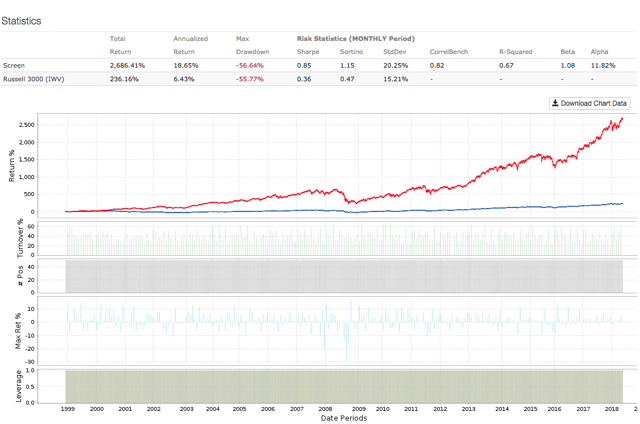
Data from S&P Global via Portfolio123
The system outperformed the benchmark by a wide margin, with annual returns of 18.65% per year versus an annual return of 6.43% for the market-tracking ETF in the same period. In other words, a $100,000 investment in the PowerFactors portfolio in 1999 would currently be worth nearly $2.79 million, and the same amount of capital allocated to the market-tracking ETF would have a much lower value of $336,200.
However, the maximum drawdown, meaning the maximum loss from a peak to a trough of a portfolio, was quite similar in both cases: 56.65% for the PowerFactors portfolio and 55.77% for the benchmark.
The main lesson is quite clear, stock picking based on quantitative factors can substantially increase returns over the long term, but it does not protect the portfolio in times of bear markets.
The Trend Is Your Friend
One of the most popular sayings in the market is “the trend is your friend”. Even if that is a cliché, that doesn't make it any less true. There is plenty of statistical evidence proving that investors can optimize the risk vs. return equation in their portfolio and avoid big drawdowns by following the main trends trend in asset prices.
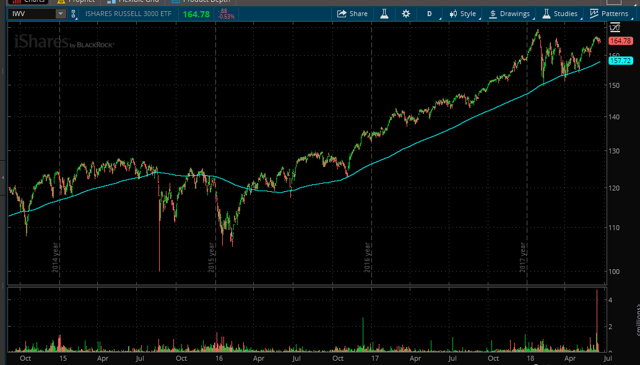
The following system is remarkably simple, yet effective. The market is considered to be in an uptrend the slope in the 200-day moving average is positive in the past 10 days. Conversely, if the slope in the 200 day moving average is negative over the past 10 days, then markets are considered to be in a downtrend.
For illustrative purposes, the chart below shows the iShares Russell 3000 ETF and its 200 day moving average over the past several years. As you can see, the 200 day moving average is a clear indicator about the overall trend in prices.
(Click on image to enlarge)
The portfolio remains unhedged during periods of market uptrends, meaning when the slope of the 200 day moving average is positive. If markets are in a downtrend, the PowerFactors portfolio is protected by shorting the iShares Russell 3000 ETF to reduce market risk.
The version with the dynamic hedge produces a significant improvement in performance. Annual return rises from 18.65% to 20.57%, and the maximum drawdown falls from 56.64% to 29.4%.
(Click on image to enlarge)
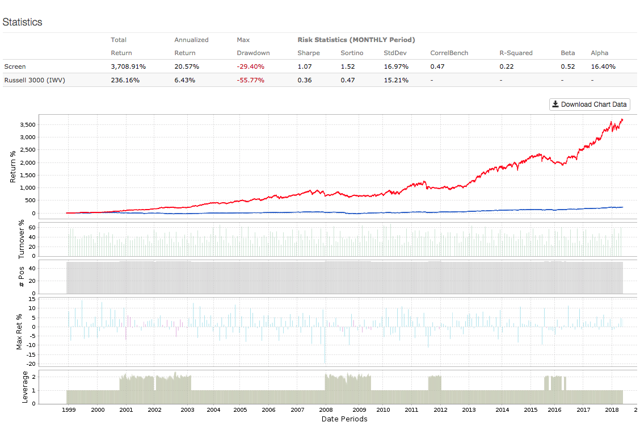
Data from S&P Global via Portfolio123
It's important to note that this system does not involve any kinds of market prediction or speculation. You just need to evaluate the trend in asset prices by looking at the slope of the 200 day moving average. If the trend is up the strategy is unhedged and if the trend is down the portfolios is hedged. Since the system is updated monthly, it doesn't require a lot of work, and trading expenses should not be a big problem.
Backtested performance does not guarantee future returns, and performance can vary substantially in different market environments. However, relying on data driven systems such as this one is a far sounder approach than trying to make investing decisions based on subjective opinions and speculation.
Disclosure: I/we have no positions in any stocks mentioned, and no plans to initiate any positions within the next 72 hours.
Disclaimer: I wrote this article myself, and it expresses my ...
more

