
Beating The Market With ETF Rotation Systems
When stocks in a particular sector are booming, even a mediocre company in such sector can deliver generous gains. On the other hand, when global stock markets are collapsing, chances are that most individual stocks will also suffer heavy losses.
Individual stock selection is important, but knowing when to buy or avoid stocks in a particular sector can be even more crucial in terms of maximizing returns and controlling downside risk.
No quantitative system can be perfect or infallible. However, there is plenty of statistical research showing that investors can outperform a buy and hold strategy in the long term by implementing quantitative trading strategies based on trend following and relative strength in different asset classes and sectors.
The Global Rotation system basically uses trend-following to choose between two portfolios, one based on different U.S. sectors and industries and another one based on global asset classes. Among each portfolio, the system always picks the 3 ETFs with superior relative strength in the middle term.
The system has produced an impressive performance in the long term, and it can provide a lot of valuable information when it comes to evaluating the market environment in order to make more effective investment decisions.
How The Global Rotation System Works
We start by creating two different portfolios: The sector portfolio and the asset class portfolio.
The sector portfolio includes 25 ETFs representing different sectors and industries in the U.S. stock market.
Those are:
- First Trust Dow Jones Internet Index (FDN)
- iShares Nasdaq Biotechnology ETF (IBB)
- iShares U.S. Oil Equipment & Services (IEZ)
- iShares North American Tech-Software (IGV)
- iShares U.S. Pharmaceuticals ETF (IHE)
- iShares U.S. Healthcare Providers (IHF)
- iShares U.S. Medical Devices ETF (IHI)
- iShares U.S. Aerospace & Defense (ITA)
- iShares U.S. Home Construction ETF (ITB)
- iShares US Industrials ETF (IYJ)
- iShares Transportation Average ETF (IYT)
- iShares US Technology ETF (IYW)
- iShares US Telecommunications ETF (IYZ)
- SPDR S&P Bank ETF (KBE)
- SPDR S&P Capital Markets ETF (KCE)
- SPDR S&P Insurance ETF (KIE)
- Invesco Dynamic Food & Beverage ETF (PBJ)
- Invesco Dynamic Media ETF (PBS)
- VanEck Vectors Semiconductor ETF (SMH)
- Vanguard REIT ETF (VNQ)
- Materials Select Sector SPDR Fund (XLB)
- Consumer Staples Select Sector SPDR (XLP)
- Utilities Select Sector SPDR Fund (XLU)
- SPDR Series Trust S&P Oil & Gas Exploration (XOP)
- SPDR Series Trust S&P Retail ETF (XRT)
The asset class portfolio covers 9 different asset classes on a global scale.
The ETFs in the universe are:
- SPDR S&P 500 (SPY) for big stocks in the U.S.
- iShares Russell 2000 Index Fund (IWM) for small U.S. stocks
- iShares MSCI EAFE (EFA) for international stocks in developed markets
- iShares MSCI Emerging Markets (EEM) for international stocks in emerging markets.
- PowerShares DB Commodities (DBC) for a basket of commodities
- SPDR Gold Trust (GLD) for gold
- Vanguard MSCI U.S. REIT (VNQ) for REITs
- iShares Barclays Long-Term Treasury (TLT) for long-term Treasury bonds
- Barclays Low Duration Treasury (SHY) for short-term Treasury bonds
The Global Rotation System basically compares the SPDR S&P 500 (NYSEARCA:SPY) versus a diversified benchmark (BNCH) made of 60% stocks and 40% bonds from both the U.S. and international markets.
We can do this by creating a relative ratio that calculates SPY over BNCH. Then we measure the 100-day moving average in such ratio to tell if SPY is outperforming or underperforming the benchmark.

Source: ETFreplay.com
In each portfolio, we use a relative strength ranking that measures risk-adjusted performance for the ETFs in such a portfolio over the middle term. This is calculated via a weighted average of factors that includes returns over 3 months, returns over 6 months, and volatility over 3 months as a negative factor.
When the S&P 500 index (SPY) is outperforming the benchmark (BNCH) the system is allocated to the top 3 ETFs with the highest relative strength in the U.S. sectors portfolio. On the other hand, if the S&P 500 is underperforming the benchmark, then the system is invested in the top 3 ETFs with the highest relative strength in the asset class portfolio.
In simple terms, when the S&P 500 is outperforming we want to focus on buying the strongest sectors and industries in the U.S. stock market. However, if the S&P 500 is underperforming, then we want to focus on the strongest asset classes on a global scale. As simple as that.
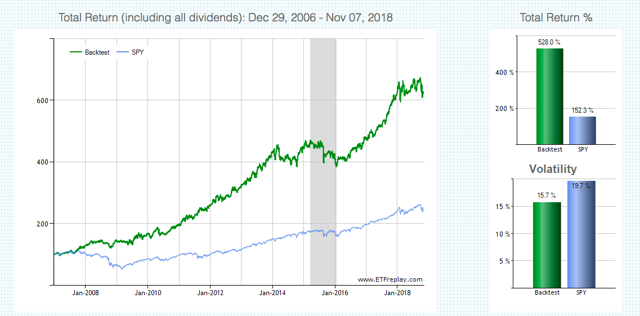
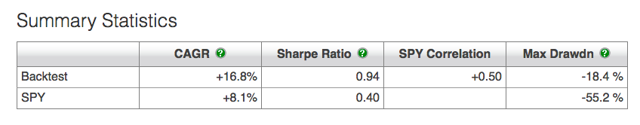
Backtested Performance
Since January of 2007, the Global Rotation System produced a cumulative gain of 528% versus 152.3% for the SPDR S&P 500 in the same period. In annual terms, the system gained 16.8% versus 8.1% for the SPDR S&P 500.
The system substantially outperformed the SPDR S&P 500 in terms of downside risk too. The maximum drawdown was 18.4% for the Global Rotation System versus 55.2% for the SPDR S&P 500 in the same period.
Note: Maximum drawdown is measured as the greatest percentage drop from the high, based on daily closing prices.
Source: ETFreplay.com
For more information, the table below shows the annual returns for the system versus the SPDR S&P 500 since 2007. It's interesting to note that in 2008 - when global stock markets crushed down and the S&P 500 had a maximum drawdown of 47.5% - the Global Rotation system gained 15.5% by investing in safe-haven assets such as Treasuries and gold.

The system should be expected to do well in the long term, especially when there are well-defined trends, either up and or down in different markets. However, in a year in which markets are mostly moving sideways, the system will most probably produce lots of false signals and disappointing results overall.
In other words, the system can be expected to outperform during big bear and bull markets such as 2008 and 2017, and it will probably generate disappointing numbers in sideways years such as 2015 and 2018 so far.
Starting on November 1 the system is allocated to the asset class portfolio since the S&P 500 is underperforming the benchmark. The system is now long Gold (GLD), Short-term Treasuries (SHY), and REITs (VNQ), so the allocation is quite defensive in the current market environment. This quantitative system will be updated on a monthly basis for members in my research service: The Data Driven Investor.
These kinds of systems are not only useful for investors who trade ETFs based on quantitative indicators. The system can provide actionable information in terms of evaluating the overall market environment and positioning your portfolio accordingly.
Information is power in the stock market, and a quantitative system such as this one generates valuable information in order to make better investing decisions supported by hard quantitative data as opposed to subjective opinions and speculation.
Capitalize on the power of data and technology to take the guesswork out of your investment decisions. Statistical research has proven that stocks and ETFs showing certain quantitative attributes tend to outperform the market over the long term. A subscription to The Data Driven Investor provides you access to profitable screeners and live portfolios based on these effective and time-proven return drivers. Forget about opinions and speculation, investing decisions based on cold hard quantitative data can provide you superior returns with lower risk.
I/we have no positions in any stocks mentioned, and no plans to initiate any positions within the next 72 hours.
Disclaimer: I wrote this article myself, and it expresses my ...
more

