
And Down Go The Consumer Plays
This year was supposed to be the year of retail. Last week’s selloff not only took down a broad base of stocks, but also retail stocks in aggregate into under-performance against the S&P 500 (SPY). Moreover, home builders broke down in a very bearish way and thus put my “buy the dip” strategy in great jeopardy.
In the charts below, I show the relative performance of SPY vs iShares US Home Construction ETF (ITB) vs SPDR® S&P Retail ETF (XRT). SPY is the base chart. ITB is the blue line. XRT is the red line. The vertical axis measures the percentage change in price from the beginning of the chart. Due to limitations in the charting program, I could only measure change from a few select dates. The short-term chart starts with December 27, 2017, and the longer-term chart starts with November 6, 2016.
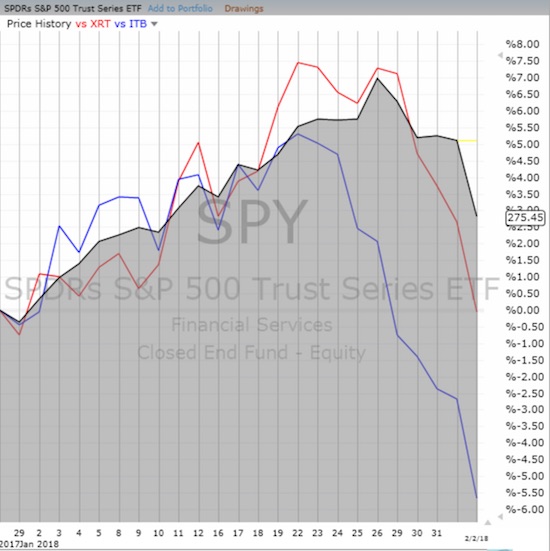
For 2018, retailers (XRT) and home builders (ITB) have plunged into significant under-performance against the S&P 500 (SPY).
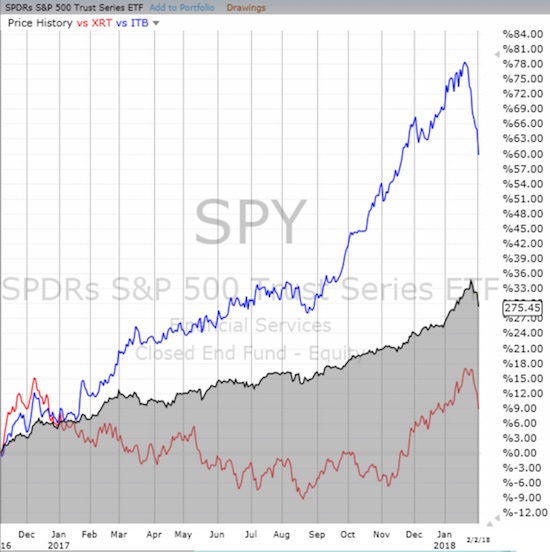
Over the past year, home builders (ITB) still hold a significant advantage over the S&P 500. Retailers are still significantly under-performing.
The year of 2017 was a significant year for ITB as it broke out and delivered an out-sized gain. Last year was also significant for retailers but for the exact opposite reason. If general market weakness continues, I fear that the performance of ITB will quickly converge back toward SPY and the opportunity for catchup for XRT will quickly disappear. The individual charts are also quite telling.
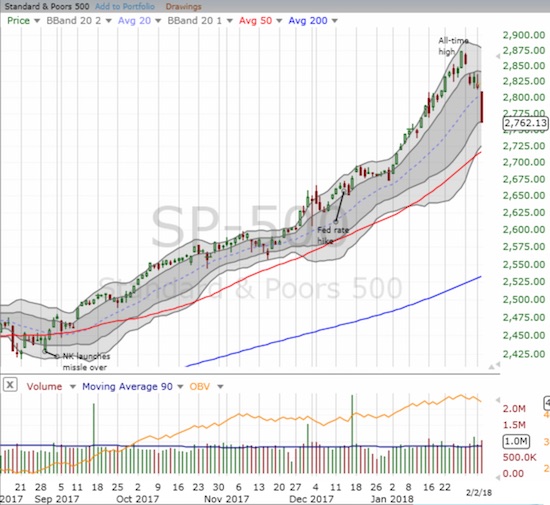
The S&P 500 took out a good chunk of its January gains in one day of trading.
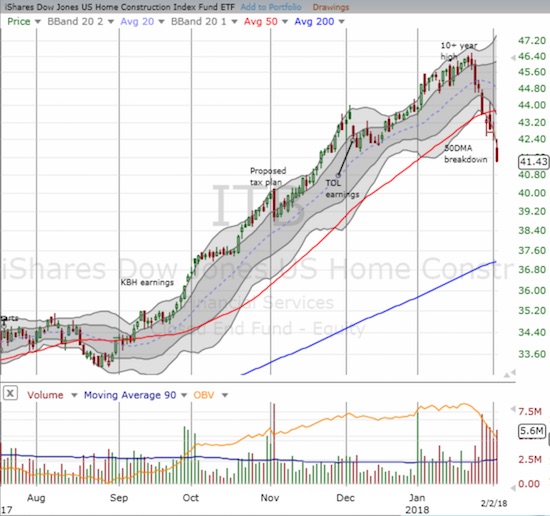
The iShares US Home Construction ETF started selling off before the S&P 500. Now ITB has suffered a bearish 50DMA breakdown and a -5.2% year-to-date performance.
Source for charts: FreeStockCharts.com
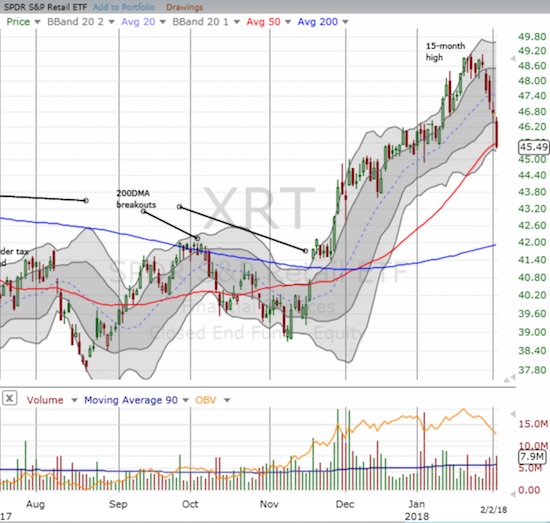
SPDR® S&P Retail ETF (XRT) is now flat for the year as the sell-off forced XRT into an important test of 50DMA support.
For now, my general market posture remains bullish, so I am still looking for reasons to buy into the dip. Yet, I am a lot more wary than I otherwise might be, and I have significantly capped my upside expectations.
The numbers on the health of American workers and consumers are also on my radar. The January jobs report delivered good news with much stronger than expected wage growth and the usual dose of job growth. However, the savings rate is falling as spending ramps up beyond income growth. Apparently, big ticket items and dining out drove the biggest increase in spending since 2011 and helped send the savings rate to its lowest level since 2005. Spending increased in the fourth quarter at its fastest rate in two years. So how realistic is it to expect XRT in particular will be able to keep rallying this year to new highs and out-performance with the S&P 500? If nothing else, I have to temper my expectations.
(I will cover the latest data on the housing market in my Housing Market Review for January).
Disclosure: Long ITB call options
Follow Dr. Duru’s commentary on financial markets via more


