
GBP/USD Elliott Wave Analysis: Bearish Double Zig Zag
GBP/USD – MEDIUM TERM ELLIOTT WAVE ANALYSIS
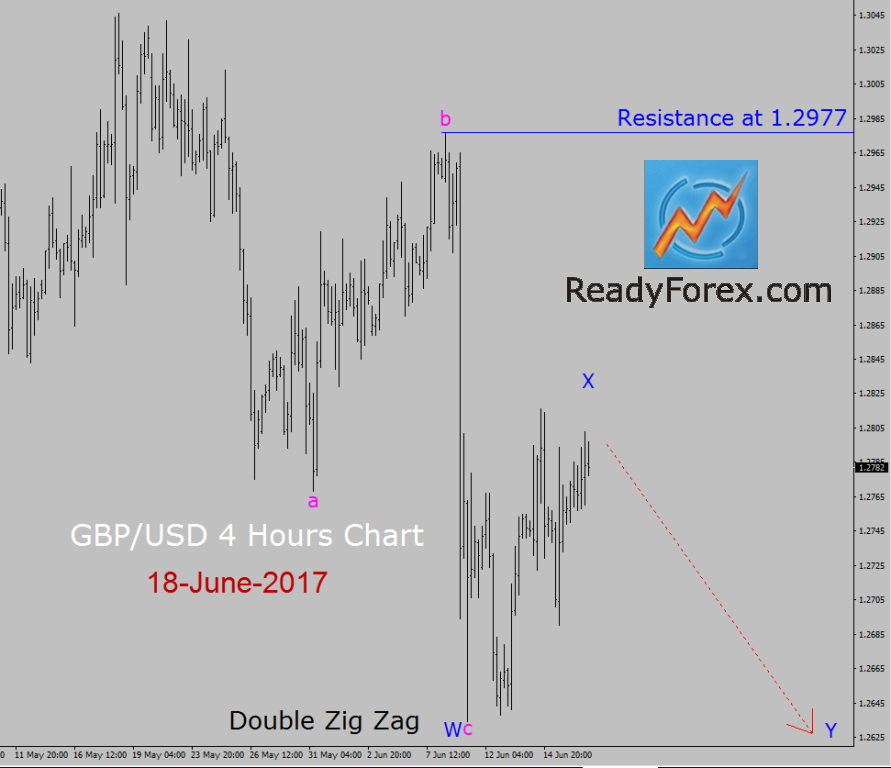
The trend is bearish in GBP/USD currency pair, 4 Hours time frame. As I have suggested last week during my daily Live Trading Room session, the price of GBP/USD is going to rise up on a short-term basis to print a corrective bullish wave X leg and traders should look for a buy trade. Strong key resistance level is present at 1.2977 price level.
In my judgment, price action in GBP/USD currency pair is now going to drop as a bullish Wave X pattern looks complete or is going to complete soon. So, expect markets to resume the down trend and decline towards 1.2625 price level to print a bearish Wave Y leg.
Currently, the bearish wave Y leg did not start. So, first wait outside of the market and allow price action to print some bearish candlesticks and then look for a possible short trading opportunity to join the down trend to ride the bearish wave Y. However; if the price of GBP/USD breaks above 1.2977 key resistance level then the downtrend is going to end. In such a market scenario, it would be best not to trade the market and re-analyze the GBP/USD 4 chart.
Disclaimer: Forex trading involves significant risk of loss. The high degree of leverage can work against you as well as for you. The possibility exists that you could sustain a loss of some or all ...
more

