
EUR/USD, GBP/USD Take A Pause After 300+ Pip Bullish Move
EUR/USD
4 hour

The EUR/USD bullish breakout within the uptrend is now building a sideways retracement. The consolidation zone is most likely just a correction before the bullish trend continues towards the Fibonacci targets of wave 5 (blue).
1 hour

The EUR/USD bullish impulsive price action is best explained by the development of a wave 3 (orange). The shallow correction is probably a wave 4 (orange) which could either retrace to the Fib levels or break above the resistance (red).
GBP/USD
4 hour

The GBP/USD is showing a strong bullish rally after the breakout. Price is now approaching a key resistance zone which is indicated by the resistance trend line (orange). The orange horizontal line is the bottom of wave 1 on a weekly chart and a break above it indicates an invalidation of a long-term bearish wave count.
1 hour

The GBP/USD bullish momentum is best explained by a wave 3 (grey) and a retracement is most likely a wave 4 (grey) if price behaves slowly and correctively.
USD/JPY
4 hour

The USD/JPY downtrend is challenging the resistance trend line (red). A bearish bounce could indicate a continuation towards the -61.8% Fibonacci target at 110.
1 hour
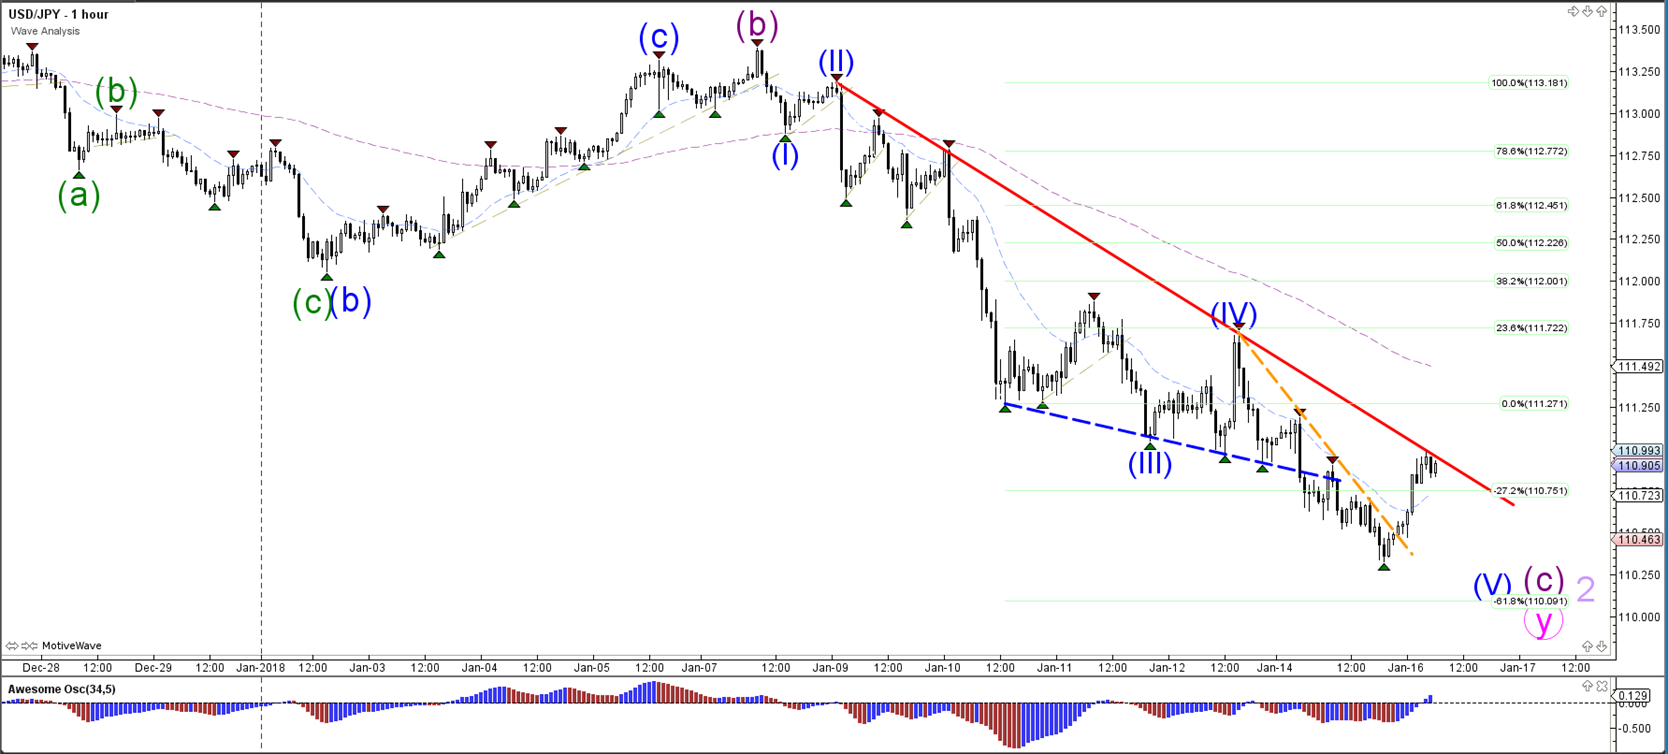
The USD/JPY is testing the resistance trend line (red) of the downtrend. A bullish break could indicate a reversal and continuation of the bullish momentum.
Disclaimer: The opinions in this article are for informational and educational purposes only and should not be construed as a recommendation to buy or sell the stocks mentioned or to solicit ...
more

