
EUR/USD Bearish Channel Aiming At 1.17 And 50-61.8% Fibonacci
EUR/USD
4 hour
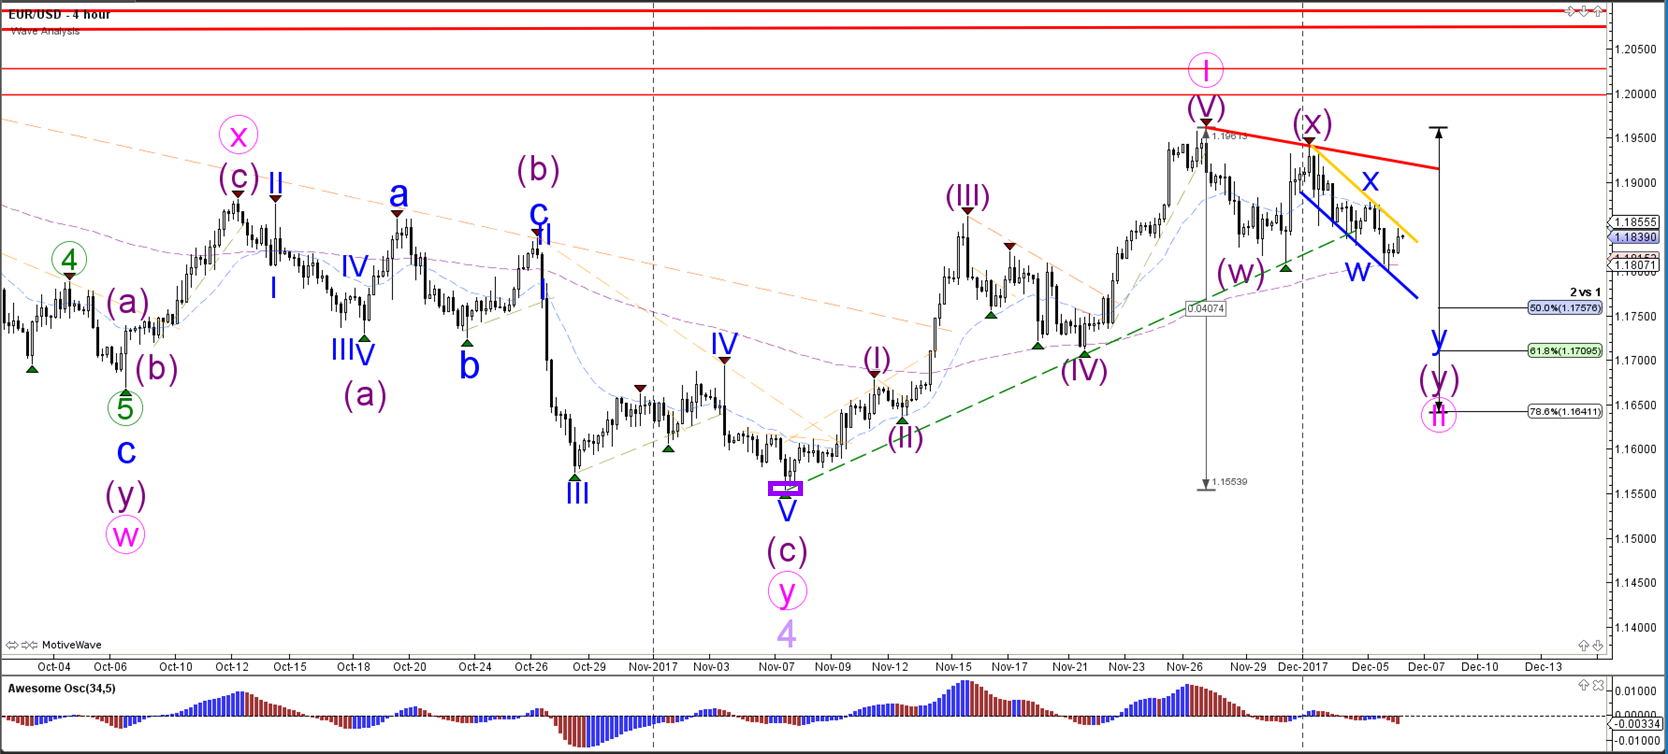
The EUR/USD is building a bearish correction as expected. The choppy and corrective price action is making a wave 1-2 (pink) pattern more likely. The bearish channel could take price down lower to the Fibonacci levels of wave 2. A break below the bottom (purple box) invalidates this wave pattern.
1 hour
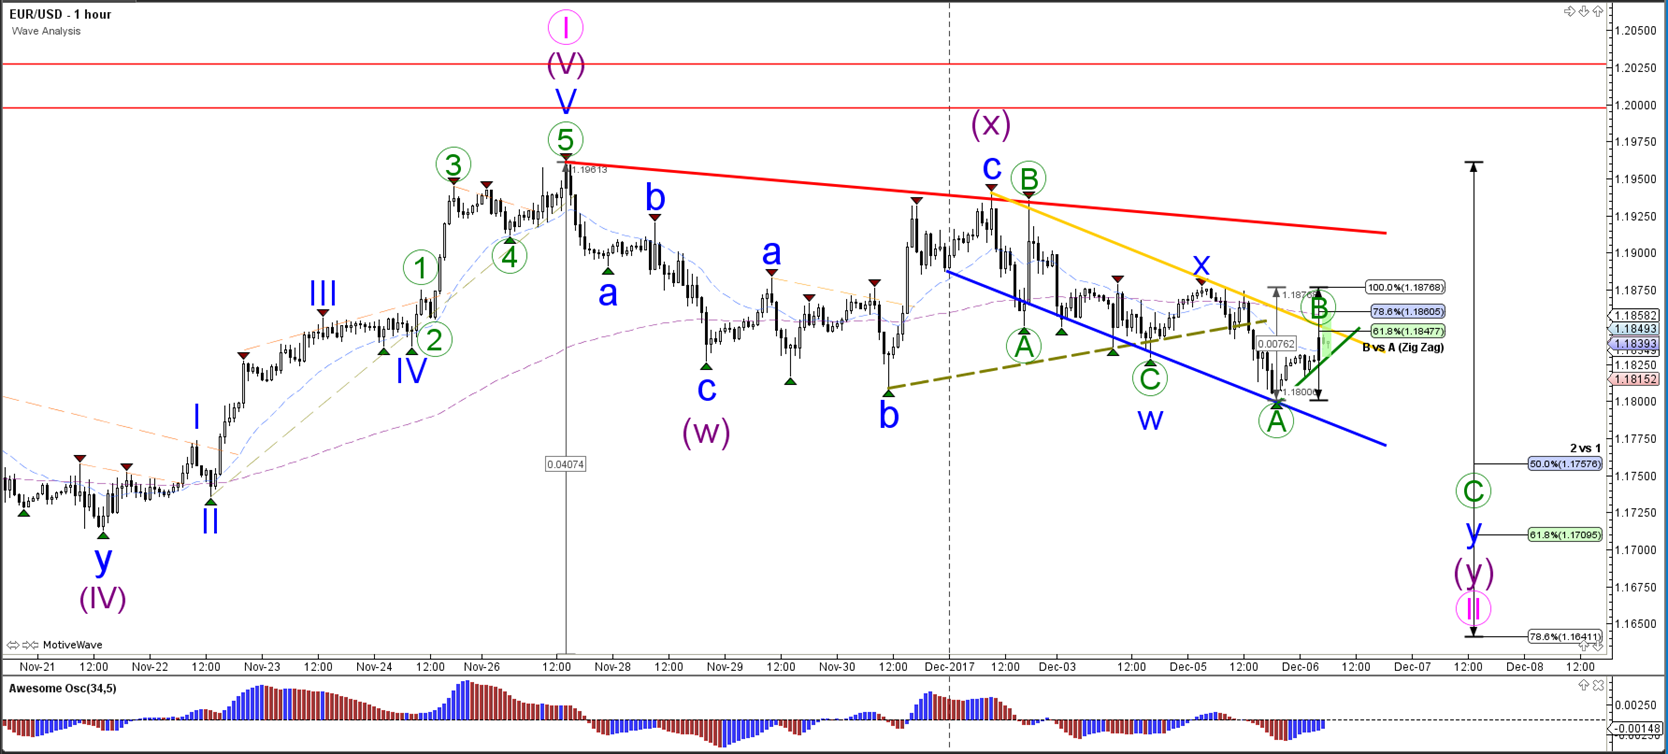
The EUR/USD broke below the support trend line (dotted green) and fell below 1.18 but is a sturdy pullback. This could be part of a wave B (green) within a larger bearish ABC zigzag.
USD/JPY
4 hour

The USD/JPY is testing the bottom / support (green) of the uptrend channel. An impulsive bullish bounce could indicate that price is building a wave 2 (blue) whereas a sideways movement could mean a bear flag pattern and more downside.
1 hour

The USD/JPY will need to bounce at support first of all and later on break above the resistance (red/orange) to confirm the wave 3 pattern (purple). For the moment, price could have built a bearish ABC pattern within wave 2 (blue) and the Fibonacci levels and the support trend line could stop price from falling.
GBP/USD
4 hour

The GBP/USD is building a bearish correction which is probably part of a larger a wave 1-2 (green). This is invalidated if price breaks below the 100% Fibonacci level of wave 2 vs 1.
1 hour

The GBP/USD is showing a triangle chart pattern (orange/blue). A break below or above the triangle could indicate a potential breakout.
Disclaimer: The opinions in this document are for informational and educational purposes only and should not be construed as a recommendation to buy or sell the stocks mentioned or to solicit ...
more

