
Euro, US Dollar Pose Pullbacks: Pause In The Trend Or Reversal Potential?
US DOLLAR PULLS BACK TO SUPPORT AT PRIOR RESISTANCE
The world takes a step back from the proverbial ledge today, as risk aversion has started to pull back after a troubling start to the week. Italian bond yields are softening after an aggressive shot-higher yesterday, EUR/USD is bouncing after a failed attempt to take out 1.1500, and even European stocks are retracing a portion of their recent losses. While little resolution has been seen in the story of Italian politics, and while Spanish PM Mariano Rajoy is heading for a no-confidence vote on Friday of this week; we did get a bit of optimism over the past 24 hours as FOMC rate hike bets have started to get priced out. While we were looking at near-100% probabilities of a hike at the Fed’s next meeting in a couple of weeks, those odds have now pulled back, showing at a still healthy 85% as of this writing. But the prospect of a fourth hike out of the Fed this year has diminished remarkably, now only reflecting a 22.7% probability of getting a total of four hikes this year.
This has helped the US Dollar to soften after running into the 95.00 level yesterday, and that pullback has helped EUR/USD as the pair is bouncing from fresh 10-month lows. At this point, the US Dollar is pulling back to a prior zone of resistance, and the big question is whether buyers will show up to help produce support. This zone runs from 94.19-94.30, includes a couple of different longer-term Fibonacci levels, and this area helped to mark resistance earlier in the week.
US DOLLAR VIA ‘DXY’ TWO-HOUR CHART: PULLBACK TO SUPPORT ZONE, PRIOR RESISTANCE
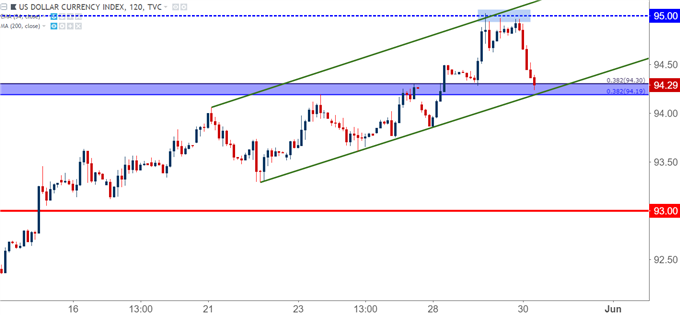
Chart prepared by James Stanley
EUR/USD BOUNCES AFTER FAILED ATTEMPT TO TAKE-OUT 1.1500
The bleed in the Euro has paused, at least for now, as sellers were unable to take out the 1.1500 level on the charts. Prices first made an attempt at that level yesterday morning, with buyers showing up to produce a low at 1.1509. Two more recurrent attempts to take-out 1.1500 also failed, and prices are now bouncing into the zone of resistance that we were looking at yesterday that runs from 1.1613-1.1640.
EUR/USD HOURLY CHART: BOUNCE UP TO FIND SELLERS AROUND PRIOR RESISTANCE OF 1.1640
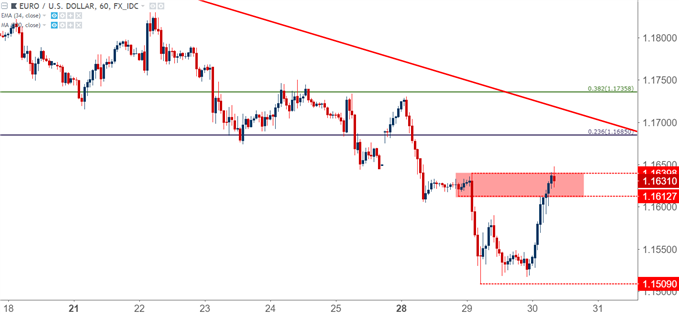
Chart prepared by James Stanley
This move has been helped by some positive European data, with German unemployment continuing to print at fresh all-time lows, coming in at 5.2% for the month of May. A little later in the morning, we got the release of German inflation numbers for the month of May, and this printed at 2.2% versus an expectation for a 1.8% print.
At this point, this morning’s bump-higher appears to be a short-squeeze after a really aggressive move continued yesterday. And while this doesn’t preclude the prospect of bearish continuation at this point, it does mean that prices might continue to rally as shorts close-up prior positions. The big question is where sellers tip the flow back in a bearish direction: On the below chart, we’re looking at a zone above the current area of potential resistance, and this is a prior area of support that had held the lows through multiple tests in the second half of last year. Resistance in this area could make the prospect of bearish continuation an attractive thesis.
EUR/USD FOUR-HOUR CHART: SECONDARY ZONE OF RESISTANCE FROM 1.1685-1.1736
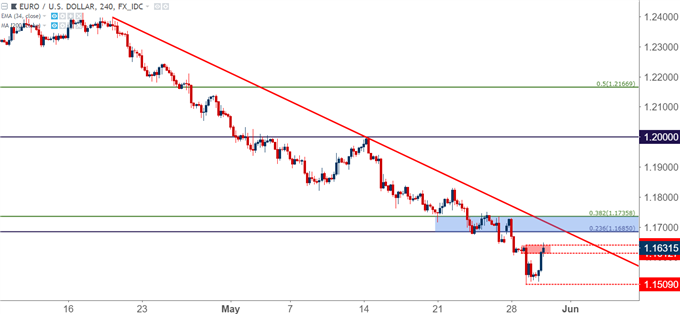
Chart prepared by James Stanley
EUR/JPY FOR A CONTINUATION OF EURO-WEAKNESS
For traders that want to look at today’s price action as a blip in a longer-term trend of weakness in the Euro, EUR/JPY remains interesting. While the US Dollar is rather stretched after an aggressively bullish six weeks of price action, the prospect of a more dovish Fed might hinder further gains, or at the very least raise the bar for such. The Yen, on the other hand, is a currency that could benefit from a continuation of risk aversion, much as we saw earlier this week when USD/JPY broke back-down below the 110.00 psychological level.
USD/JPY FOUR-HOUR CHART: YEN SHOWS SAFE-HAVEN PREFERENCE TO USD DURING RECENT RISK AVERSION
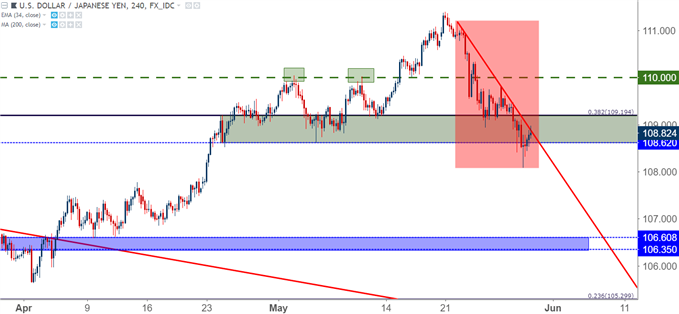
Chart prepared by James Stanley
The short side of EUR/JPY could mesh two themes together, looking for Euro weakness on a continuation of political volatility, along with Yen-strength on the basis of continued risk aversion.
Similar to EUR/USD, EUR/JPY put in an aggressively bearish move earlier this week, catching a bit of respite yesterday after a failed attempt to take out the 125.00 level. Prices have bounced, and are currently finding a bit of resistance at the underside of the 38.2% Fibonacci retracement of the 2016-2018 bullish move. This level comes in at 126.80 and is currently showing a bit of intra-day resistance.
EUR/JPY DAILY CHART: BOUNCE FROM 125.00 AFTER BEARISH BREAKOUT
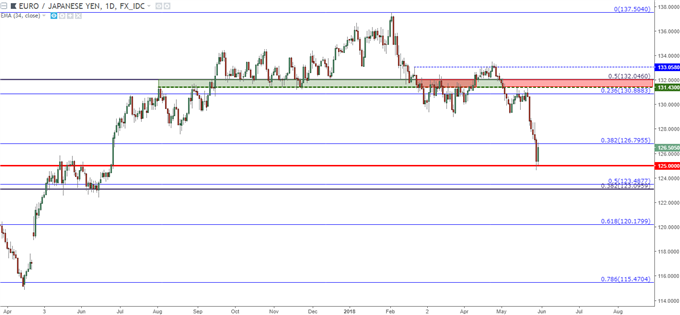
Chart prepared by James Stanley
On a shorter-term basis, we can see where that point of intra-day resistance is helping to hold the bounce thus far. There are a few deeper levels of resistance as well, and these can be used for stop placement or short-side re-entry should the current area of resistance not hold. A topside break back-above 130.00 would nullify this current theme of weakness.
EUR/JPY HOURLY CHART: LOWER-HIGH RESISTANCE POTENTIAL
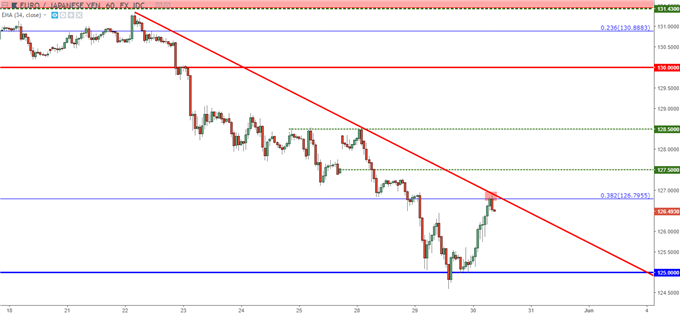
Chart prepared by James Stanley
Disclosure: Do you want to see how retail traders are currently trading the US Dollar? Check out our IG Client Sentiment ...
more

