
Bitcoin Warning Stage
Last year, Bitcoin was still considered as a fading project and many expected its price to keep dropping and break below $100. However in the recent months, the crypto-currency kept rising significantly and finally managed to make new all time high and break above $1200 last week. That’s only $50 short of the equivalence to 1 ounce of gold which could have a big impact in the future .
The masses picked up on the rising Bitcoin and now everyone is trying to catch a piece of this crazy surge. Media are calling for further rallies with big numbers to come as always $5000 and $10.000, while economist are back to establishing it as a serious currency .
If you try to search for the fundamental reasons behind the recent rally you’ll find all kind of explanation starting from currency war to even the Trump election. But it seems only few are paying attention to the technical aspect of the move which is purely bullish since the start, and smart people only kept buying the dips. In our previous article ‘ The rise of crypto-Currency ‘ , we pointed out that Bitcoin wasn’t dead and still has a long way to go with a potential rise above $1200 which already happened and still looking to reach $1300 target .
Elliott Wave Technical Analysis of BTCUSD
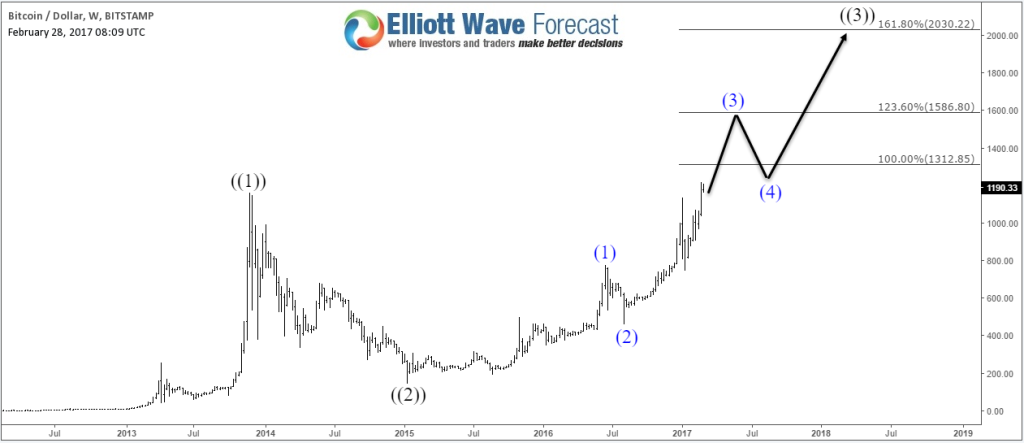
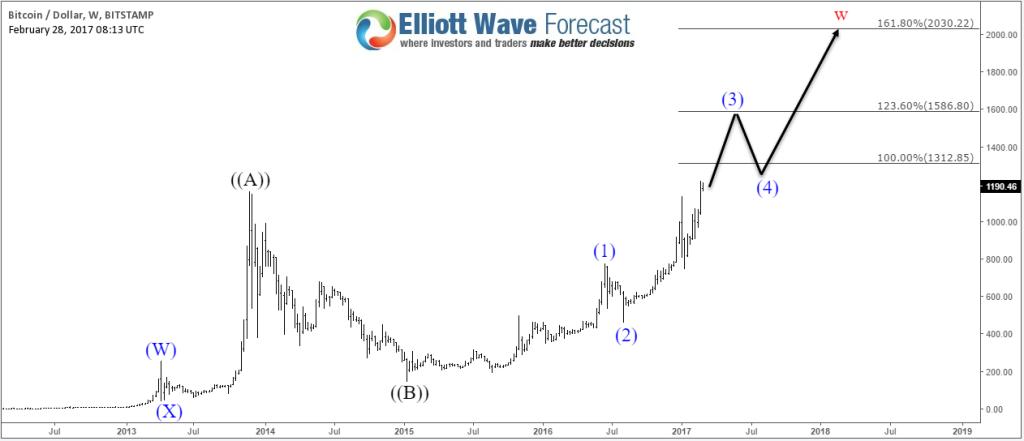
Using the basic rules of Elliott Wave Theory , we can easily call for a very bullish scenario for bitcoin to just keep extending higher as 5 waves impulsive move . So the current move would be only wave (3) of ((3)) which means BTCUSD will still extend toward $1300 – $1500 area then 3 waves pullback could happen before another rally toward $2000. There depending on the speed and structure of the move we will know if it’s going to be a wave ((4)) pullback or if Bitcoin has ended the cycle as a Flat structure ((A))((B))((C)) .
BTCUSD Weekly Chart 5 waves
BTCUSD Weekly Chart Flat
Both of the above scenarios are supporting a higher Bitcoin and that would be the case if the trend is extremely bullish as it seems, so it would be easy for everyone to just keep buying every 3 waves pullback . That looks too good to be true and we know that market isn’t perfect, as trading condition have changed so does rules and we at EWF believe that instruments can be trending in corrective waves same as in impulsive waves which means the movement doesn’t need to be in 5 waves as most of the forex currencies are moving in a big range using the corrective 3 waves structures .
The BTCUSD chart is a live example of respecting the 3 waves structure in both sides , even if the bigger structure can be labeled differently later on but the internal structure are clearly a double three corrective structure finding reaction every time they reach the equal legs area ( 100% – 123.6% ).
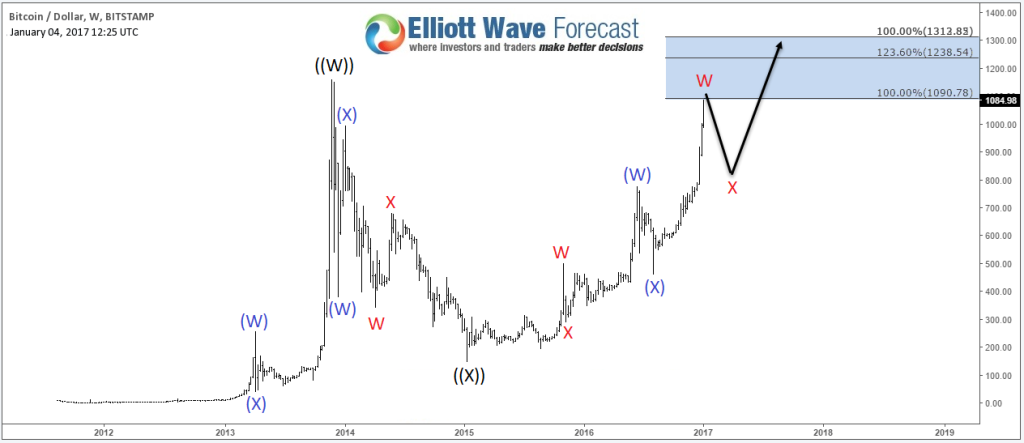
In January, we pointed out that Bitcoin was reaching an extreme area from 2015 low around equal legs area $1090 which will produce another buying opportunity as the main target $1315 still wasn’t met yet so the pullback could still be bought against August 2016 low.
BTCUSD Weekly Chart 01/04/2017
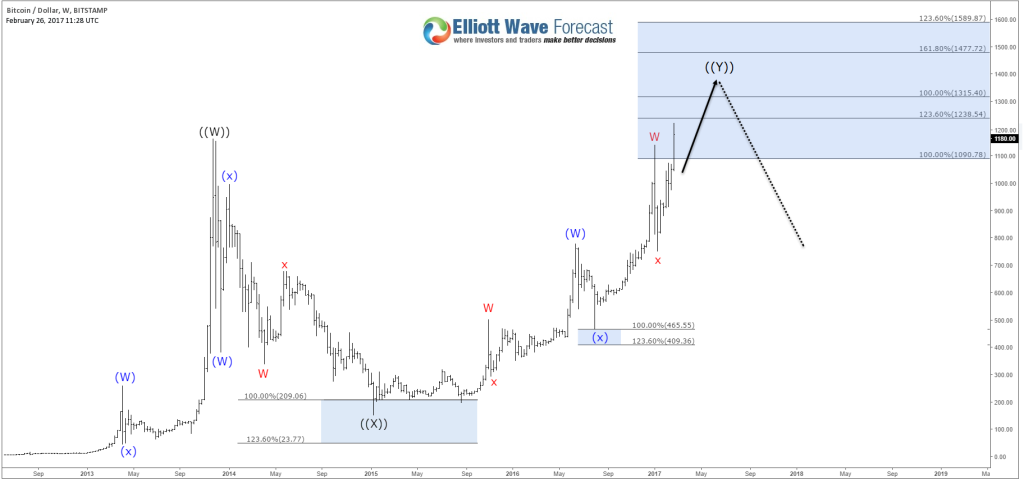
Now with the new all time highs in place, BTCUSD has the minimum number of swings to end the cycle at the blue box as multiple equal legs are compressed in that area and the instrument could see a larger pullback there . That’s why we need to be careful about the next leg higher and wait to see the reaction from these levels $1240 – $1315 – $1420 if seen. Because Bitcoin would be ending a 7 swings structure in 3 different cycles ” January 2015 low, August 2016 low and January 2017 low ” which means we are entering a taking profit area and the move could become choppy at that area .
BTCUSD Weekly Chart 02/26/2017
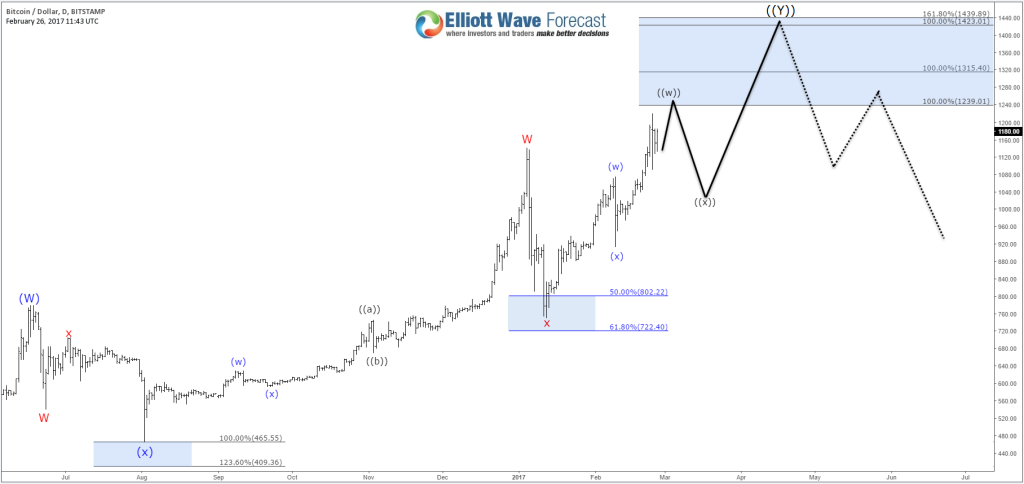
BTCUSD Daily Chart 02/26/2017
Recap
The bigger picture for Bitcoin remain bullish as investors are still adding the digital currency to their watch-list & portfolio with the instrument breaking to new all time highs and technical picture still calling higher. But at the same time it’s entering an important technical area which may produce a larger 3 waves pullback as smart money could be taking profits around $1300 area so new buyers needs to be careful about the next coming move as trading Bitcoin is risky because it has a high daily volatility so you need to use the proper risk management and try to always be in the right side of the market .
Disclosure: None.


