
XAU/AUD Mid-Term Elliott Wave Analysis
Back in November 2016, we mentioned that Gold should find buyers in 1540 – 1487 area and bounce ideally to resume the rally for new highs or in 3 waves at least. Three weeks later, XAUAUD reached the mentioned area, it then found a low at 1525 on 12/15/2016 and started rallying. The yellow metal has reached 61.8 Fibonacci retracement (1728) of the drop from June 2016 peak and longs from 1540 should be risk-free already. Today, we will take a look at the price action from 12/15/2016 low and the current forecast.
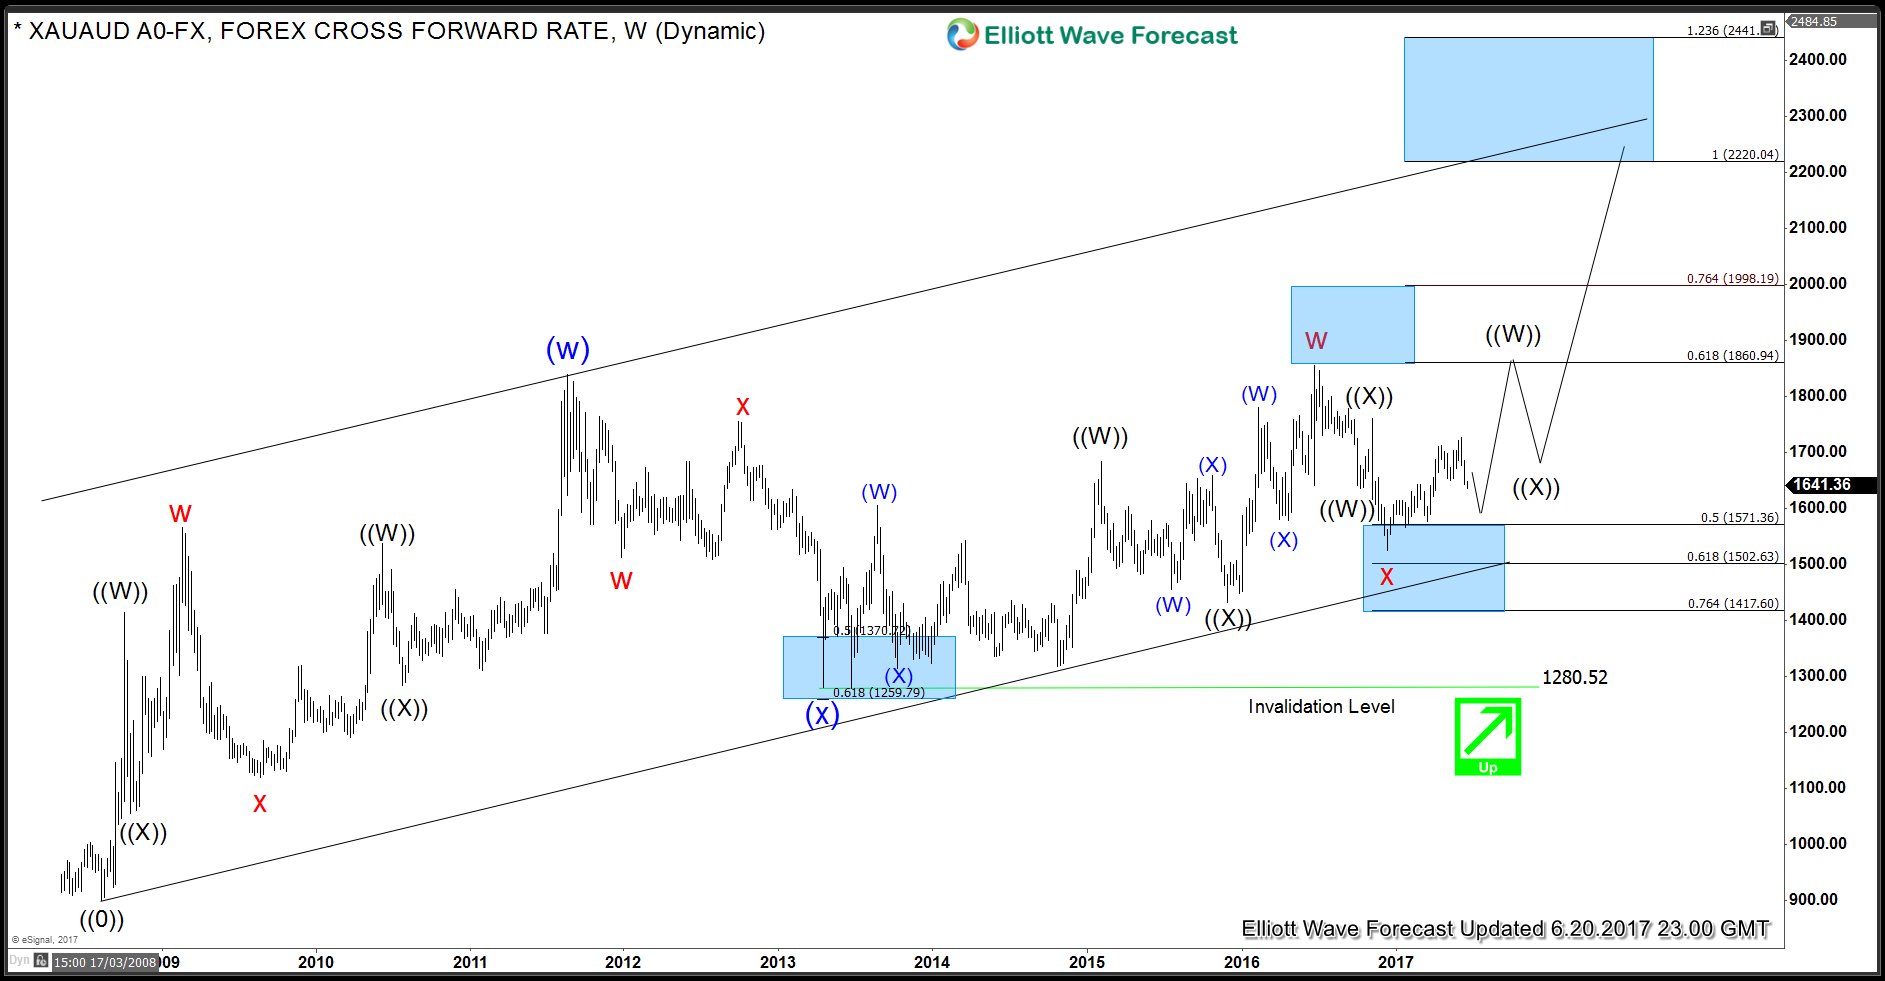
XAUAUD Weekly Elliott Wave View
The Bigger picture in Gold-AUD remains unchanged. It’s showing 5 swings up from 2008 low which means the sequence is incomplete and calls for higher extension towards 2220 – 2441 area. The pullback in wave “x” reached 50% of wave “w” and it was completed at 1525. As dips hold above this level, rally is expected to continue towards 2220 – 2241 area. If pivot at 1525 low gives up during the current pullback, wave “x” could turn into a double three correction towards 1417 area but it should still remain bullish against 1280.52 low. This alternate view is less likely.
(Click on image to enlarge)
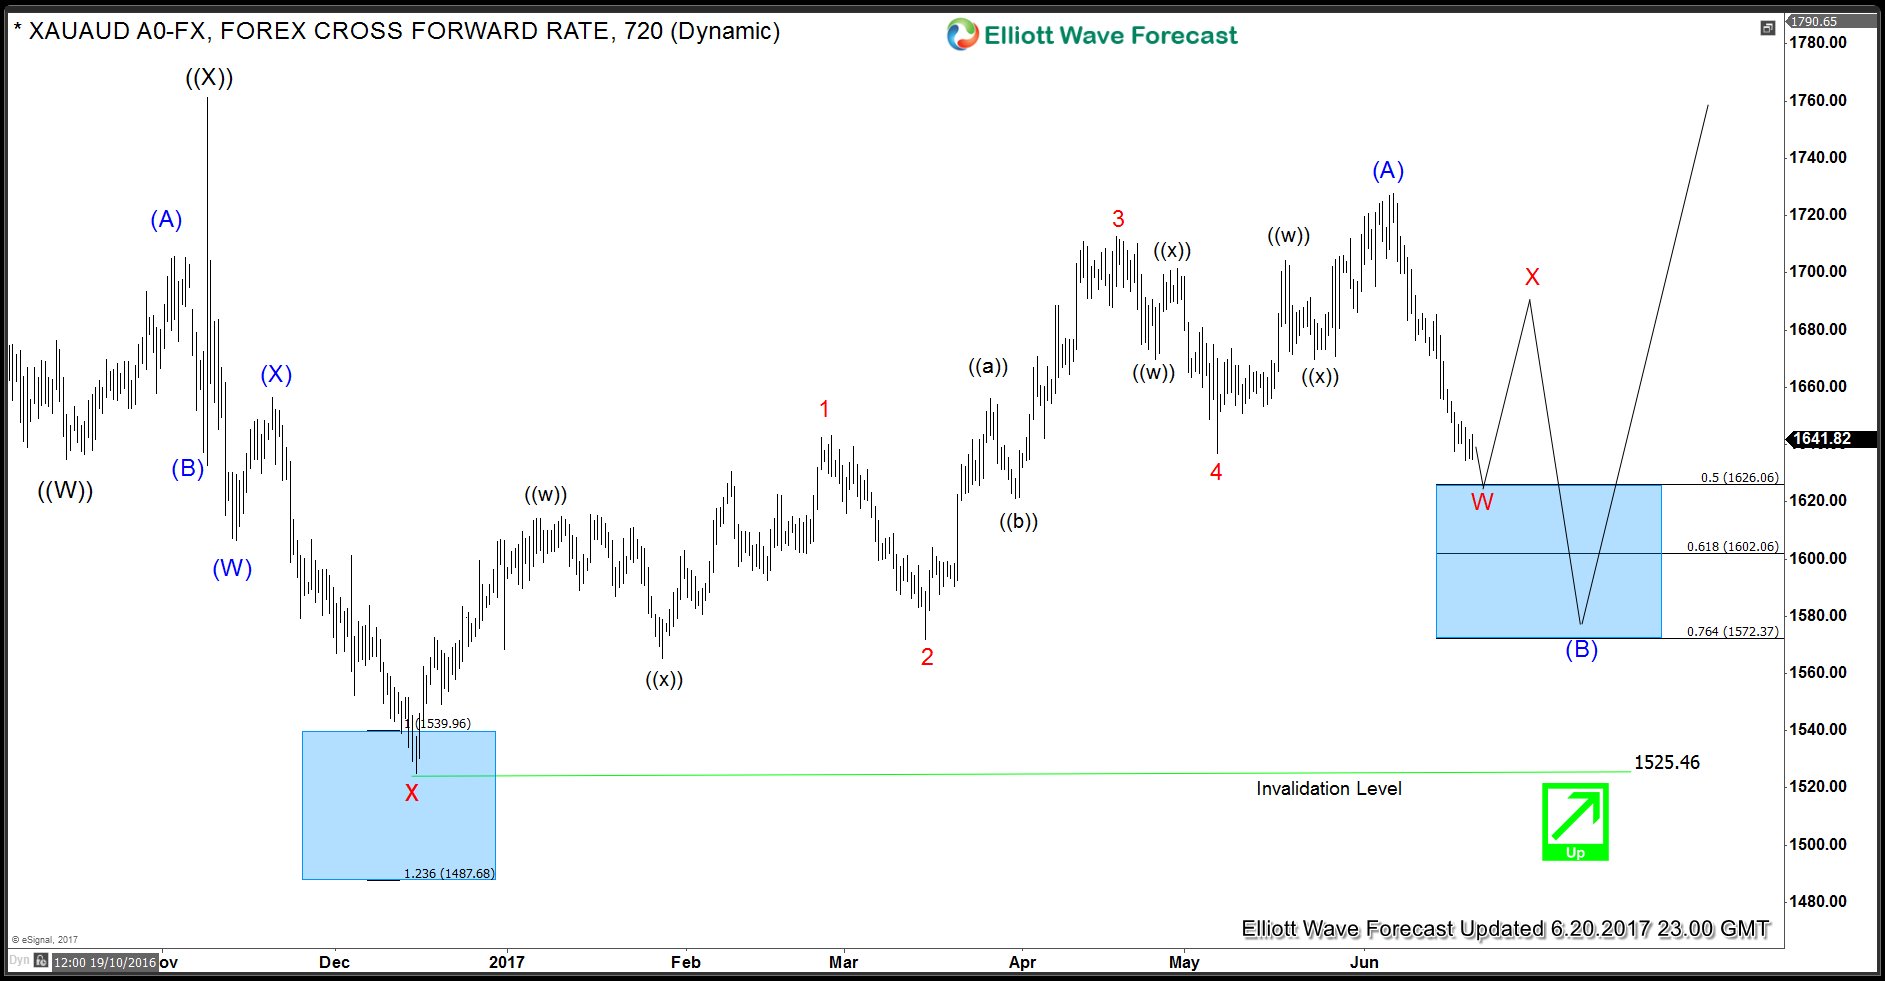
XAUAUD Elliott Wave Diagonal in wave (A)
The yellow metal has ended the cycle from 12/15/2016 (1525) low at 1727.59. The move-up from 1525 low could be viewed as an Elliott Wave Diagonal structure, i.e wave (A). A pullback in wave (B) should unfold in 3, 7 or 11 swings and hold above 1525 low for extension higher. 1626 – 1602 is 50 – 61.8 Fibonacci retracement area of wave (A) and could complete all of wave (B) or ideally complete just wave W of (B) which would be followed by a bounce in wave X and another push lower to complete wave (B). GCC (Wisdom Tree Commodity Index Fund) Elliott wave structure and sequences supports the idea of a double three correction in wave (B).
(Click on image to enlarge)
XAUAUD FLAT in wave (X)
If the cycle from 6/6/2017 (1727.59) extends, then we could consider cycle from 12/15/2016 low to be over at 4/18/2017 (1712.75) i.e. wave (W) followed by a FLAT in wave (X) which should still end between 1618 – 1568 area and then we can see the yellow metal resuming the rally or making a larger 3 waves bounce at least.
(Click on image to enlarge)

Disclosure: None.


