
Why The Stock Market Must Fall Hard Monday
I have been warning for over a week now about a coming waterfall decline. The wave counts and cycles are at the point where I believe it is a virtual impossibility for the market not to implode Monday for the biggest one day loss of the year.
This next chart shows the daily e-wave count:
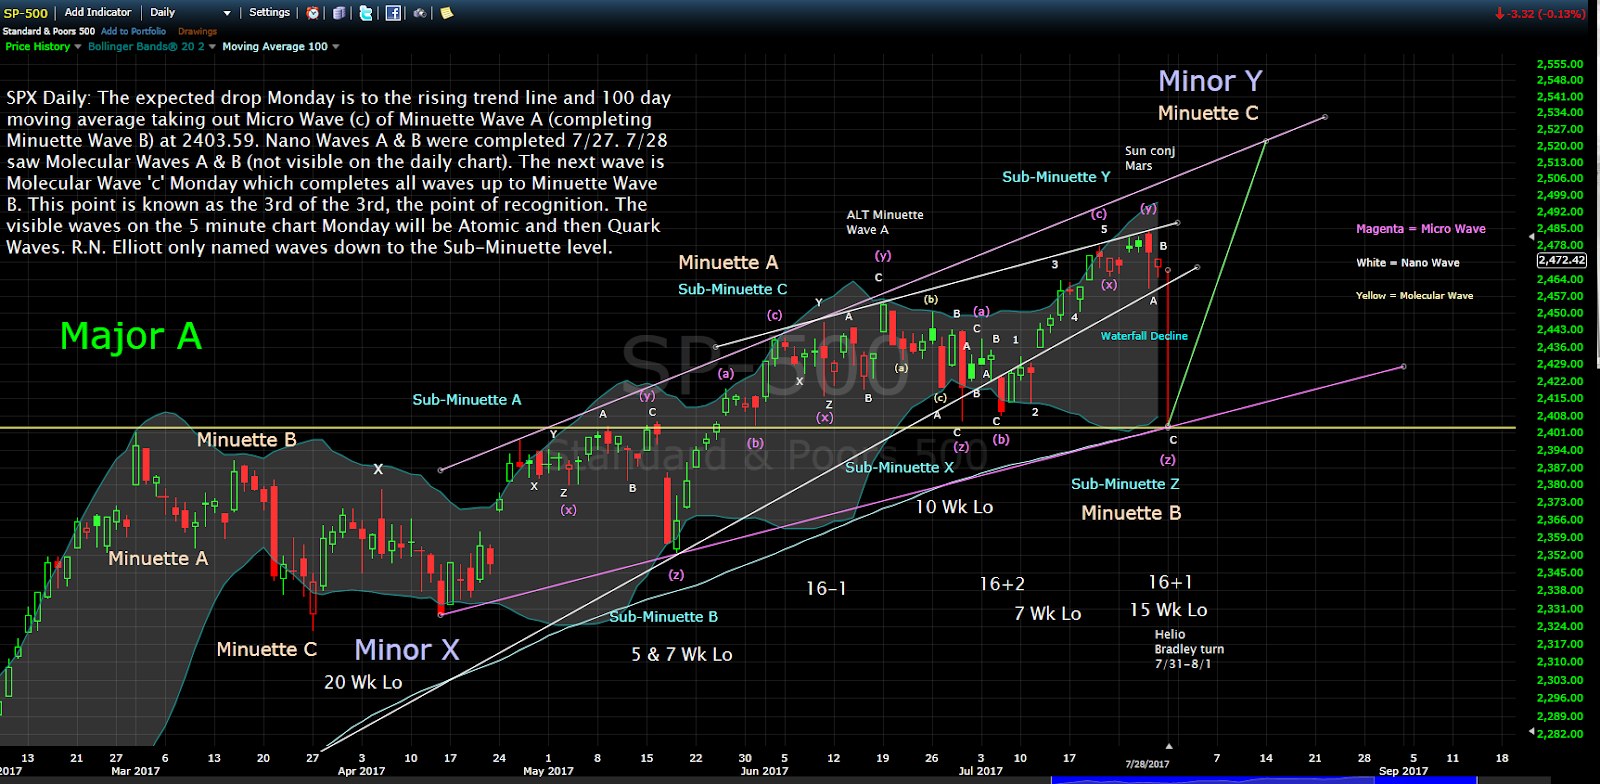
Now when we view the hourly chart (below), we see that we are down to the wire, the 3rd of the 3rd so to speak. Notice also the rising wedge pattern (above) with earlier false break.

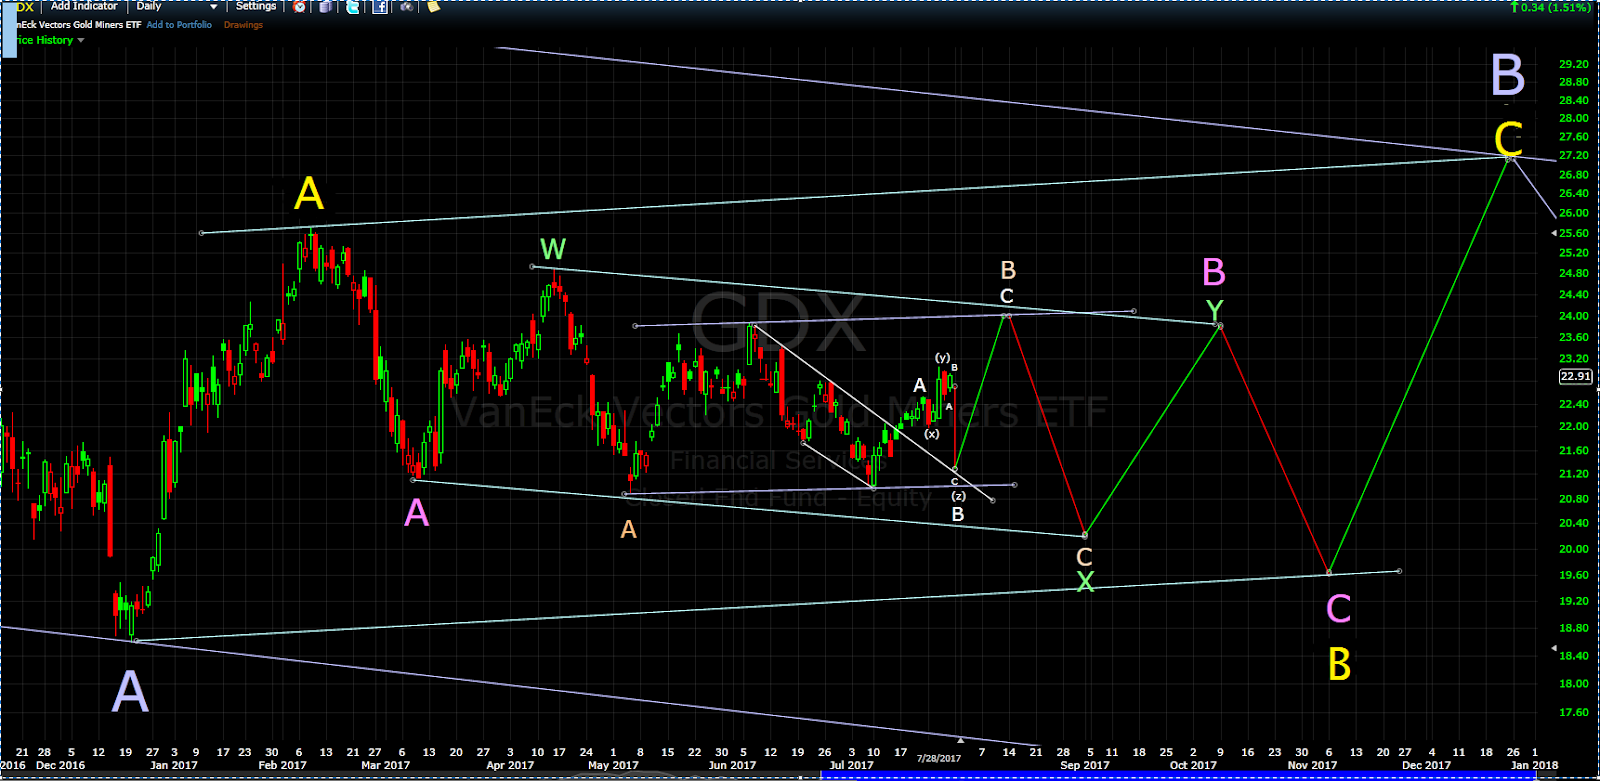
Next we view the daily chart of the GDX and future expectations (change dates 7/31, 8/14, 9/1, 10/9, 11/6, 12/22).
Next is a daily chart of the Dow Transports, which are breaking down badly and unlikely to recover with the expected new highs on the Indu, SPX and NDX August 14.

BluStar Market Timer is offering “one free week trial” to all new subscribers.
Contact us at: http://www.blustarmarkettimer.info/
Disclaimer: The information provided by the ...
more

