
Why Gold Should Be Accumulated At These Levels
Here are a few reasons why gold should be accumulated at these levels:
1. Rising Interest Rates
Although gold rose significantly from 2001 to 2011, it was not really the ideal conditions. There were many reasons for conditions not being ideal, such as rising stock markets and major commodities like oil (more markets rising means more competition for investment).
However, now I would like to focus on only interest rates. The direction of interest rates is normally indicative of a type of economic condition that exists. During the period from 2001 to 2011 interest rates were falling, and this was indicative of economic conditions that are less than ideal for gold prices.
In fact, these falling interest rates were in some way facilitating significant rises in the stock market and oil for example, which are investment classes competing with gold.
Interest rates turned in 2016, and this indicates conditions that will be ideal for gold is forming. Interest rates are an indication of the value the market place on debt. If interest rates are declining then a higher value is placed on debt.
If interest rates are rising, then a lower value is placed on debt. Gold and debt are basically completely opposite asset types. So, when interest rates are falling then a lower value is placed on gold and vice versa.
Below, is a chart that compares gold prices to interest rates:
(Click on image to enlarge)
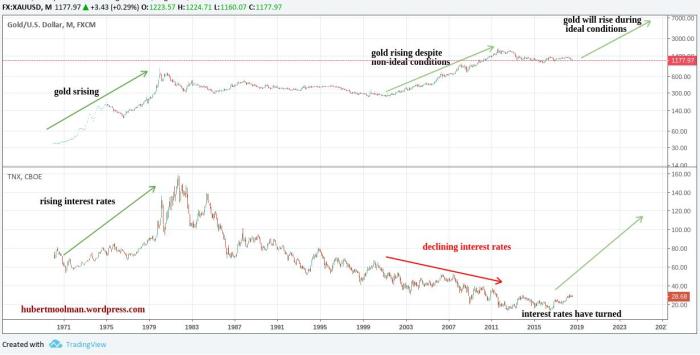
The 70s gold rally occurred during ideal conditions – when interest rates were generally rising. However, the gold rally from 2001 to 2011 occurred during falling interest rates, which is less than ideal.
With the coming rising interest rates, gold will rise much more and much faster than it did during the 2001 to 2011 bull market phase. It will rise until interest rates are at relatively high values, so that debt is valued very low.
2. The relationship between gold and the South African Rand/US Dollar (USD/ZAR) exchange rate
This is more of a technical reason. Below, is a long-term USD/ZAR chart:
(Click on image to enlarge)
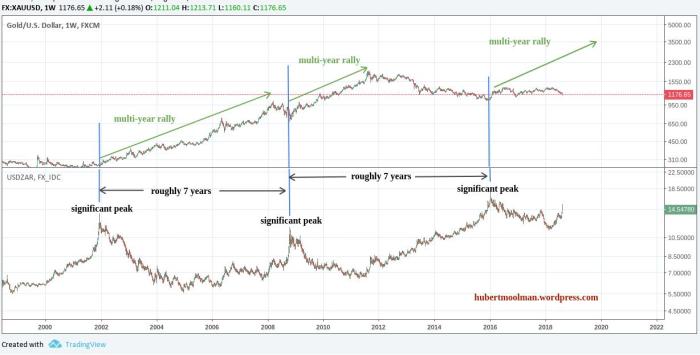
I have highlighted three significant peaks of the USD/ZAR chart. These were formed roughly seven years apart. This ratio tends to spike significantly before major market events or turnarounds.
After each of the first two significant peaks (2001 and 2008), a multi-year gold rally followed. Currently, gold prices are higher than the level it was at the last USD/ZAR peak, but it has not really taken off yet. The probability that it will accelerate higher over the coming months and years are really high.
Furthermore, it appears that another spike is currently forming on the USD/ZAR chart. This indicates that we will likely have a gold rally in the short-term. It also is possibly signaling a change in acceleration of gold rising, as measured from the last USD/ZAR spike (of January 2016).
For more on this and this kind of fractal analysis, you are welcome to subscribe to my premium service. I have also ...
more


Makes sense.