
This Or That 10-22-16
Is it over yet?
The election I mean.
I am sure I am not the only one who has likely reached the max capacity of election fatigue. It reminds me of the “This Or That” game where players are given a choice to make with equally bad outcomes in many cases. Such as:
“Would you rather be eaten by zombies OR still be married to your ex?”
However, in this case, the questions would likely be:
“Would you rather be mauled by a bear OR watch another debate between the candidates.”
OR
“Would you rather be burned alive at the stake accused of witchcraft OR read another post on why one candidate is better than the other.”
You get the point. The zombie, bear, and death by fire are getting a majority of the votes.
But, it’s not just the election that is weighing on me, but the indecision of the markets as well.
As I noted last week:
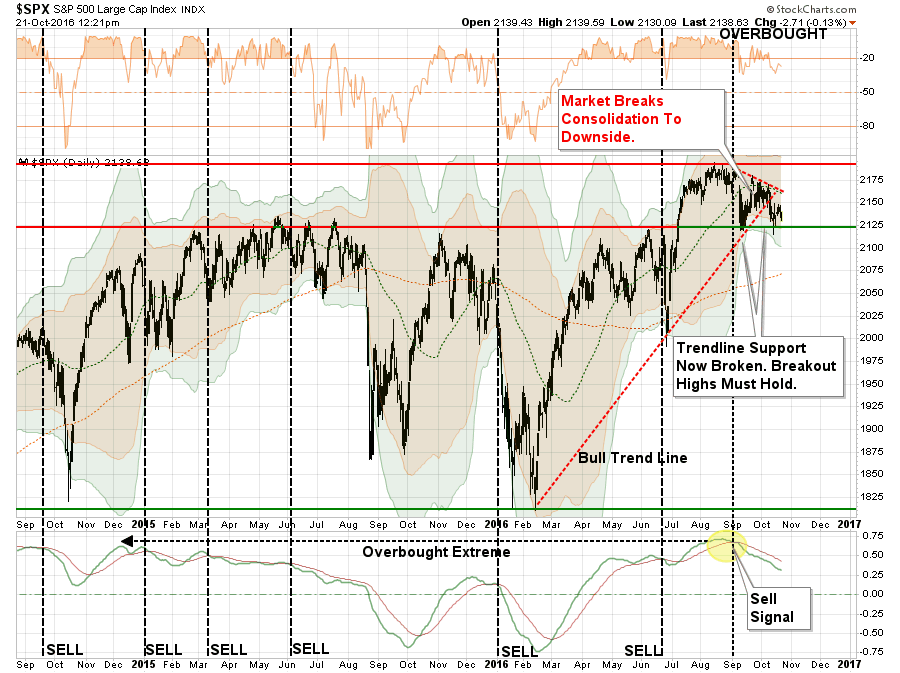
“Importantly, the market broke that bullish trend line this past week with the market remaining overbought and on a ‘sell signal.’ These combined events put further downside pressure on the markets into next week.“
Chart Updated Through Friday Morning
“If we zoom in we can get a little clearer picture about the breakdown.”
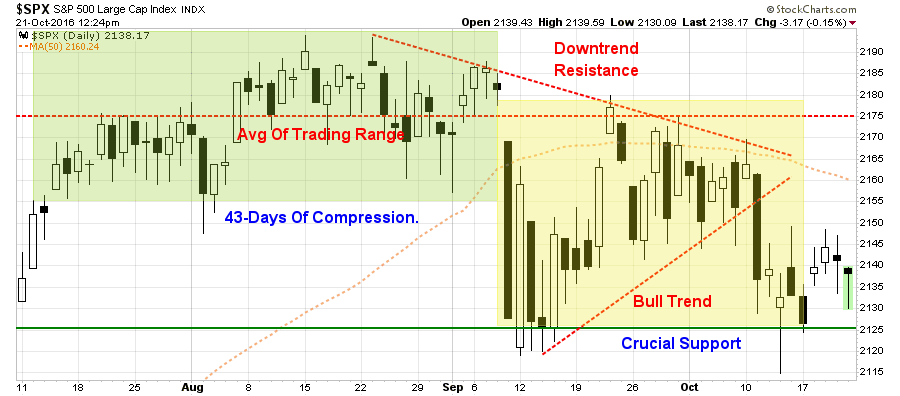
The two dashed red lines show the tightening consolidation pattern more clearly.
Currently, the market has been able to defend crucial support at the level where the markets broke out to new highs earlier this year. However, the market now finds itself “trapped” between that very crucial support and a now declining 50-dma along with the previous bull trend support line.
Importantly, the “sell signal,” which is shown in the lower part of the first chart above, suggests that pressure remains to the downside currently.
However, there is a concerted effort currently to keep prices elevated over the last week. Following the bounce off of the critical 2125 level this past week, the market has consistently fought off weak openings and has rallied back into the close. This is shown in the chart below.
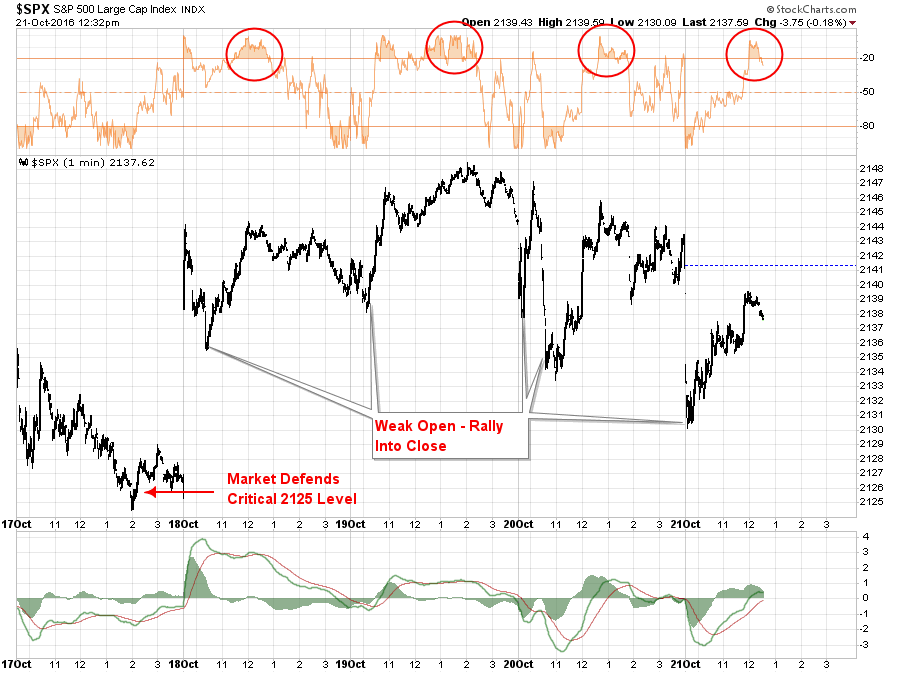
The red circles denote when the market had reached extreme overbought levels during the trading day which typically denoted the limit of the upside advance for the day.
The broader point to be made here is that while the market is defending its current support level at 2125, the question is whether the market can muster the momentum to reconstitute the bullish trend into the end of the year.
As shown, the longer the market languishes below the downtrend line, and the previous bullish trend line from the February lows, the sharper the rise needs to be to re-establish the bullish trend. It would currently require a move to 2200 to accomplish that feat next week.
While such a move is certainly quite feasible, there is a substantial level of resistance currently weighing on the markets. The 50-dma moving average has begun to trend lower, the downtrend resistance from the previous market highs remains present and the “sell signal” occurring at high levels suggests the risk of a further correction has not currently been eliminated.
It is important, as an investor, is not to “panic” and make emotionally driven decisions in the short-term. All that has happened currently is a “warning” you should start paying attention to your investments.
With earnings season now in full swing, a pickup in volatility is certainly expected. However, so far, the earnings have been a mixed bag with several companies pointing to the election as a reason for missing earnings. While the election is certainly an easy culprit to point to, the reality is much more likely a strong dollar/weaker economy and consumer story that is actually weighing on their earnings.
Case For A Much Stronger Dollar
Last week, I updated my outlook for a stronger dollar. To wit:
“While Central Banks have gone all in, including the BOJ with additional QE measures of $100 billion, to bail out financial markets and banks following the ‘Brexit’ referendum, it could backfire badly if the US dollar rises from foreign inflows. As shown below, a stronger dollar will provide another headwind to already weak earnings and oil prices in the months ahead which could put a damper on the expected year-end ‘hockey stick’ recovery currently expected.”
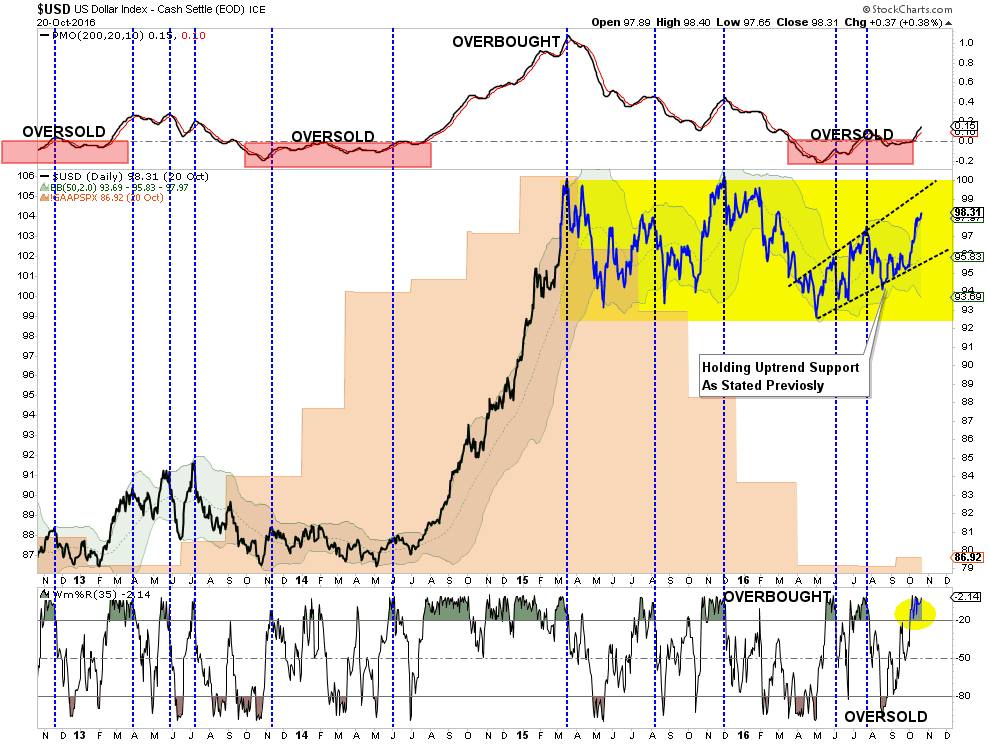
Of course, the real problem of a stronger dollar at this juncture is that it weighs on exports which comprise about 40% of corporate earnings. As I stated last week:
“The dollar rally could be a real problem with respect to the earnings recovery story going into the end of the year. With an already weak economy, a stronger dollar means weaker exports for companies and a drag on corporate profitability.”
Just this past week Elena Holodny penned an interesting note suggesting the same:
“A Morgan Stanley team led by Hans W. Redeker argued in a recent note the ‘foundation for a powerful USD rally is in place. In many aspects, the USD outlook is stronger than it was last year. Valuation has moderated and the market is expecting fewer hikes over the next 12 months than it did at this time last year. With only 27bp priced in, including 15bp in December, there is less scope for hikes to be priced out. As a result, risk appetite may suffer in response to any downside surprise in growth, in turn boosting the USD.’“
They are correct in the assumption the Fed is unlikely to hike rates at all this year as “economic uncertainty” remains going into the end of the year. Given the current slate of economic data showing deterioration, combined with a stronger dollar weighing on exports, a corresponding weakness in asset prices should not be unexpected.
Yellen Rationalizes Financial Bubble
In a very interesting note from Jesse Felder last week, he lays out a pretty compelling case for a Fed driven asset bubble. To wit:
“‘Asset values aren’t out of line with historical norms.’ -Janet Yellen, 9/21/16
‘A reliable way to make people believe in falsehoods is frequent repetition, because familiarity is not easily distinguished from truth. Authoritarian institutions and marketers have always known this fact.’ -Daniel Kahneman
Janet Yellen has obviously read Kahneman’s work. That’s the only way I can think of to explain what she said about “asset values” yesterday. She hopes that if the Fed, probably the greatest “authoritarian institution” on the planet today, says it enough then people will just take it as fact.
However, the facts are the median price-to-sales ratio for the S&P 500 has never been higher than it is today. Indeed, it’s never been anywhere near this high.”
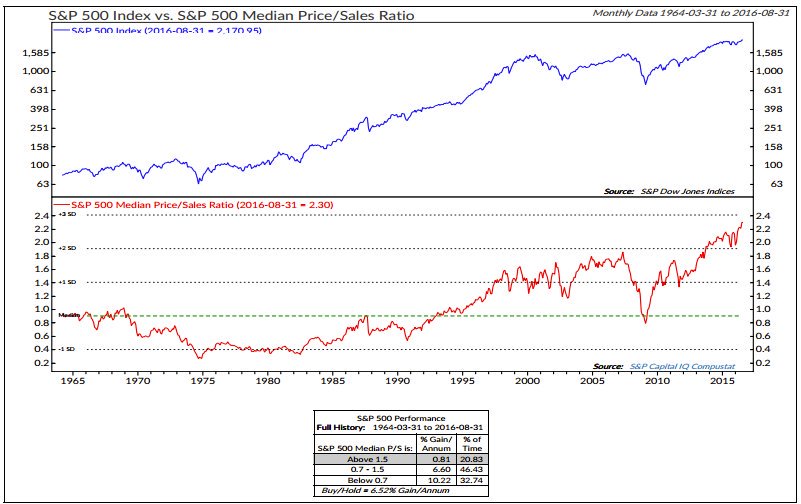
Of course, what most people don’t understand, is that regardless of whether you are a manufacturing or service business the growth requirement needed to sustain a P/S ratio above 2.0 is onerous at 15% compounded annually into infinity.
Do the math on the stocks you own at 3x, 5x and 10x price-to-sales.
To put a finer point on this, Scott McNealy, the CEO of Sun Microsystems, once said:
“Two years ago we were selling at 10 times revenues when we were at $64. At 10 times revenues, to give you a 10-year payback, I have to pay you 100% of revenues for 10 straight years in dividends.
That assumes:
- I can get that by my shareholders.
- I have zero cost of goods sold, which is very hard for a computer company.
- I have zero expenses, which is really hard with 39,000 employees.
- I pay no taxes, which is very hard.
- You pay no taxes on your dividends, which is kind of illegal.
- I will have zero R&D for the next 10 years, and;
- I can maintain the current revenue run rate.
Now, having done that, would any of you like to buy my stock at $64? Do you realize how ridiculous those basic assumptions are? You don’t need any transparency. You don’t need any footnotes. What were you thinking!”
By the way…here are a few stocks in the S&P 500 you are paying a 10x P/S for right now:
As Jesse goes on to note:
“If by ‘historical norms’ Ms. Yellen is referring to just the past 20 years of Fed-induced asset bubbles then yes, asset values aren’t necessarily ‘out of line.’”
“I think she knows better. The past 20 years are a historical aberration culminating in a financial bubble that is now more pervasive than anything we have ever seen before. It’s not just stocks or bonds or real estate this time; it’s all of the above. I am certain she hopes the Fed can engineer a ‘permanently high plateau’ simply because it’s too difficult to imagine otherwise. But students of history understand that there is no amount of ‘frequent repetition of falsehoods’ that can overcome the truth.”
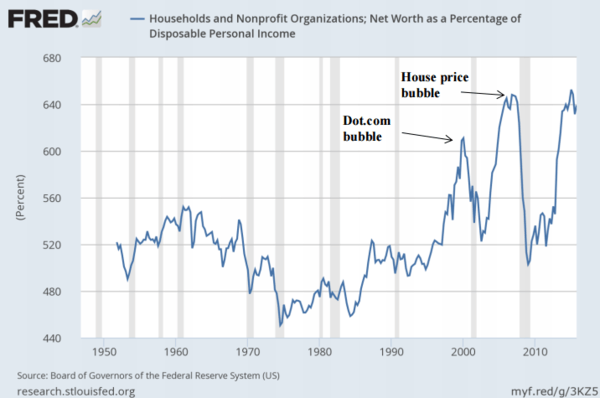
Jesse’s thought was further fleshed out by Dr. Daniel Thornton via HedgEye:
“By 2015Q1, household wealth had surpassed its 2006Q4 peak. This time the rise in wealth was fueled by both equity and house prices. The relevant question is: Is the 100 percentage point rise in household net worth sustainable, or will house and equity prices fall dramatically again?
The latter answer seems most likely. One reason is the behavior of household net worth has been unusual since the mid-1990s. The graph below shows the level of household net worth over the period 1952Q1 to 2015Q4. The graph also shows a quadratic trend line estimated over the period 1952Q1 to 1994Q4 and extrapolated to 2015Q4.”
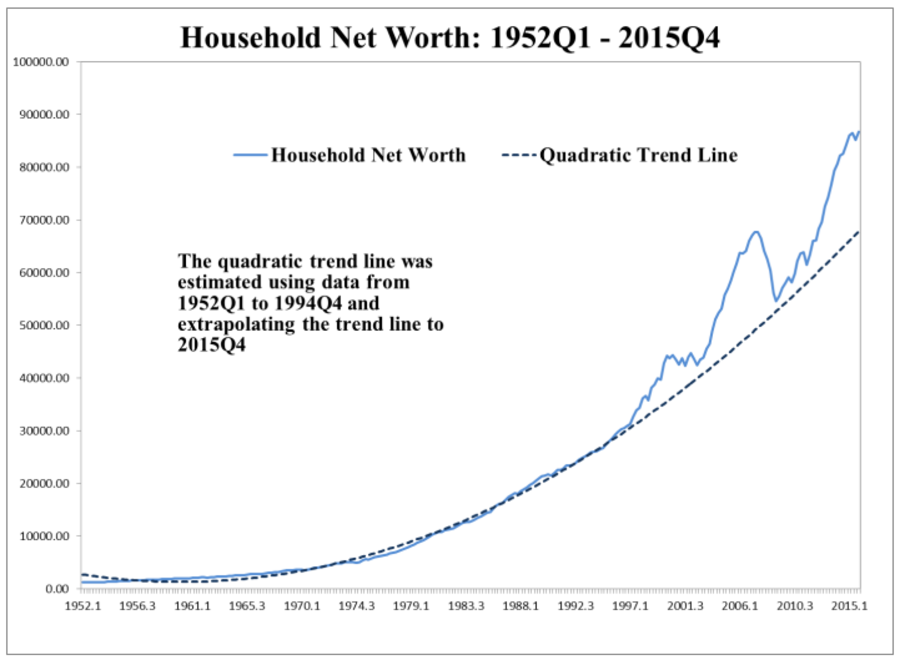
“During the entire period from 1952Q1 to 1994Q4, household net worth tracks the trend line very closely. Since 1995Q1, however, household net worth has been consistently above the trend line and the gap has been getting progressively larger. Such behavior would be a concern in any circumstance, but it is particularly troubling because we know that the previous two boom cycles were followed by busts. The recent rise in household net worth has not been accompanied by a correspondingly large increase in output or the price level. Hence, it too does not appear to be supported by economic fundamentals—it appears to be unsustainable.”
Obviously, the Fed’s ongoing monetary policy is the culprit.
The current level of household net worth and valuations are not sustainable and, at some point either sooner or later, the piper will have to paid. Of course, don’t be at all surprised when the response to the bursting of the third bubble since the turn of the century is simply more of the same misguided monetary and fiscal policies as in the past.
Unfortunately, Jesse and Daniel are correct and it will only once again be understood well after the fact.
Stocks & The Election Cycle
As I stated at the beginning of this missive, the election cycle is weighing on me. However, it also is weighing on the markets as well. As noted by Mark DeCambre via MarketWatch on Friday:
“Part of the sideways trade stems from uncertainty surrounding the coming U.S. presidential election between Democratic nominee Hillary Clinton and Republican candidate Donald Trump, even as the winner appears to be more apparent with the final presidential debate in the books.
As technical analyst Tom McClellan has been pointing out, the stock market’s moves tend to adhere to the pattern of a second-term presidential cycle (see chart below):”
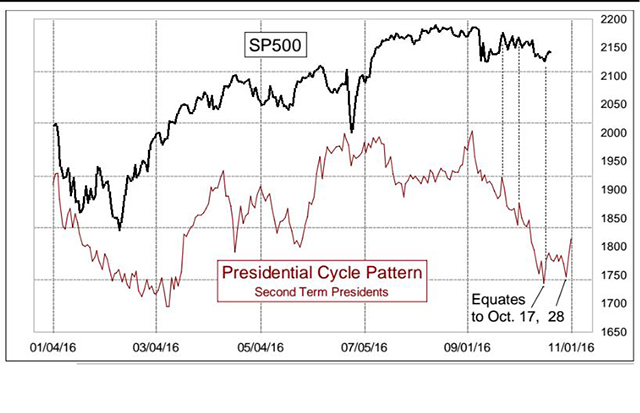
“We are not seeing the magnitude of a decline that it suggests, but the movements are in sync. We got the bottom Oct. 17 right on schedule, and there is another one due a few days ahead,” McClellan wrote in a recent note.
Of course, it is the Central Bank moves that will be a bigger influence particularly as the economic and earnings data continues to unfold. The belief that the Federal Reserve will hike rates in December—not at its next meeting in November with the White House in play—is near its highest of the year, with the market pricing in a roughly 75% chance. Very likely those odds will fall once the election is past and the focus returns back to the economy.
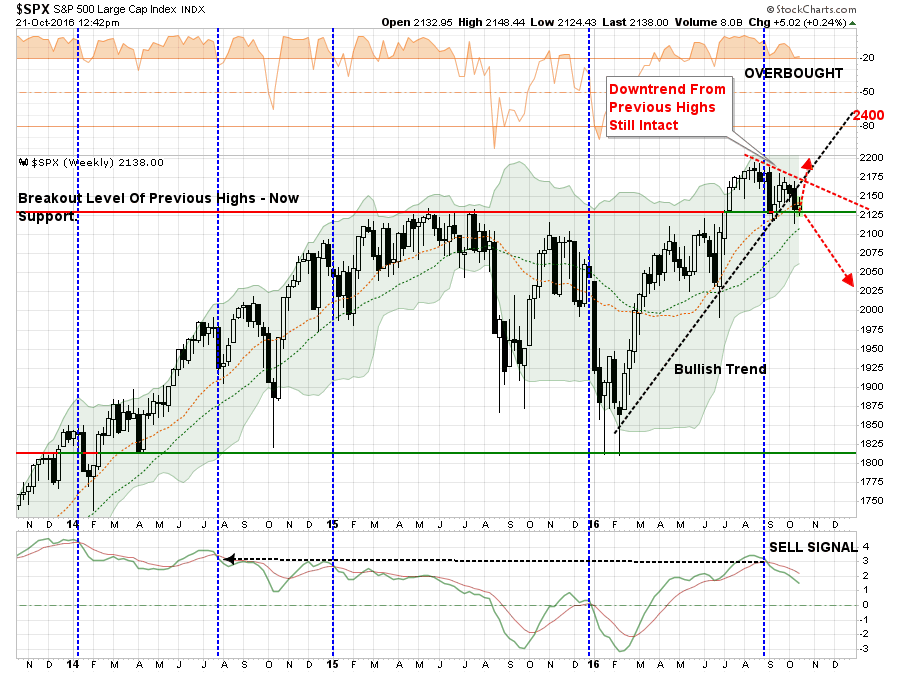
With both breadth and momentum deteriorating in the market, as shown in the chart below, it will be critical for the markets not to fail at current levels of support in the “bullish” story is going to continue.
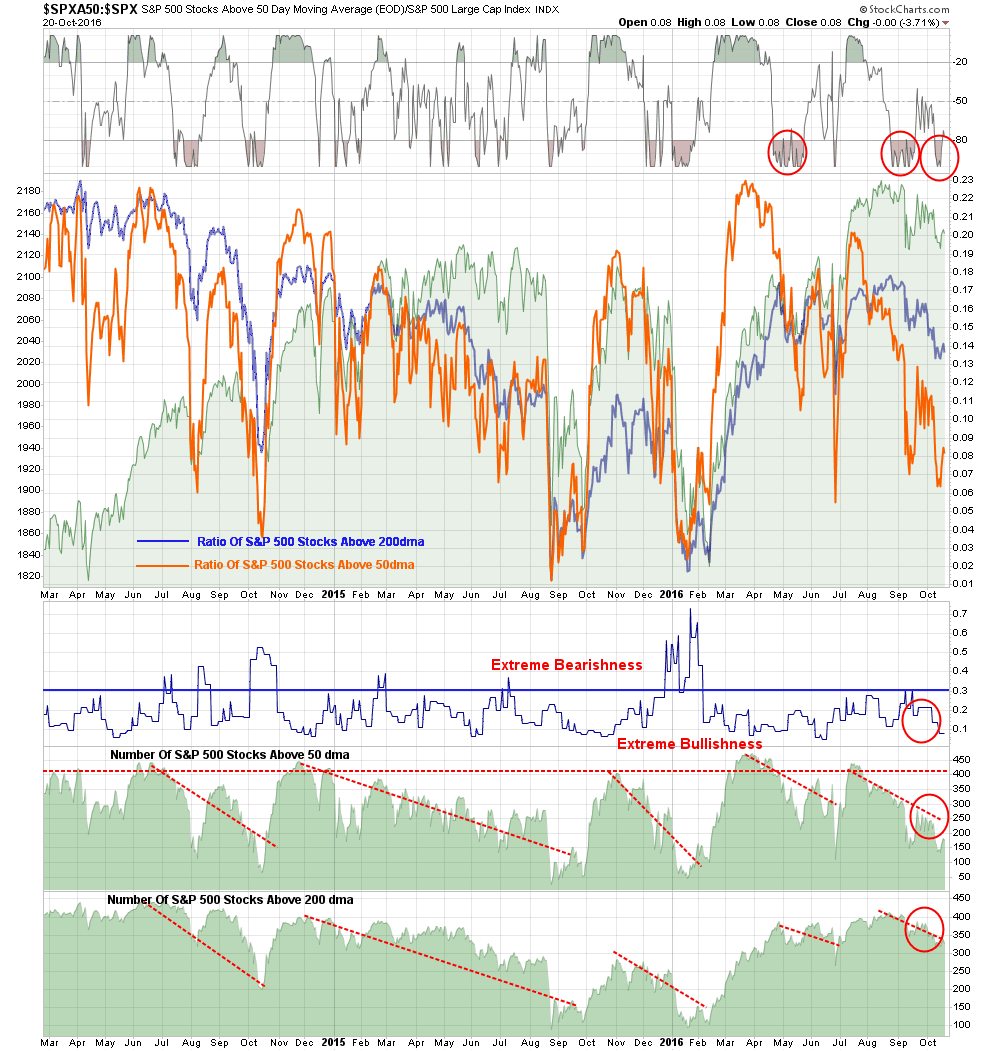
Hang on to your hat, the ride is likely only going to get more bumpy as we head towards the end of the year.
THE MONDAY MORNING CALL
The Monday Morning Call – Analysis For Active Traders
Risks Remaining For The Rest Of The Year
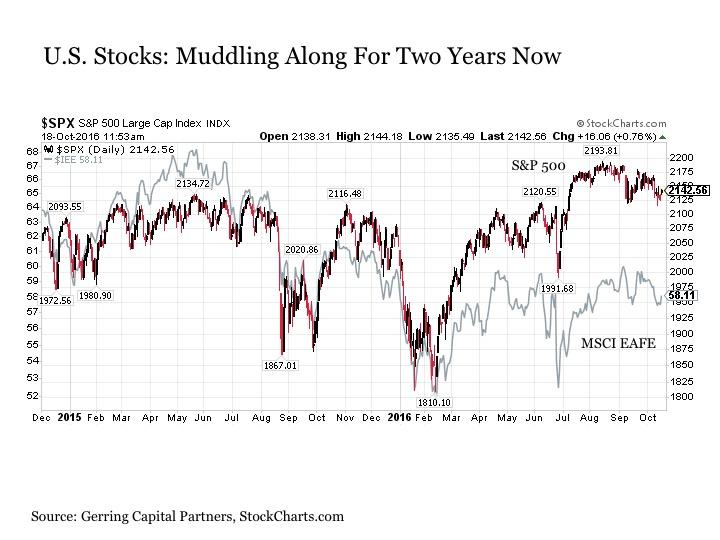
It is interesting that many people believe the stock market has actually been doing well. However, the reality is that for the past two years the market has actually not gone anywhere. This was a point noted by Eric Parnell via Seeking Alpha just recently:
“Although the U.S. stock market is barely higher than it was nearly two years ago when the Fed’s QE3 mega stimulus program came to an end, it did recently touch new all-time highs as recently as August. It did also bounce back impressively from its tough start to the year and has shown much more verve than its developed market counterparts across the rest of the globe in regaining its footing. Moreover, it appears to be increasingly setting up for a solid year-end rally post-election during the historically supportive months of November and December.”
He is correct. On a short-term trading basis, as opposed to the longer-term outlook in the main body of this missive above, we are moving into the “seasonally strong” period of the year for stocks. However, there are many risks, even in the short-term, to consider as Eric notes.
- Other notable risks include the ongoing depreciation of the Chinese yuan currency, the ongoing instability in the European banking system, and the increasing realization that risks associated with ‘Brexit’ did not end but only just started with the conclusion of the vote back in late June.
- The S&P 500 Index is now trading at more than 26.2 times trailing as reporting earnings. This is a valuation that is venturing well into tech bubble territory at this point and comes at a time when corporate profit margins are in decline. And while extreme valuations during the tech bubble were heavy concentrated in selected sectors such as technology, media and telecom, today’s frothy valuations are more evenly spread across the entire sector spectrum. Put more simply, unlike the tech bubble, no stock investors should consider themselves safe from the effects of the next bear market once it finally arrives.
- One other persistent risk is the ever-present potential policy mistake or unexpected shift. This would include most notably a major global central bank suddenly shifting toward a more tightening policy stance. This risk is most pronounced out of China, which has recently been draining liquidity out of its financial system. While everyone refers to the so-called ‘taper tantrum’ of May-June 2013 as being the reason for the sudden and sharp stock and bond market sell off at the time, the far greater reason was the fact that the Chinese interbank lending market had effectively seized up at the exact same time.
- Lastly, is the constitutional referendum vote in Italy set for Sunday, December 4. Why exactly would global investors care about the outcome of a constitutional referendum in Italy in the coming weeks? Because the outcome has the very real potential to turn what was an isolated incident in the United Kingdom leaving the European Union suddenly into a trend.
So, while there is a potential the market could hold onto support long enough to muster up a rally into the year end, there are mounting risks that something could indeed go horribly wrong. As an investor, you will be well served to monitor events closely and adjust portfolio risk accordingly depending on how events begin to play out.
No Secular Bull Market
On Monday, I discussed all the reasons why the markets, despite much media commentary to the contrary, have not entered into a new “secular bull market cycle.”
However, on Friday, I was having dinner with my friend Jeff Sandene from Marathon Wealth and discussing this issue specifically. He enlightened me as follows:
“The S&P 500, the subject of the passive index chase, is being distorted by the ongoing Global Central Bank interventions. In reality, the breadth of the advance is much narrow than most believe. This is particularly noticeable when looking at broader based indices such as the FTSE All-World Index.”
Narrow Bull Market II:
— Jeff Sandene, CFP® (@MarathonWealth) October 22, 2016
FTSE All World $FAW, 98% of global investable market cap (3,000+ companies). Below Nov '08 high...
cc: @LanceRoberts pic.twitter.com/BWnSE6iDkL
Just something I am thinking about and the potential implications therein.
Model Update
S.A.R.M. Sector Analysis & Weighting
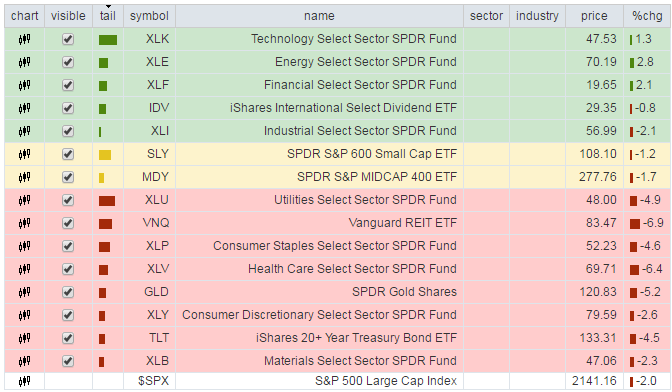
Taking a look at individual sectors of the market the deterioration of momentum and breadth becomes much more evident. The first chart below are the major sectors of the S&P 500 index.
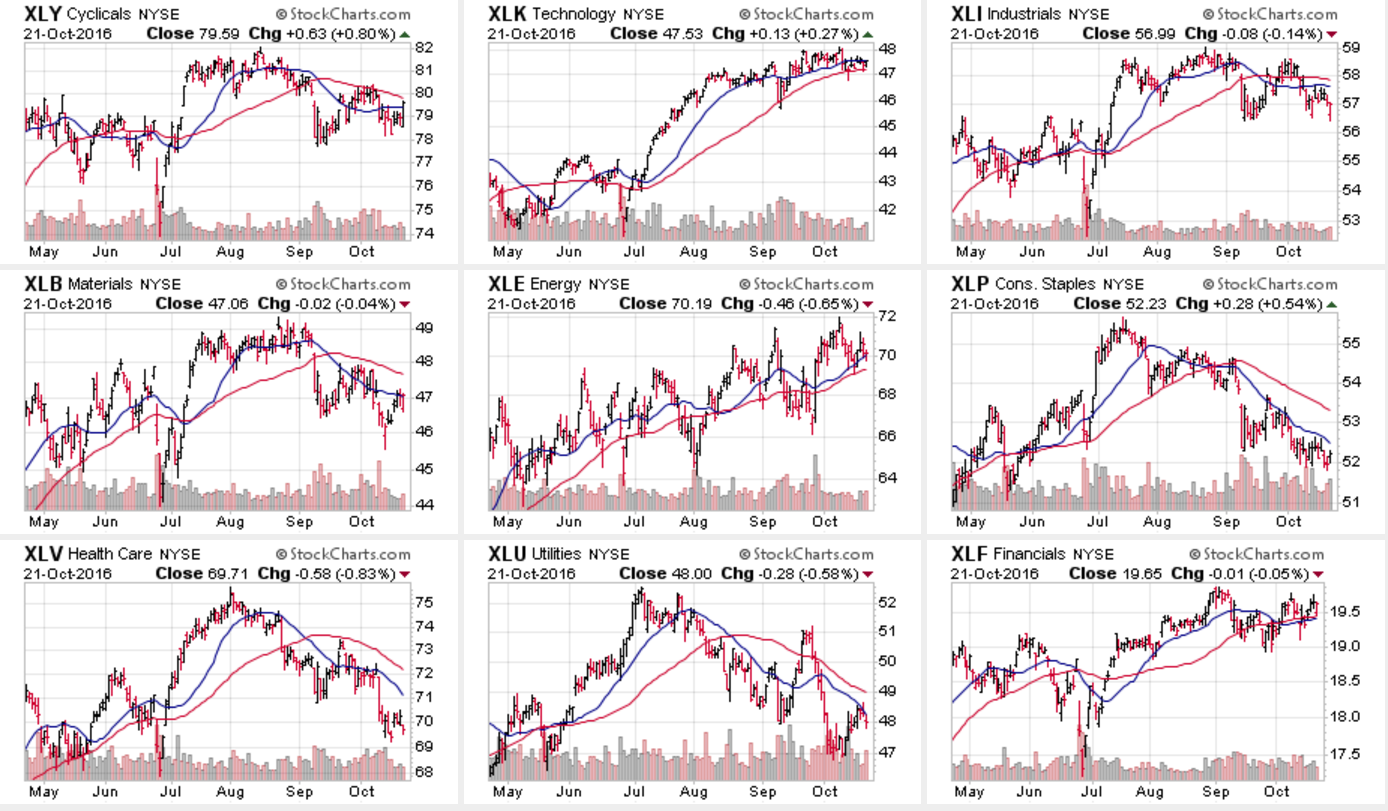
As you will notice 7-out-of-9 sectors have registered short term sell signals with the short-term moving average crossing below the long-term moving average. Furthermore, the majority of the leadership for the current market has come from the technology sector where the momentum of the advance has slowed sharply.
Moving on to other major sectors we find some similar patterns emerging.
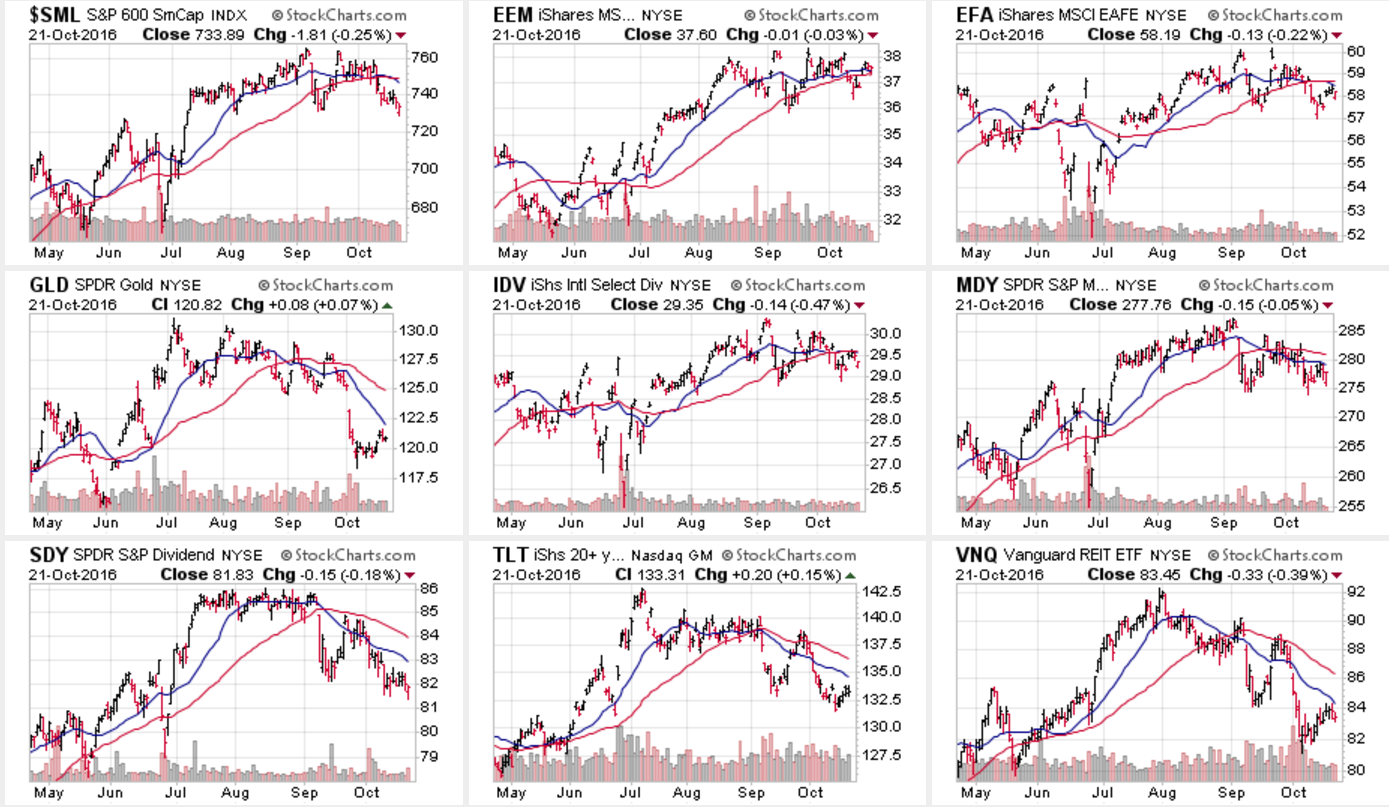
Once again we find the majority of major indices registering sell signals and seeing deterioration among the previous leadership.
With the dollar strengthening, interest rates remaining elevated and labor costs on the rise, the risk to corporate profitability is elevated. If earnings season comes in weaker than expected, the recent ability of the market to hold support at bullish levels may fail.
Caution remains a prudent investment stance currently.
I will update this analysis in Tuesday’s Technically Speaking post (click here for free e-delivery)
Let’s take a look at the equal weighted portfolio model.
(Note: This is an equally weighted model example and may differ from discussions of overweighting/underweighting specific sectors or holdings.)
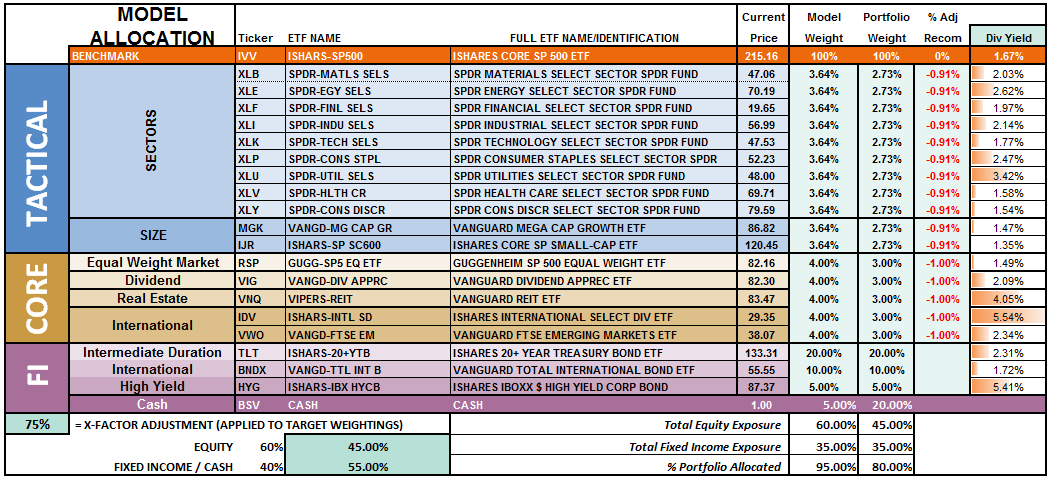
The overall model still remains underweight target allocations. This is due to the inability of the markets to generate a reasonable risk/reward setup to take on more aggressive equity exposure at this time.
Relative performance of each sector of the model as compared to the S&P 500 is shown below. The table compares each position in the model relative to the benchmark over a 1, 4, 12, 24 and 52-week basis.
Historically speaking, sectors that are leading the markets higher continue to do so in the short-term and vice-versa. The relative improvement or weakness of each sector relative to index over time can show where money is flowing into and out of. Normally, these performance changes signal a change that last several weeks.
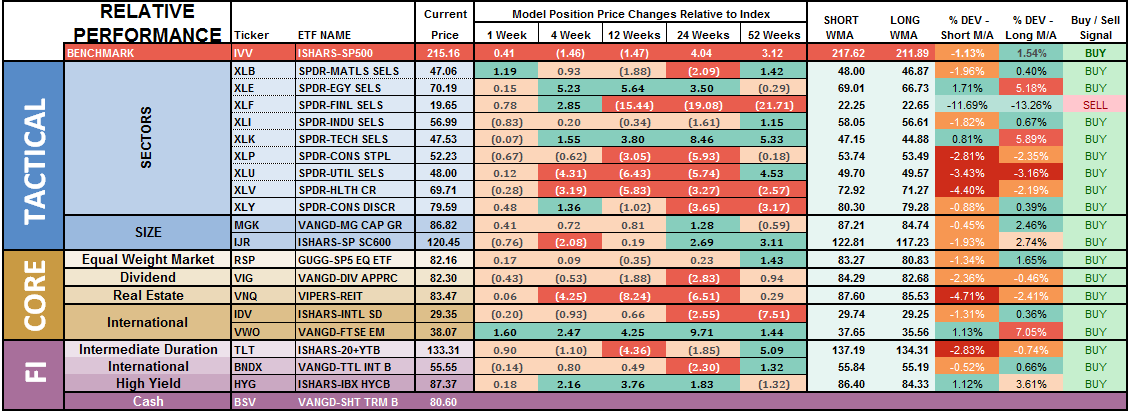
Notice in the next to the last column to the right, the majority of sectors which have previously been pushing extreme levels of deviation from their long-term moving average, have corrected much of those extremes.
Importantly, Financials have now registered, as shown in the last column, a “weekly sell signal” which suggests further weakness in the sector in the near to intermediate term.
There is a broad deterioration across sector performance which suggests overall weakness in the markets will likely continue in the near-term. Some caution is currently advised.
The chart below is the “spaghetti” chart, via StockCharts, showing the relative strength/performance rotation of sectors relative to the S&P 500. If we are trying to “beat the index” over time, we want to overweight sectors/asset classes that are either improving in performance or outperforming the index, and underweight or exclude everything else.
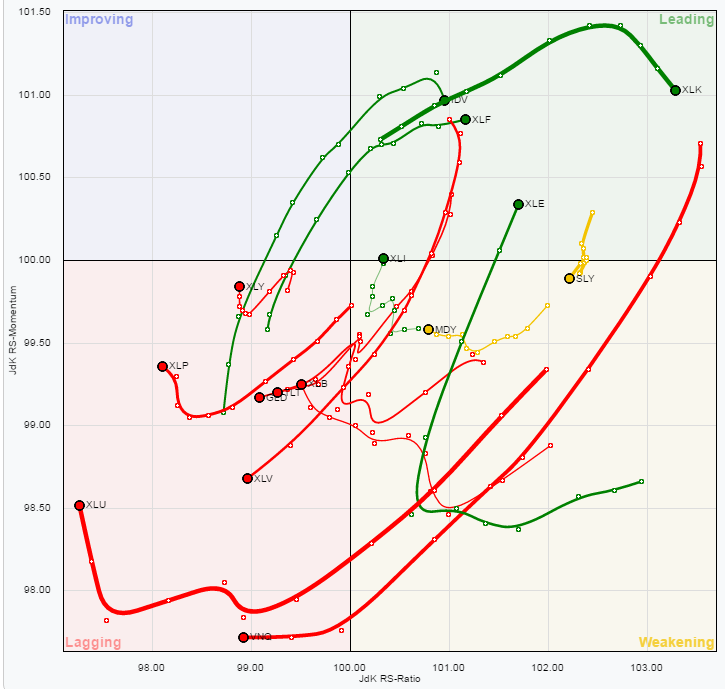
Utilities, REIT’s, Staples, Discretionary, Materials, Bonds, Gold, and Healthcare have remained under pressure this past week. However, Utilities, Staples, and Discretionary have begun showing signs of improvement. With the rise in rates largely done, sectors with the most benefit from falling rates look reasonable.
The opposite holds true for those sectors that are adversely affected by a stronger dollar and weaker oil prices. With dollar tailwind still intact, and oil prices grossly extended, profit taking in emerging markets and energy stocks seems logical.
As I stated in this missive last week:
“Lastly, we have remained aggressive buyers of bonds over the last few weeks in anticipation of a rotation back into safety. Such a rotation will likely coincide with weaker than expected economic data and any further correctionary action in markets following a short-term bounce likely next week.”
That bounce was nascent at best, and with the markets remaining overbought on a longer-term basis, bond holdings are still favored.
Most importantly, given that a bulk of the sectors remain either in weakening or lagging sectors, this suggests the current advance in the market remains on relatively weak footing.
Profit taking should also be focused on Technology stocks as the current outperformance of this sector has begun to fade as anticipated.
The risk-adjusted equally weighted model has been increased to 75%. However, the markets need to break above the previous consolidation range to remove resistance to a further advance.
Such an increase will change model allocations to:
- 20% Cash
- 35% Bonds
- 45% in Equities.
As always, this is just a guide, not a recommendation. It is completely OKAY if your current allocation to cash is different based on your personal risk tolerance, time frames, and goals.
For longer-term investors, we still need to see improvement in the fundamental and economic backdrop to support the resumption of a long-term bullish trend. Currently, there is no evidence of that occurring.
THE REAL 401k PLAN MANAGER
The Real 401k Plan Manager – A Conservative Strategy For Long-Term Investors
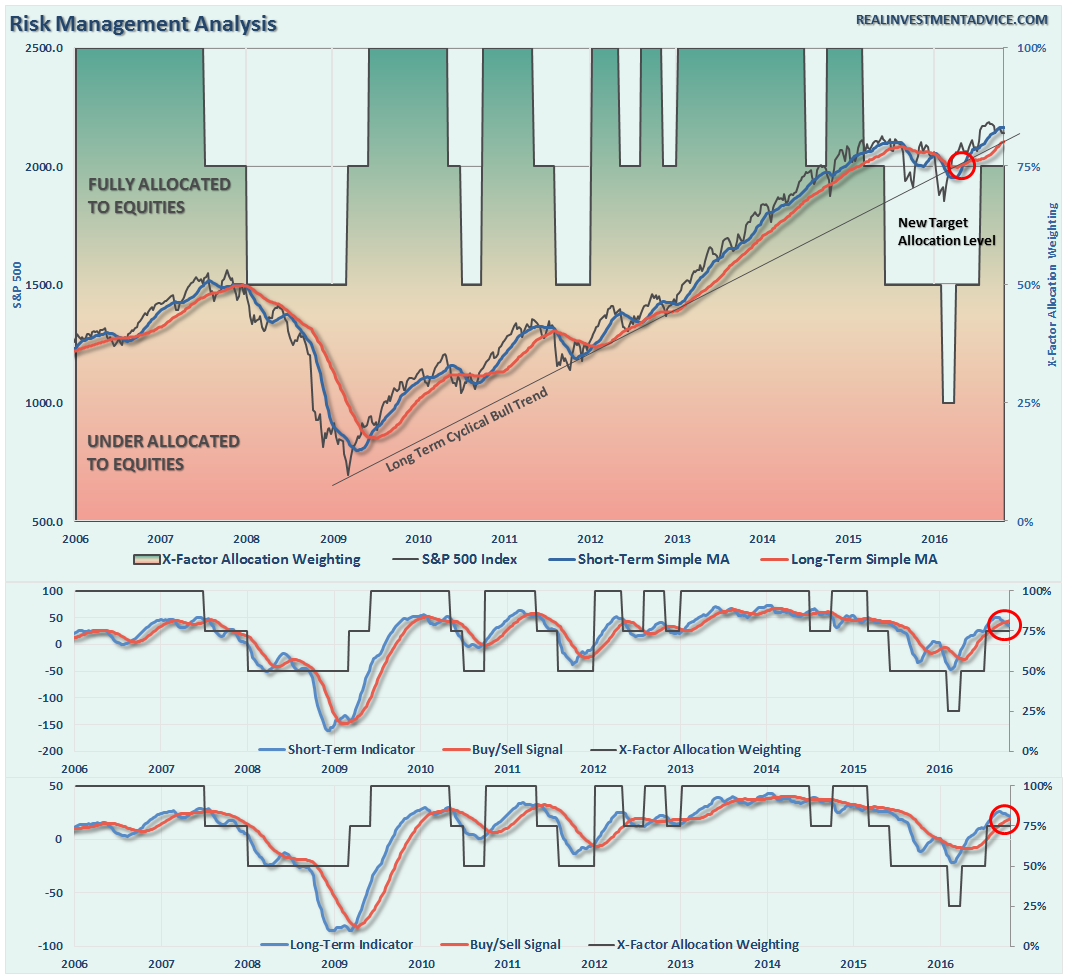
NOTE: I have redesigned the 401k plan manager to accurately reflect the changes in the allocation model over time. I have overlaid the actual model changes on top of the indicators to reflect the timing of the changes relative to the signals.
There are 4-steps to allocation changes based on 25% reduction increments. As noted in the chart above a 100% allocation level is equal to 60% stocks. I never advocate being 100% out of the market as it is far too difficult to reverse course when the market changes from a negative to a positive trend. Emotions keep us from taking the correct action.

Election Stasis
The good news is the market was able to hold 2125 last week keeping support in place. This holding of support keeps allocation models stable this week.
The bad news is a more important correction may have just started, however, it is too early to know for certain. We remain on high alert with our initial “sell signal” in place as shown in the chart above.
We remain cautionary in 401k allocations which has kept volatility low and principal safe. However, we will make changes accordingly depending on what the market decides to do next.
As noted last week:
“We are dangerously close to triggering a second sell signal, the bottom part of the chart, which will likely coincide with a failed rally attempt over the next week or two. Such an outcome would suggest a weaker market environment in the intermediate term with a high degree of caution required.”
Again, with early warning signals are suggesting the correction has more room to go, so let’s be patient once again this coming week.
With the election right around the corner, increased volatility is expected. Therefore, having a little extra cash in portfolios will likely be a good hedge for now. Sit tight for now and I will update you on Tuesday.
If you need help after reading the alert; don’t hesitate to contact me.
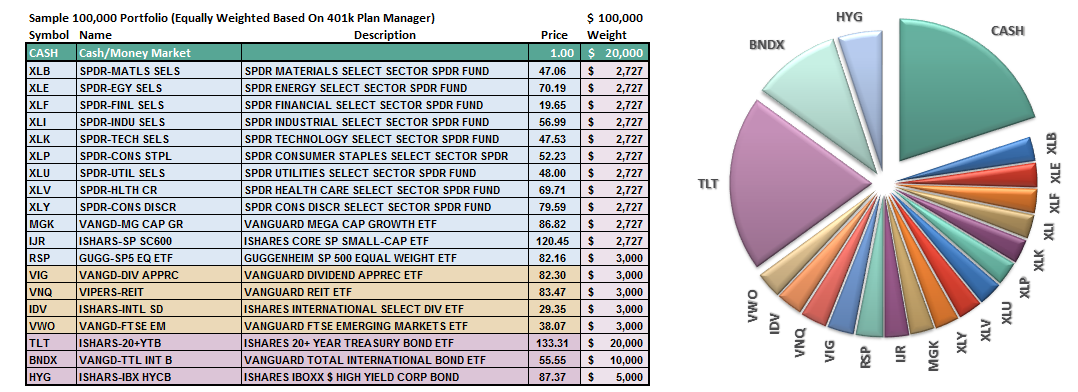
Current 401-k Allocation Model
The 401k plan allocation plan below follows the K.I.S.S. principal. By keeping the allocation extremely simplified it allows for better control of the allocation and a closer tracking to the benchmark objective over time. (If you want to make it more complicated you can, however, statistics show that simply adding more funds does not increase performance to any great degree.)

401k Choice Matching List
The list below shows sample 401k plan funds for each major category. In reality, the majority of funds all track their indices fairly closely. Therefore, if you don’t see your exact fund listed, look for a fund that is similar in nature.

Disclosure: The information contained in this article should not be construed as financial or investment advice on any subject matter. Streettalk Advisors, LLC expressly disclaims all liability in ...
more

