
The Most Important Chart Of 2016!
This chart courtesy www.macrotrends.net shows the price of gold compared to the US Monetary Base. The current ratio is at 0.30 and this is the lowest it has ever been. This makes gold the least expensive (compared to the monetary base), in history!
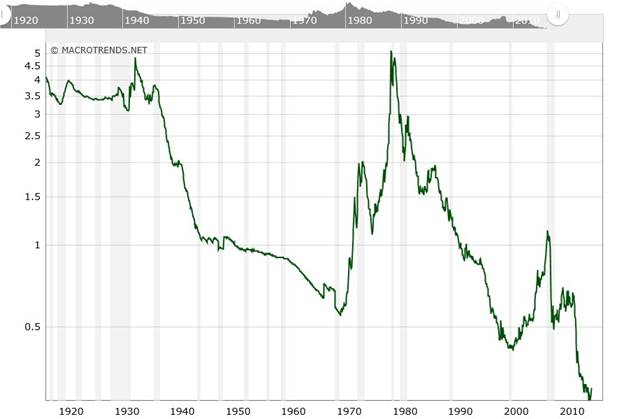
When this index turned up in early 1970, the gold price rose from around $200 to $850. When this index turned up in 2001, the gold price rose from $260 to $1915. Interestingly, this index is once again in the process of turning up. This time it is turning up from the most ‘oversold’ level in history.
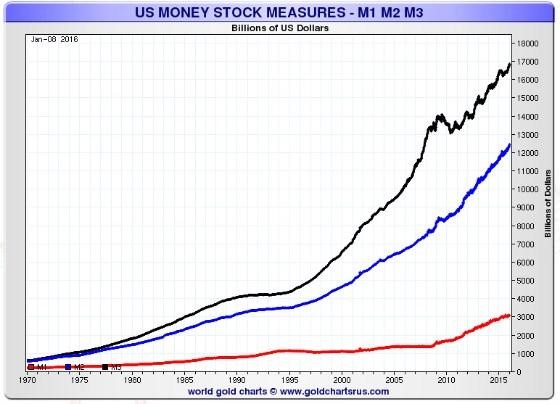
This chart courtesy Nick Laird at Goldchartsrus.com shows money supply in the USA continues to rise exponentially.

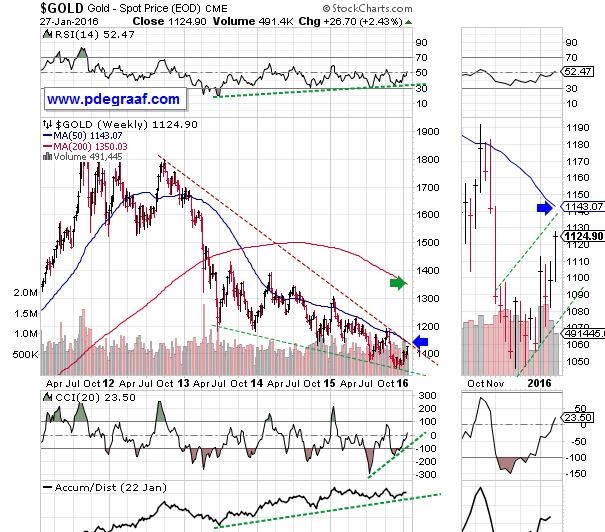
Featured is the weekly gold chart. Price is carving out a large bullish falling wedge. The supporting indicators are positive, including the important A/D line. An upside breakout at the blue arrow is just 20.00 away. When this breakout occurs it sets up a target at the green arrow. The rising green channel in the ‘zoom chart’ at right shows the upward progress made since December.
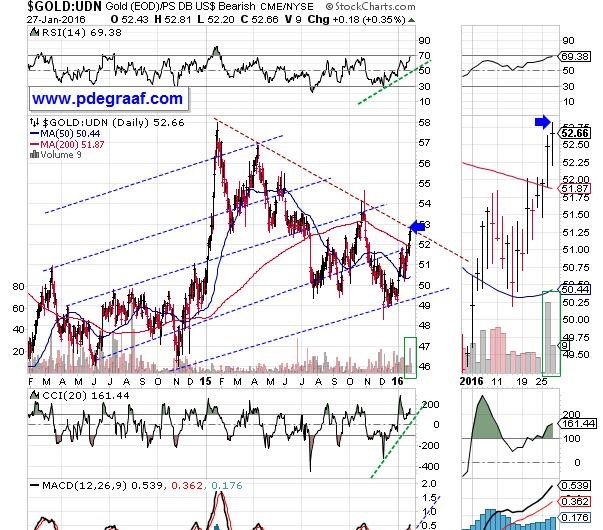
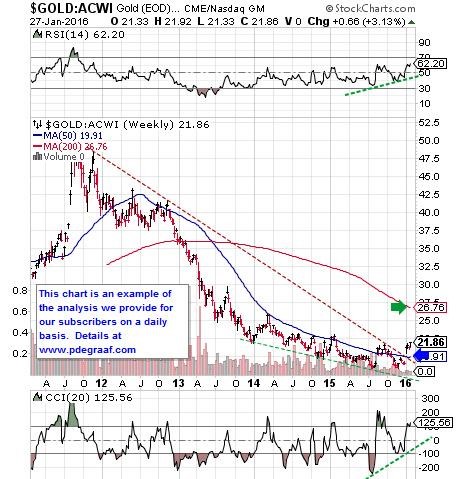
Featured is the gold chart in foreign currencies. Price has been rising since late 2014. The recent breakout above the 200DMA is confirmed by the positive supporting indicators (green lines). This trend is setting the example of what is due to take place in gold as expressed in US dollars. Price is preparing for an upside breakout at the blue arrow. Volume is building (green box), and Tuesday’s volume was the heaviest in 15 months. A breakout at the blue arrow will turn the trend bullish for the first time since late 2014, and likely mark the start of a strong rally.
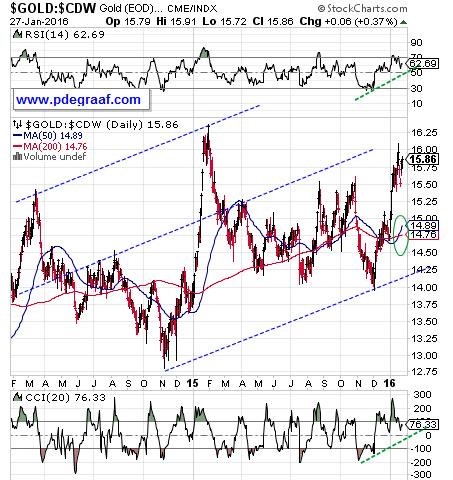
Featured is an example of gold in Canadian dollars.Price shows a steady rise since December 2014. The moving averages are in positive alignment and rising, (green oval).
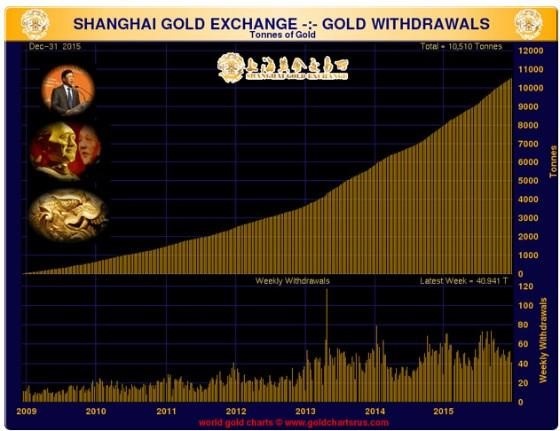
This chart courtesy Nick Laird at Goldchartsrus.com shows withdrawals of physical gold at the SGE continue to mount. This provides bullish fundamental support.
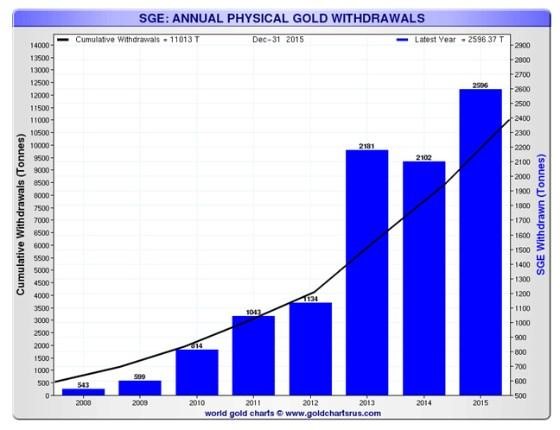
This chart is also courtesy Goldchartsrus.com and shows the number of tonnes of gold withdrawn by jewelers and investors during 2015 at the SGE, which was the highest ever - almost 2600 tonnes.
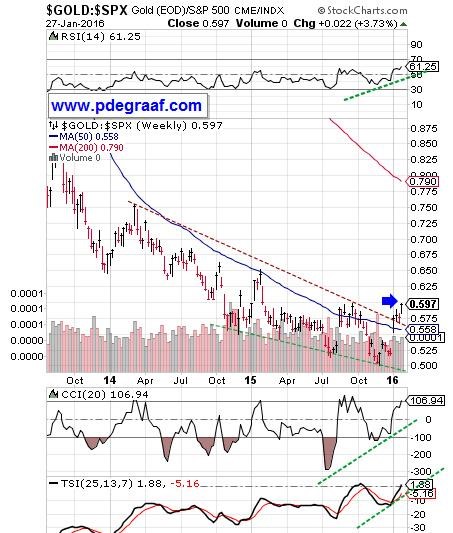
This weekly chart compares gold to the S&P 500 index. Price is breaking out in favor of gold, from a bullish falling wedge. A Friday closing price above the blue arrow will confirm the breakout. This is bullish for gold as it shows investors bailing out of the stock market (the current ‘dead cat bounce notwithstanding), and seeking safety in gold. The supporting indicators are positive (green lines rising upward).
Featured is a weekly chart that compares gold to a basket of foreign stocks. Price has already broken out at the blue arrow. The first target is at the green arrow.
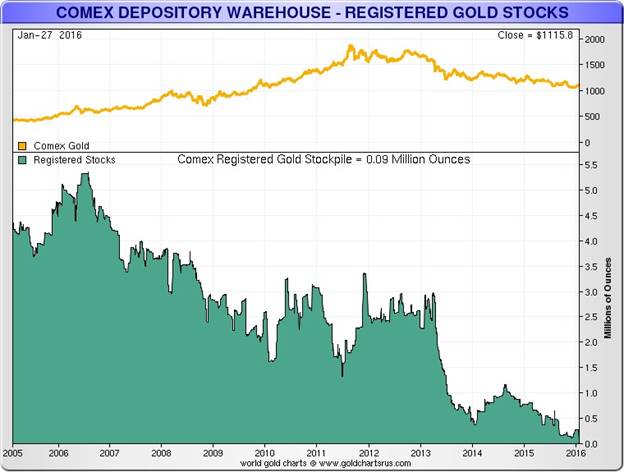
This chart courtesy of Goldchartsrus.com shows the amount of physical gold that is registered (available for delivery against futures contracts) is at a very low level. There are now over 500 claims per ounce. When the remaining gold is claimed, there will be a lot of people who will have to settle for ‘paper gold’.
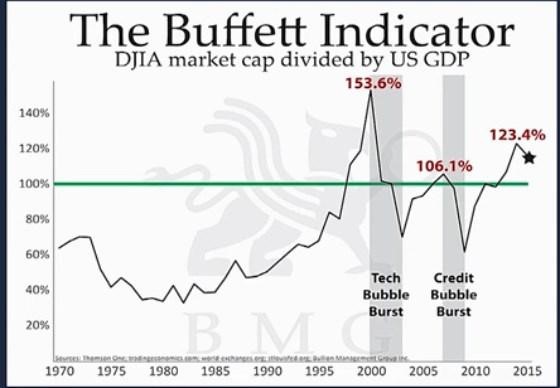
This chart courtesy of BMGbullion.com shows an indicator that has turned down twice since year 2000. Each time it turned down it marked the beginning of a recession.
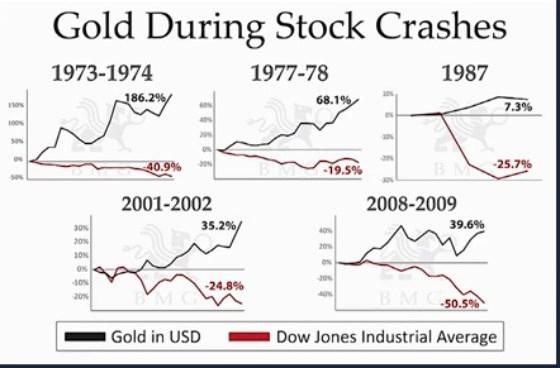
This chart courtesy of BMGbullion.com shows the performance of gold during stock market crashes.
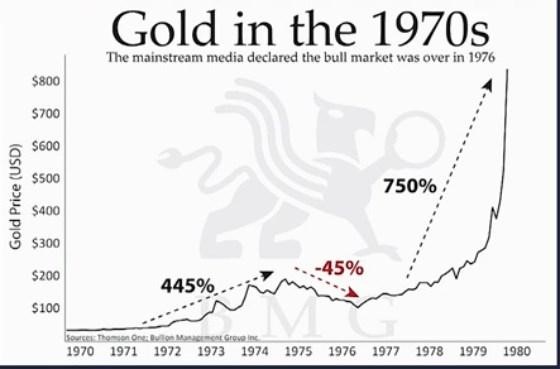
This chart is also courtesy of BMGbullion.com and it shows the percentage rise in the price of gold after a major correction. In the event that history repeats, then a 445% increase from $1,120 sets up a target at $6,000; a 750% increase from $1,120 sets up a target at $9,500. The average rise would take gold to $7,700. The three charts featured above are borrowed from Nick Barisheff at BMGbullion.com. At his website one can access a 12 minute video featuring these charts and a few more.
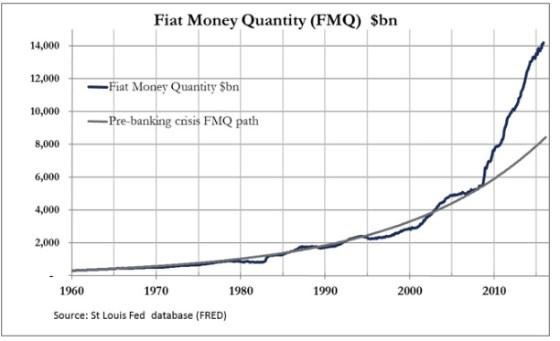
This chart courtesy of US FED and Zerohedge.com shows fiat (unbacked) money is being added to the system at an exponential rate. This sows the seeds for an exponential rise in the price of gold and silver.
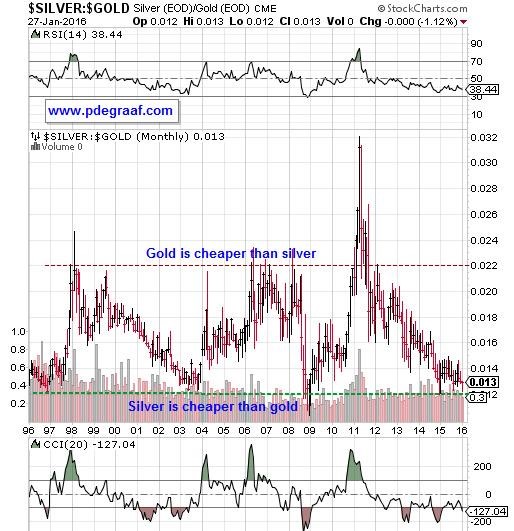
This report has featured the upside potential of gold.We now turn to silver. Everything that is bullish for gold is at the moment even more bullish for silver, as this chart suggests. The expectation is for gold and silver to rise, with silver soon outperforming gold.
Charts in this essay are courtesy Stockcharts.com unless indicated.
Disclaimer: Please do your own due diligence. Peter Degraaf is NOT responsible for your investment decisions. Investing involves risk.


