
The Counter-Argument For A Bullish Bounce
With the Dow down over three thousand points from its bull market peak, there is naturally a lot of chatter about how far the market is going to fall. You already know how wildly bearish I am, but let me temporarily leap to the other side and share some charts which argue for a bounce at these levels.
First up is the SPY, the biggest ETF in the world, which is coming right upon the same trendline that offered support on February 9th before a gigantic reversal. Take note also how this trendline was the support trendline when the market was trapped in a channel for months.

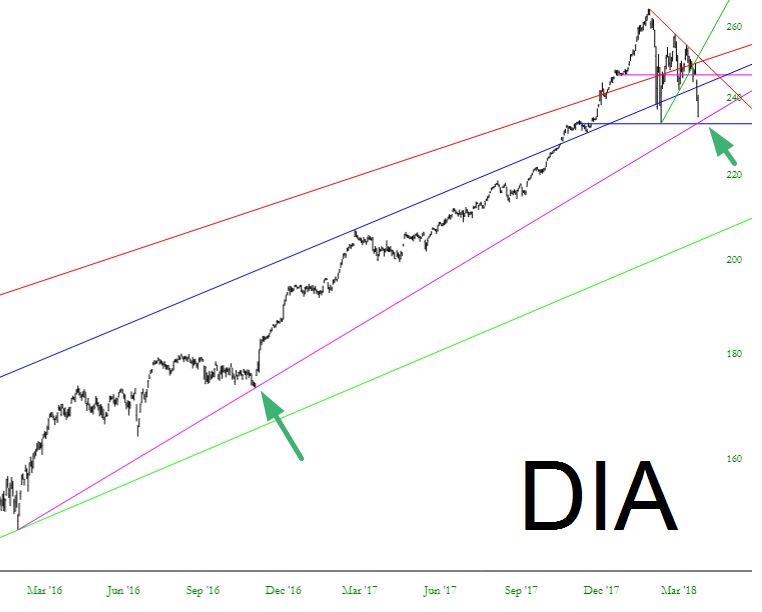
The Dow Industrials trendline, by way of the DIA, goes back even farther. This is the first time in years we’ve approached this major supporting line.
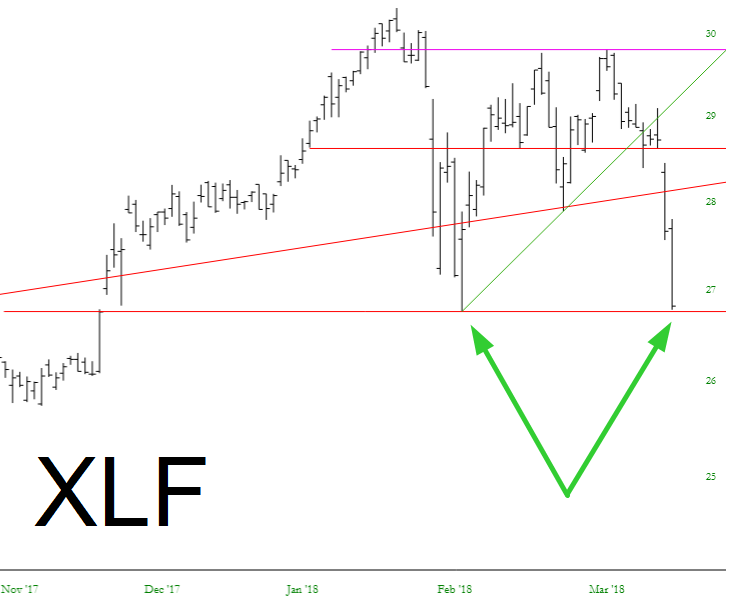
Financials, having taken a beating recently, are approaching their own “February 9th” level, which could constitute a double bottom.
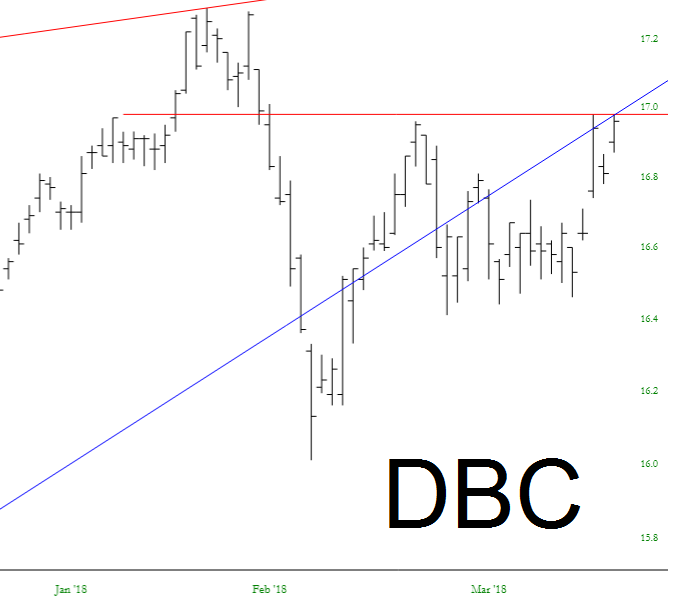
And, obliquely related, the commodities look to be completing a cup with handle formation, preceding a bullish breakout.
At this point, it’s really all about those February 9th lows. Take those out, and all holy hell is going to break loose. As always, I am managing my positions on a case-by-case basis, letting their own individual stops handle themselves and make decisions in my behalf.
Disclaimer: This is not meant to be a recommendation to buy or to sell securities nor an offer to buy or sell securities. Before selling or buying any stock or other investment you should consult ...
more

