
Squirrels
I had suggested last week that a retest of support at 2800 would be a possibility as the market had gotten very overbought as it approached the January highs.
“With moving averages rising, this shifts Pathway #2a and #2b further out into the August and September time frames. The potential for a correction back to support before a second attempt at all-time highs would align with normal seasonal weakness heading into the Fall.
As shown in the updated “pathway chart” above, the market did indeed attempt to test all-time highs in the market. But, as I noted, the overbought condition provided the fuel for a correction given the right catalyst.
That catalyst appeared on Friday as the Lira plunged and Turkey edged closer to an economic crisis.”

The market continued to stumble early last week and quickly fell to retest the 2800 level as concerns over Turkey rattled markets globally. However, with the algo’s eyeing that 2800 support level, when news was floated on Thursday and Friday that China is discussing “coming to the table” to resolve the trade dispute, that was the news needed to spark a robot-driven “buying” spree.
It reminded of the movie “Up,” and how easily distracted markets have become.
The “bulls” are hard pressed to NOT give up on this market. Over the last several years, investors have been trained repeatedly to “buy dips” regardless of the“squirrels” that may scamper by. Such works…until it doesn’t.
Don’t get me wrong…we are right in there as well buying opportunity when we see it.
However, we are also well aware of the risk and manage it accordingly. Currently, there is a serious rotation occurring in the market currently which should not be dismissed. As David Rosenberg noted on Friday (courtesy of ZeroHedge):
“Is the stock market flashing an anti-growth signal?”
Simply put, recent market strength is being driven by the S&P 500 Index’s industry groups that are least affected by slower economic growth.
An index tracking four defensive areas – consumer staples, health care, telecom, and utilities – climbed 10.3% in the three months ended Thursday. A similar gauge of economically sensitive groups – consumer discretionary, energy, industrials and raw materials – gained just 0.5%.
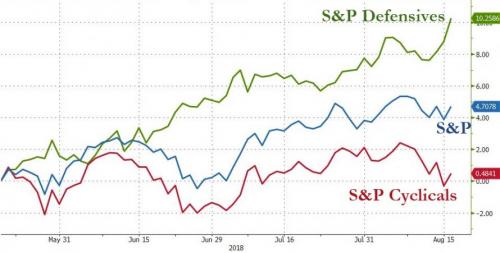
With the incessant flattening of the US Treasury yield curve standing in direct opposition to the rise in US equity indices, Rosenberg concludes, ‘I’m asked what the Treasury market sees that the stock market doesn’t.’
His answer explains it all (now that the chart above has exposed reality):
‘They both see the same thing – a return to stall-speed growth. Look at how the cyclical stocks are faring against the defensives, like Consumer Staples vs Discretionary. Not exactly the prettiest of pictures…'”
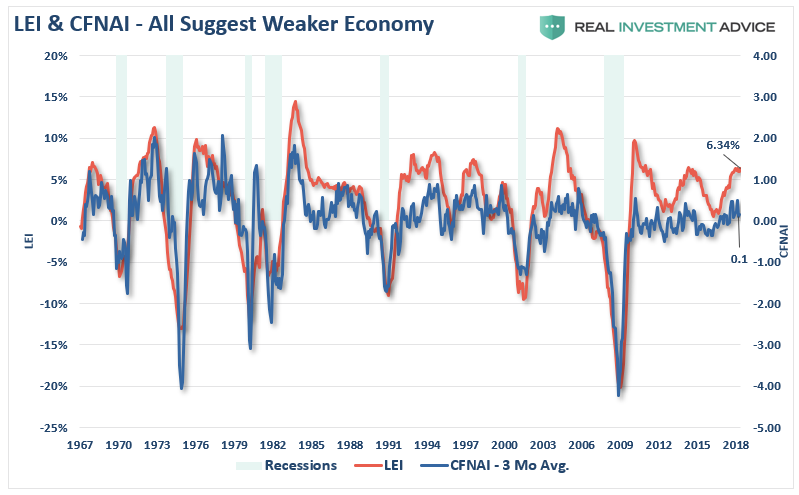
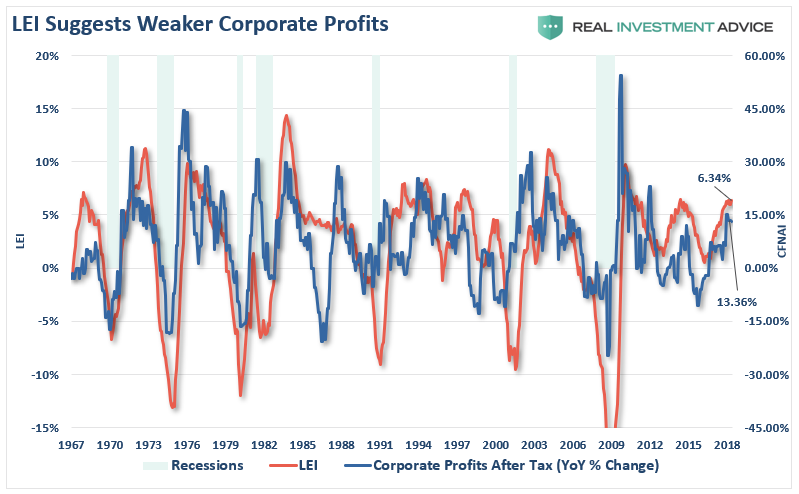
While the bulls have been quick to “price in” geopolitical and economic “squirrels,” the risk currently is a market which remains steeply overvalued, heading into a period of much tougher annual comparisons, and will likely see a contraction in economic growth rates. The data coming through already suggests the latter is likely. More importantly, the year-over-year rate of change in the leading economic index has also peaked suggesting the same.
(The chart below shows a projection at current growth rates out through 2020. Even if the LEI index grows from one month to the next, the rate of growth will slow due to annual comparison issues.)
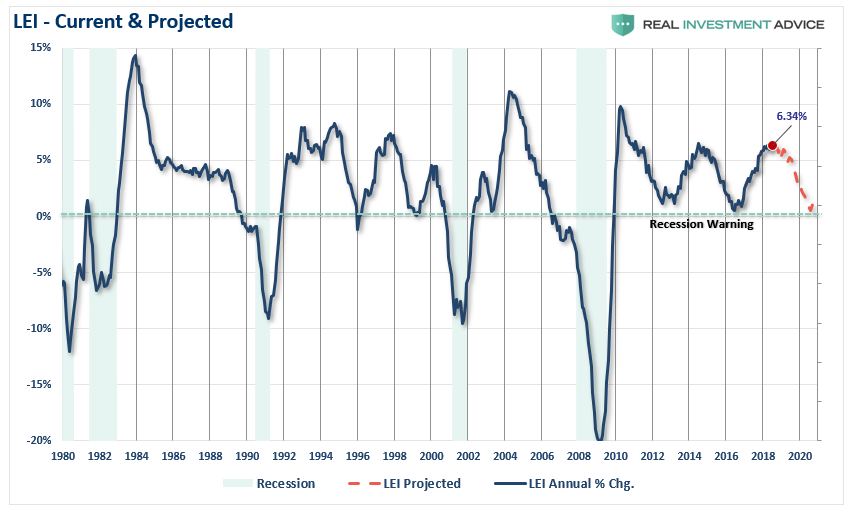
With one of the broadest measures of economic activity already showing some weakness, a downturn in both the LEI and corporate profits should be expected.
All of this suggests that while the bias has been to the upside, there is evidence of a potential topping process at play.
The chart below is the S&P 500 index over the last several weeks. While this is a very short-term view, there is a potential “head and shoulder” formation in process. If completed, a subsequent retest of the 2800 level and a continuation of Pathway #2a, as shown above, is likely. A move higher next week that takes out recent highs would negate this process.
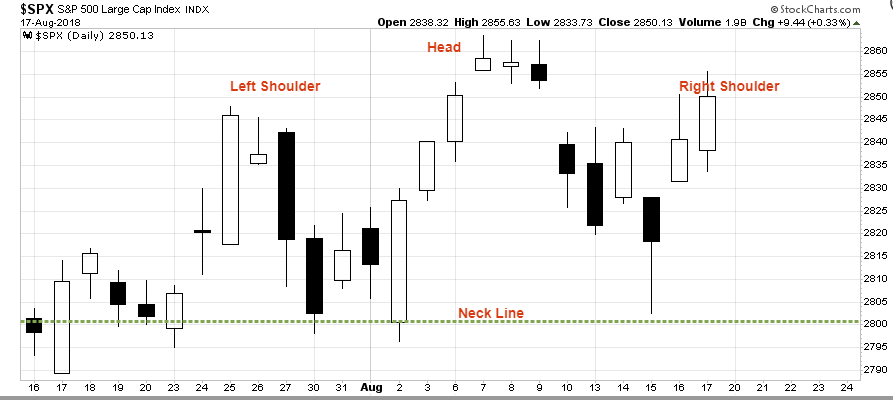
However, a retest could happen next week as the Turkey crisis continues to develop. With the late day downgrade of Turkey on Friday to junk status by all three rating agencies, the risk of a further contagion will continue to develop.
If we step back further there is the potential for a broadening topping process as well. Such would potentially culminate in a retest of previous support around 2700. A break below 2700 and we are going to be discussing reducing equity risk in portfolios.
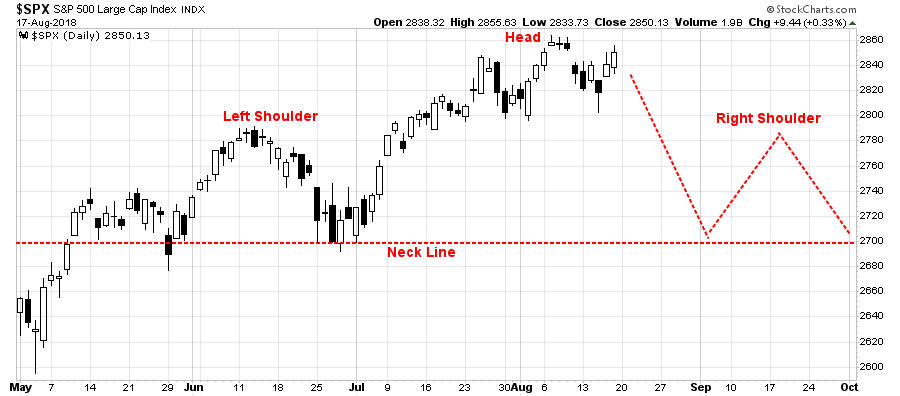
Both of these layouts could resolve themselves in a million different ways, however, given we are moving into a seasonally weak period of the year, following a strong July advance, a correctionary period is a real possibility.
How the market resolves itself in the coming weeks will be paramount to portfolio positioning going into the end of the year. With portfolios still primarily weighted towards equity, and slightly overweight cash, a pullback which holds support levels will provide an opportunity to raise equity exposure for a tradeable rally through the end of the year.
As we head into 2019, the odds of a recessionary drawdown in the markets rises markedly. We remain long bonds in portfolios as a hedge against equity risk and will overweight bonds on any important break of support in the S&P 500.
As shown below, on a QUARTERLY basis, the market is currently at one of the most overbought, extended and deviated levels in history going back 75 years. Every previous period has led to a correction of some magnitude. The only difference between a correction, and a more serious crash, was the level of valuations at the time.

While this certainly doesn’t mean the market will mean revert tomorrow, it does imply that forward returns for current levels will be substantially lower than they have been over the last several years.
Here are the biggest threats to the markets over the next 6-12 months we are watching closely:
- Technical deviations
- Emerging market debt and economic stabilities
- U.S. dollar strength
- Oil prices (below $60)
- Interest rates (Fed)
- Economic strength
- Earnings
- Leverage (Margin)
The issue isn’t any one of them in particular but the linkages between all of them that is important to watch. Here is how a linked scenario could well play out:
- A continued rise in the dollar impacts exporters which reduces profitability and drags on earnings.
- A rising dollar also weighs on oil prices which is highly correlated to the economic growth and inflationary pressures.
- As the Fed continues to hike rates into a slowing economic growth rate, the downward pressure is exacerbated as higher rates reduces CapEx and consumption.
- As the emerging market rout intensifies, debt related issues become much more prevalent and the Fed’s rate hikes eventually trigger a credit-related event.
- The combination of these events weighs on asset prices which trigger an “algorithmic” selloff and sparks a broad-based selloff leading to margin calls.
- As the selloff intensifies, and margin liquidation causes a liquidity issue in the ETF complex, investors eventually “panic sell” the next low.
While that scenario is purely hypothetical, and is only one of the multitude of possibilities which could play out, the point to be made is that it is never just “one thing” that causes a reversion. Rather, it is the “one thing” that triggers the cascade of dominoes to fall.
Unfortunately, we generally never know what the “one thing” is until after the fact. This is why having a plan to manage risk, a discipline to act and the process to follow is critically important to long-term investing success.
Or, you can just keep getting distracted by “Squirrels.”
Market & Sector Analysis
Data Analysis Of The Market & Sectors For Traders
S&P 500 Tear Sheet
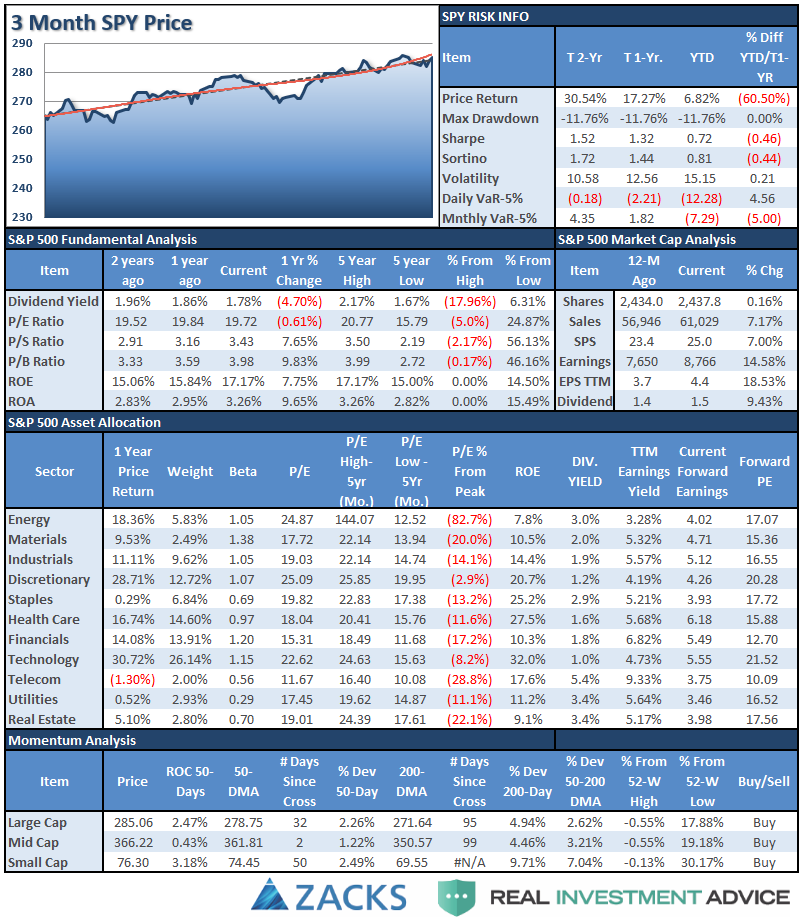
Performance Analysis

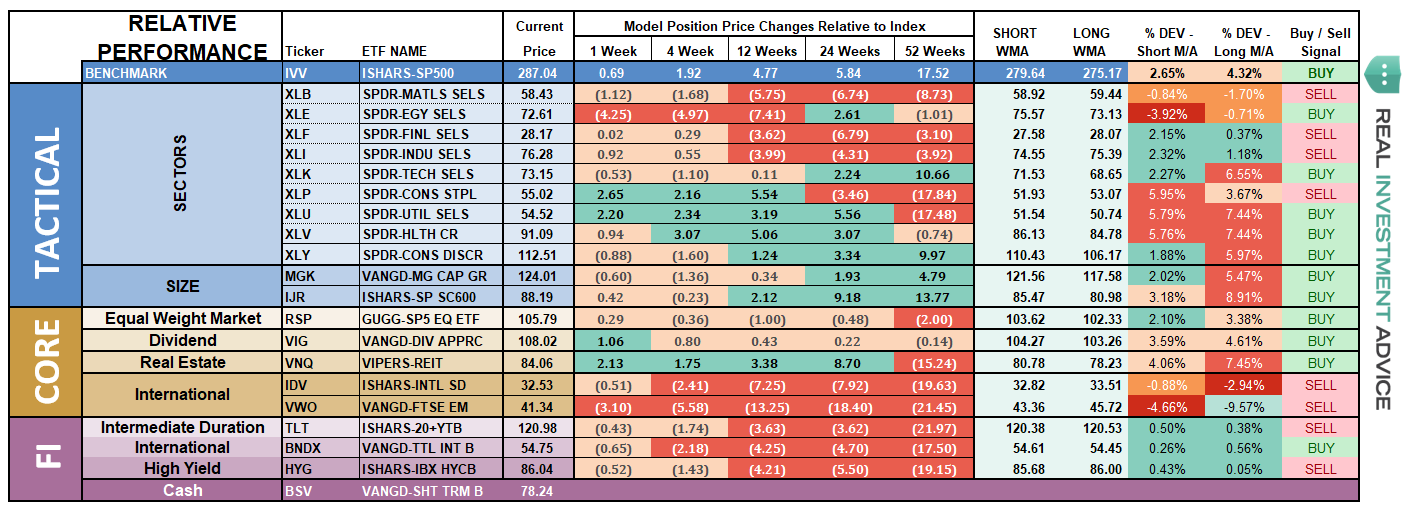
ETF Model Relative Performance Analysis
Sector & Market Analysis:
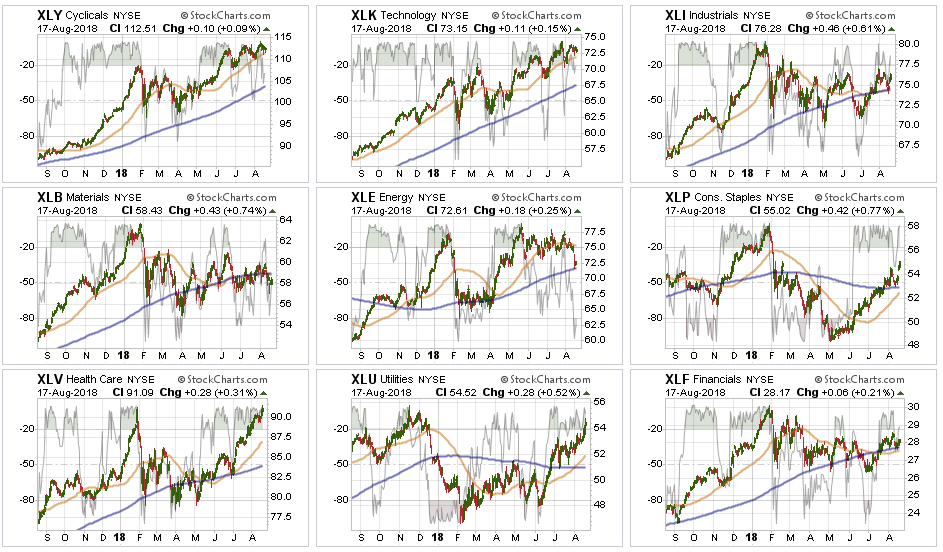
Discretionary and Technology – Last week we said that after taking profits in Technology, look for a correction back to support. The same goes for discretionary holdings as well. Both sectors started that corrective process last week. Look for a continued rotation this week into more “defensive” sectors but if these two leading sectors reach oversold conditions without violating the 50-dma, positions can be added.
Healthcare, Staples, and Utilities – As we stated last week, after the massive run in Healthcare stocks, take some profits and look for a pullback to support to add additional exposure if warranted. Likewise, Staples have been part of the sector rotation flow following a long period of underperformance. A pullback to the 50-dma will provide a decent opportunity to add exposure if needed. Utilities also continue to perform well here as money continues to rotate into previously “hated” sectors. Look for a correction back to the 50-dma as well to add exposure particularly since the 50-dma has crossed back above the 200-dma.
Financial, Energy, Industrial, and Material Industrials and Materials continue to be weighed upon by the ebbs and flows of a trade war. Industrials are performing better than materials currently, but with the 50-dma still below the 200-dma momentum in the sector remains vacant. Energy has slumped along with oil prices, and is currently testing the 200-dma which could be an entry point for positions provided it holds. Energy is currently oversold and a bounce is likely. Financials continue to languish along support but not showing much in the way of strength to support overweighting the sector currently.
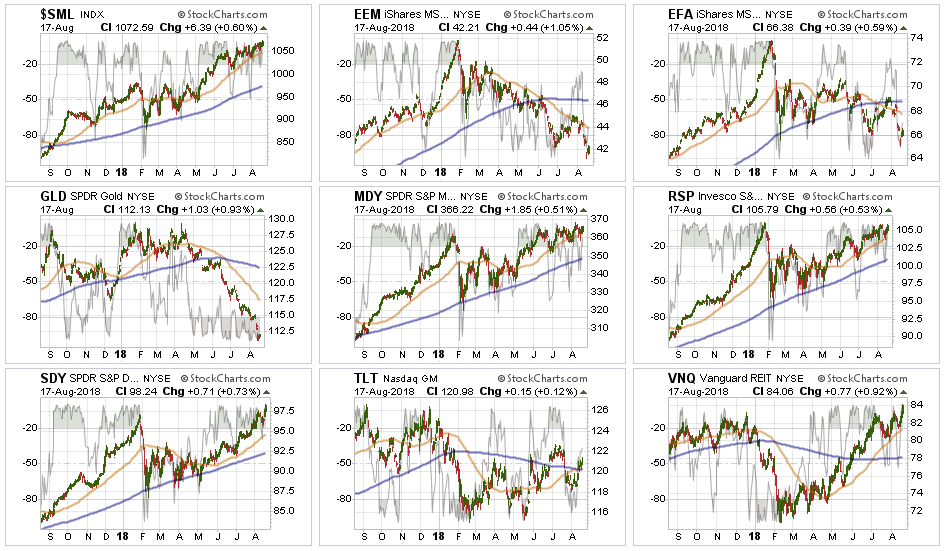
Small-Cap and Mid Cap continue to perform well as of late. We noted two weeks ago, that after small and mid-caps broke out of a multi-top trading range, we needed a pull-back to add further exposure. After having previously added exposure to these markets we continue to allow these markets to perform currently.
Emerging and International Markets were removed in January from portfolios on the basis that “trade wars” and “rising rates” were not good for these groups. With the addition of the “Turkey Crisis,” ongoing tariffs, and trade wars, there is simply no reason to add “drag” to a portfolio currently. These two markets are likely to get much worse before they get better. Put stops on all positions.
Dividends and Equal weight continue to hold their own and we continue to hold our allocations to these “core holdings.” We will overweight these positions on a pullback to support that does not violate that level.
Gold – If you are still hanging onto Gold, we have been consistently providing stop loss levels and sell points since May of this year. These points have continued to decline. With gold very oversold on a short-term basis, if you are still long the metal, your stop has been lowered from $117 four weeks ago, to $111 this week. A rally sale point has also declined from the previous level of $121 to $114.
Bonds – This past week, bonds continued to rally as money looked for “safety” amid the concerns of a collapse in the Turkish Lira. The rally over the past two weeks establishes a series of rising bottoms for bonds AND we have now registered an important “BUY” signal for bonds as the 50-dma crosses back above the 200-dma. As noted previously, we remain out of trading positions currently but remain long “core” bond holdings mostly in floating rate and shorter duration exposure. However, with a “buy” signal in place we will look to add trading positions back into portfolios as necessary.
REIT’s keep bouncing off the 50-dma like clockwork. Despite rising rates, the sector has continued to catch a share of money flows and the entire backdrop is bullish for REIT’s. However, with the sector very overbought, take profits and rebalance back to weight and look for pullbacks to support to add exposure.
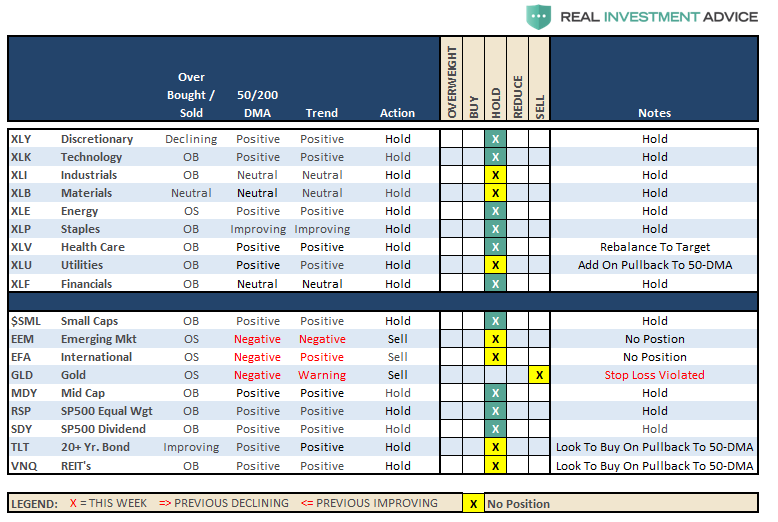
The table below shows thoughts on specific actions related to the current market environment.
(These are not recommendations or solicitations to take any action. This is for informational purposes only related to market extremes and contrarian positioning within portfolios. Use at your own risk and peril.)
Portfolio/Client Update:
Three weeks ago, the market’s improvement allowed us the ability to increase equity exposure in portfolios in anticipation of registering a confirmed buy signal. However, given that August and September are historically weak months for the market, we still remain a bit more cautious regarding how and when we increase holdings in our models.
The recent corrective action was not sustained long enough to provide an opportunity to add to existing positions. However, we suspect over the next month or so that opportunity will present itself given what is happening globally. As long as the cluster of support at the 50- and 100-dma remains in place, which limits much of the downside risk currently, and pullback to support at 2800 will provide an opportunity to add further exposure and bring portfolios closer to target model weights.
Therefore, we continue to look for an opportunity to take the following actions.
- New clients: Add 50% of target equity allocations.
- Equity Model: Increase equity holdings to full weights.
- Equity/ETF blended – increase equity holdings to full weight and overweight domestic ETF “core holdings” to offset lack of international exposure.
- ETF Model: Overweight core “domestic” indices to offset lack of international exposure. Overweight outperforming sectors to offset underweights in under performing sectors.
- Option-Wrapped Equity Model bring all position to target weights and add “collars” opportunistically.
Again, we are moving cautiously. There is mounting evidence of short to intermediate-term risk of which we are very aware. However, the trend of the market remains positive, and we realize that short-term performance is just as important as long-term. It is always a challenge to marry both.
It is important to understand that when we add to our equity allocations, ALL purchases are initially “trades” that can, and will, be closed out quickly if they fail to work as anticipated. This is why we “step” into positions initially. Once a “trade” begins to work as anticipated, it is then brought to the appropriate portfolio weight and becomes a long-term investment. We will unwind these actions either by reducing, selling, or hedging, if the market environment changes for the worse.
THE REAL 401k PLAN MANAGER
The Real 401k Plan Manager – A Conservative Strategy For Long-Term Investors
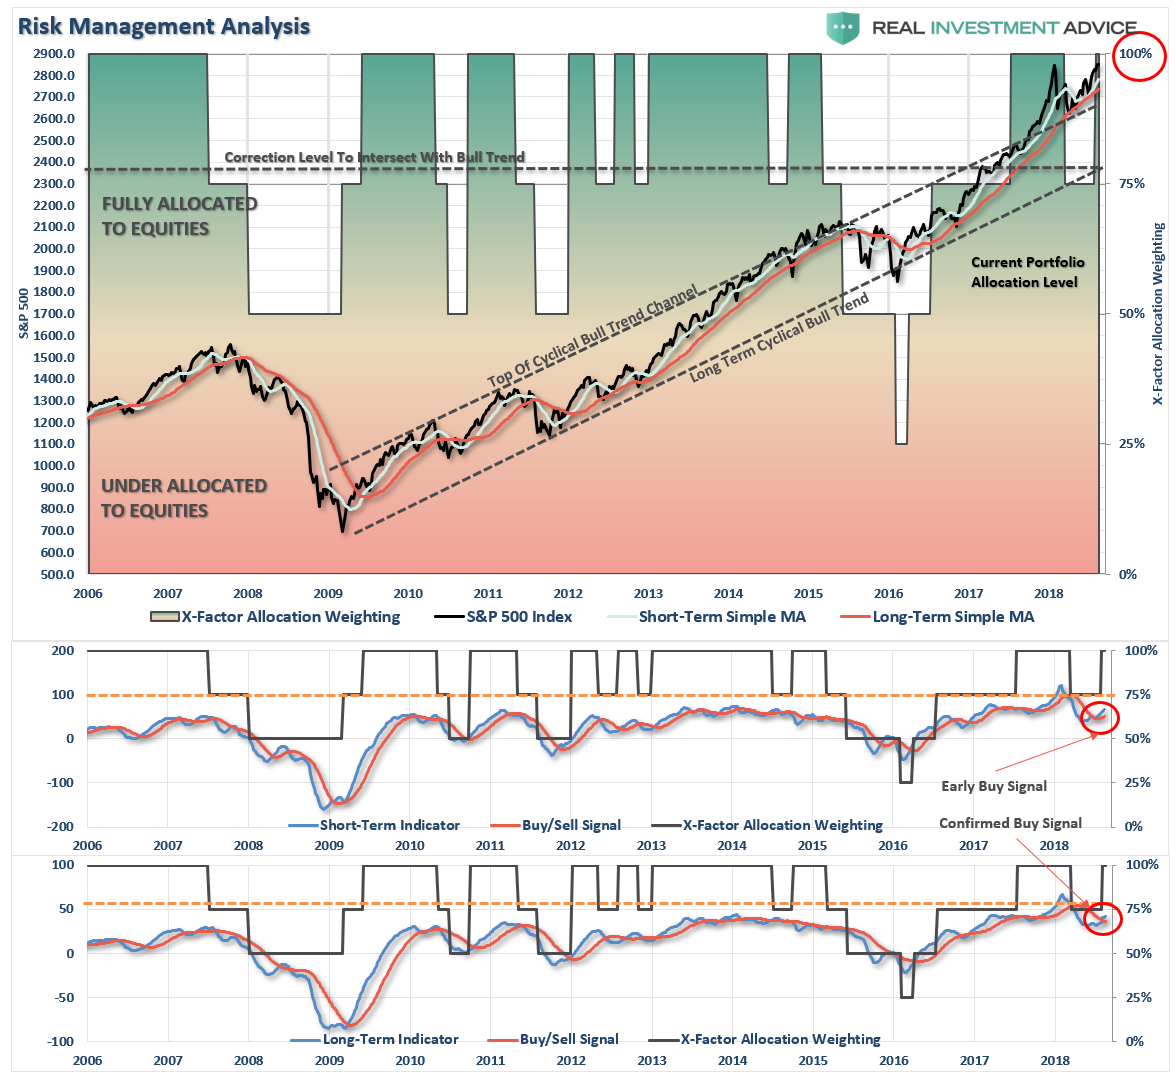
There are 4-steps to allocation changes based on 25% reduction increments. As noted in the chart above a 100% allocation level is equal to 60% stocks. I never advocate being 100% out of the market as it is far too difficult to reverse course when the market changes from a negative to a positive trend. Emotions keep us from taking the correct action.

Looking For An Entry
With the on a weekly confirmed “buy” signal, we are still looking for a reasonable entry point to bring allocations to full target weights. The selloff this past week did not provide a good entry point as of yet, but it is likely the market will see more volatility next week.
Look for a pullback to support at 2800 to add to existing positions and bring plans closer to target weights. However, do so slowly.
While there is “no requirement” to make immediate adjustments to your 401k plan, you should balance your portfolio to your personal level of risk tolerance, and you can use a pullback to support to continue taking the following actions we discussed previously.
- If you are overweight equities – reduce international and emerging market exposure and add to domestic exposure if needed to bring portfolios in line to target weights.
- If you are underweight equities – begin increasing exposure towards domestic equity in small steps. (1/3 of what is required to reach target allocations.)
- If you are at target equity allocations currently just rebalance weights to focus on domestic holdings.
While we officially upgraded our allocation model back to 100% exposure, there is no rush to immediately add additional equity risk. Do so opportunistically.
Current 401-k Allocation Model
The 401k plan allocation plan below follows the K.I.S.S. principle. By keeping the allocation extremely simplified it allows for better control of the allocation and a closer tracking to the benchmark objective over time.(If you want to make it more complicated you can, however, statistics show that simply adding more funds does not increase performance to any great degree.)
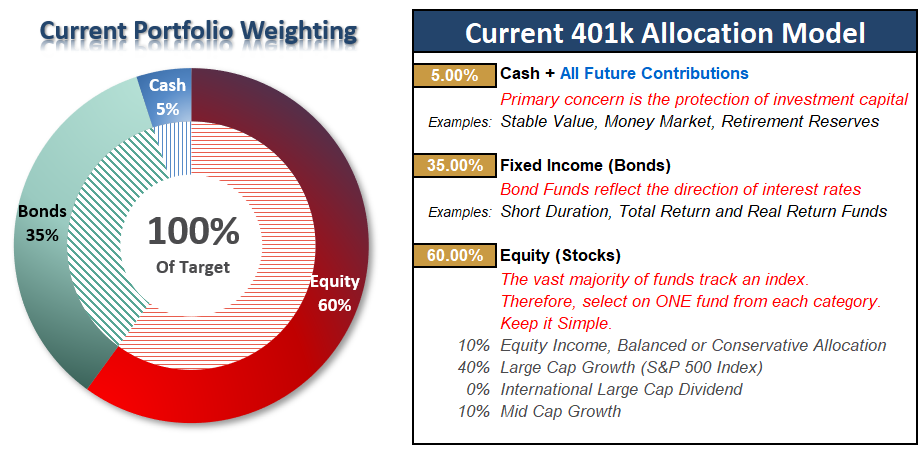
401k Choice Matching List
The list below shows sample 401k plan funds for each major category. In reality, the majority of funds all track their indices fairly closely. Therefore, if you don’t see your exact fund listed, look for a fund that is similar in nature.

Disclosure: The information contained in this article should not be construed as financial or investment advice on any subject matter. Real Investment Advice is expressly disclaims all liability in ...
more

