
Platinum Analysis
Latest Price – $873.30 (as of June 22)
Daily Chart
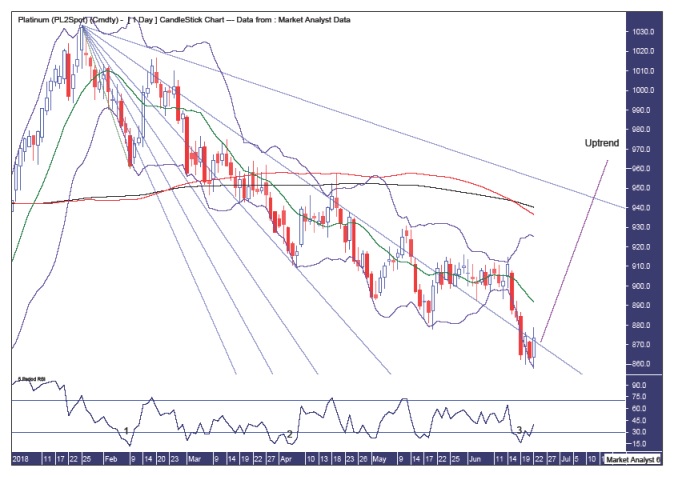
Pattern – a downtrend has clearly been in force…one that I believe ended today with a low at $857.60. And a bullish outside reversal candle to go with it. This will obviously need follow through to the upside while there may be some consolidation of this candle in the very immediate term.
Bollinger Bands – price looks like it may be about to leave the lower band but it hasn’t yet. A clear break higher will likely confirm the low.
Fibonacci – price has been trending down generally between the 61.8% and 76.4% angles. Each consecutive low has been inching closer the 76.4% angle as the downtrend has played out. If I am correct in thinking today was the low then price should finally overcome this 76.4% angle and move up to the 88.6% angle where some resistance may come in before racking above there too.
Moving averages – a bearish crossover has just occurred but this is also the exact moment where price rallies, if only a bear rally which I think this will be.
RSI – a triple bullish divergence has formed at this price low which is often see before a solid rise.
Monthly Chart
.jpg)
Pattern – we can see the 2016 low was a test of the previous low which occurred during the 2008 commodities bust. While I believe price will eventually trade below that 2008 low I believe that time is not yet. Instead, I favour am ABC correction is in process with today the wave B low with price about to embark on a rally that ends in a wave C high. I favour this wave C high to only marginally clip the wave A high of $1199.
Fibonacci – the wave A high was around resistance from the 38.2% angle while this expected wave B low is at support from that same angle. If I am correct in a rally commencing now then my target for the wave C high is the 61.8% angle. This angle coincides with the 38.2% retracement level of $1234 towards the end of 2018. This is some timing and price.
RSI – price is threatening to move into oversold territory but I doubt that will happen and it won’t if price rallies now. The 2016 low saw a new low on this indicator and I would like to see a bullish divergence form before the overall downtrend is over. All in good time.
Summing up – I expect a solid rally now which has the potential to put on around 40% over a relatively short period of time.
Disclaimer: The above is a matter of opinion provided for general information purposes only and is not intended as investment advice. Information and analysis above are derived from sources and ...
more

