
Oil Sends A “Crude Warning”
As with many Americans, I am on the road with the family making the traditional holiday rounds. Of course, my family is more “The Griswolds” than “The Waltons". but even with all of the antics, comedy, and occasional drama, it is always an enjoyable time of the year.
However, I did wake up from my tryptophan-induced coma long enough to pen a few thoughts on the crash in crude oil and the message it is sending.
On Monday, I am publishing an article on the fallacy that “falling energy prices are an economic boost.” It isn’t, and we dig into all the reasons why in that article.
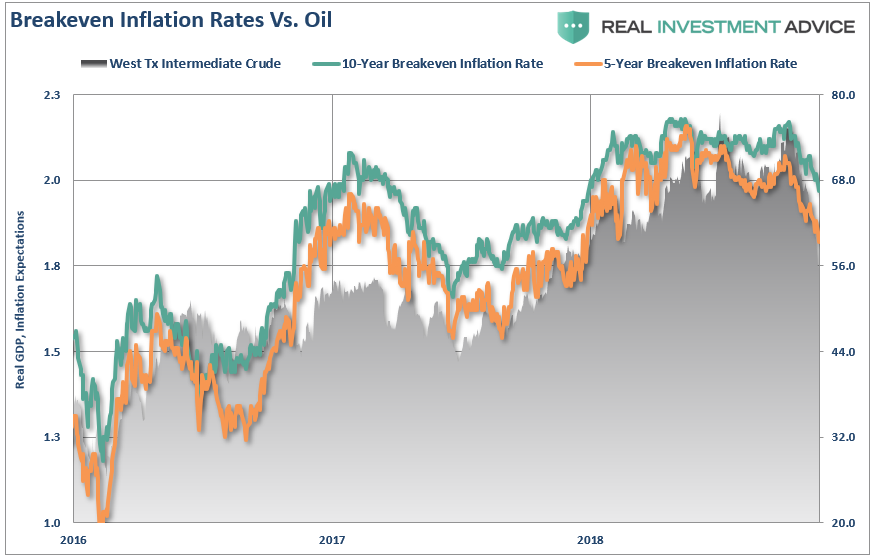
However, the short version is that oil prices are a reflection of supply and demand. Global demand has already been falling for the last several months and oil prices are now waking up that reality. More importantly, falling oil prices are going to put the Fed in a very tough position in the next couple of months as the expected surge in inflationary pressures, in order to justify higher rates, once again fails to appear. The chart below shows breakeven 5-year and 10-year inflation rates versus oil prices.
Oil prices also tend to lead the broad economic cycle as well. The chart below is one of the broadest measures of economic activity and is comprised of leading economic indicators, Fed regional manufacturing surveys, NFIB small business survey, ISM, CFNAI, and Chicago PMI.
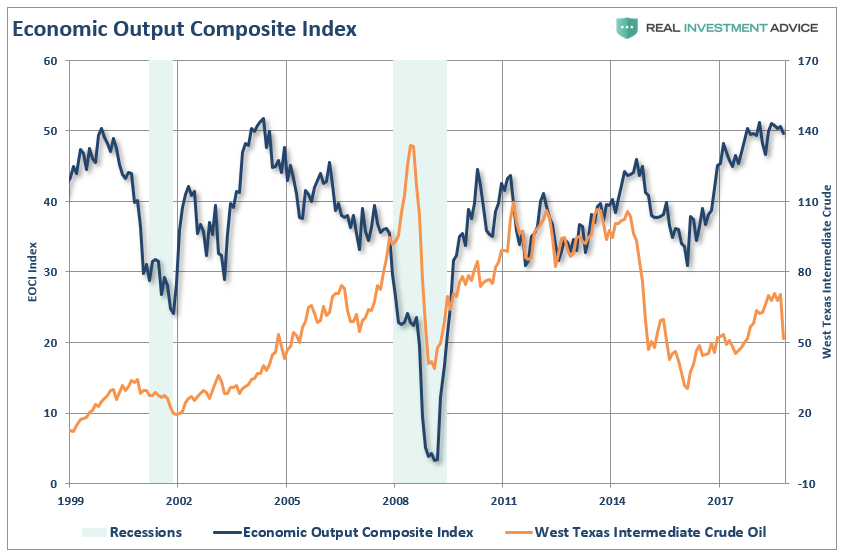
Since most of the economic data we look at is trailing, and subject to heavy negative revisions, the collapse in oil prices suggests that coming economic reports will likely be materially weaker than currently expected.
Can I Have A Side Of Debt
But there is another enormous problem currently for the oil and gas sector currently at risk – the debt.
For the last few years, oil companies have been taking of the extraordinarily low interest rate environment to leverage up to chase marginally productive drilling in high-depletion rate shale wells.
Since energy-related bonds make up about 15% of the high-yield index, and with a substantial number of corporate bonds on the verge of falling below BBB ratings in the months ahead, the potential impact of falling energy prices (a reduction in revenue) and higher borrowing costs is a potential double-whammy to an important sector of the economy.
Mark J. Grant recently made some interesting points on this issue:
“Moody’s said the amount of U.S. corporate bonds outstanding, rated at its lowest investment-grade level of Baa, rose to a record $2.83 trillion in the third quarter, topping the $2.62 trillion in single A corporate bonds and the $629 billion in outstanding bonds rated Aa or higher. Within the Baa group, the dollar amount of bonds rated Baa3, Moody’s lowest investment grade rating, ballooned by 140% from the fourth quarter of 2007 to a record $705 billion, in 2018’s third quarter.
Here again, the Fed is not helping, as they are driving up borrowing costs for all of these companies, across the board. There is also a danger here to many insurance companies as their credit rating could be downgraded, if more of the bonds that they own are reclassified as ‘Junk.’ Here is another ‘doom-loop’ scenario that is playing itself out as yields rise and now gap out, in many credits, versus Treasuries.
Baa3 grade corporate debt outstanding has now reached an ‘unprecedented’ 56.8% of speculative-grade, or ‘junk,’ high-yield corporate bonds outstanding. By comparison, the ratio of outstanding Baa3 rated bonds to high-yield bonds was 32.5% before the 2008-2009 financial crisis, 36.9% before the 2001 recession and 22.2% before the 1990-1991 downturn. Startling figures, no doubt.
Moody’s stated:
Thus, from the perspective of dollar amounts outstanding, the U.S. investment-grade corporate-bond market is now riskier than it was before each recession since 1981 and possibly all prior downturns through the late 1940s. Greater uncertainty surrounds the sustainability of corporate earnings growth has adversely affected the performance of medium- and lower-grade bonds. Not since September 2016 has the long-term Baa industrial spread remained above 200 basis points on a recurring basis.”
The collapse in oil prices, which is a direct impact to revenue for oil and gas companies, is going to make already nervous lenders even more adverse to lending to the sector. Secondly, demands to shore up credit-lines, increase loan covenants, provide additional collateral, or simply increase borrowing costs could have a materially negative impact on the sector as a whole.
I Warned You
But none of this should really be a surprise – as I wrote back in August:
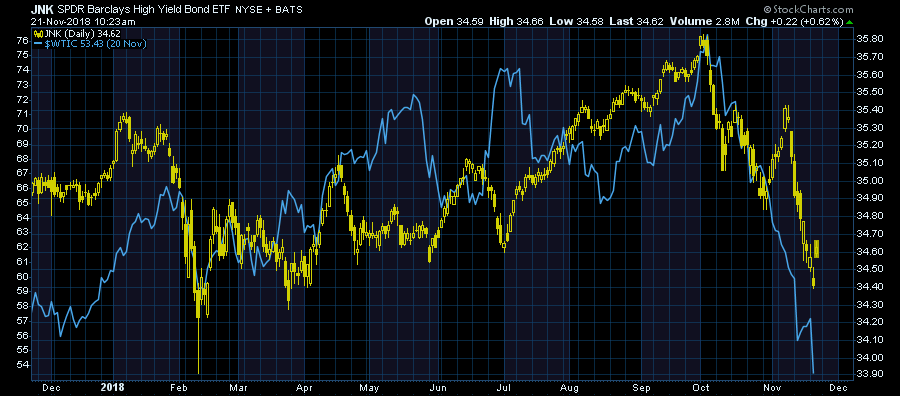
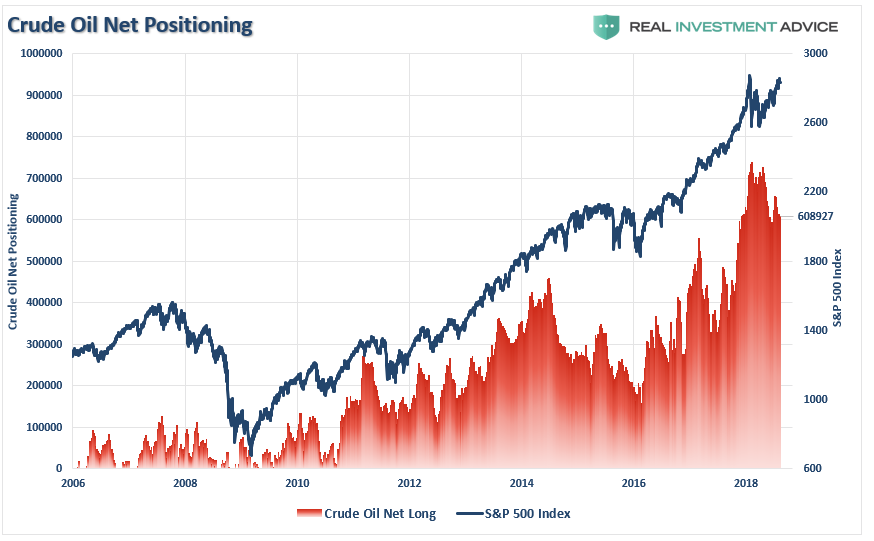
“The rise in crude prices from the lows has also been primarily responsible for the uptick in both economic growth and inflationary readings. However, higher oil prices are also a ‘double-edged sword’ which also acts as an additional tax on consumers as well as corporate profit margins. The push above $70/bbl led to a massive surge in crude oil speculators chasing price but also provides the ‘fuel’ for a sharp reversal as well.
For investors, it is also worth noting that crude oil positioning is also highly correlated to overall movements of the S&P 500 index and earnings growth. With crude traders currently extremely ‘long,’ a reversal will likely coincide with both a reversal in the S&P 500 and oil prices being pushed back towards $55/bbl.”
“While oil prices could certainly fall below $55/bbl for a variety of reasons, there is reasonable support around $50-55/bbl barring an economic recession.”
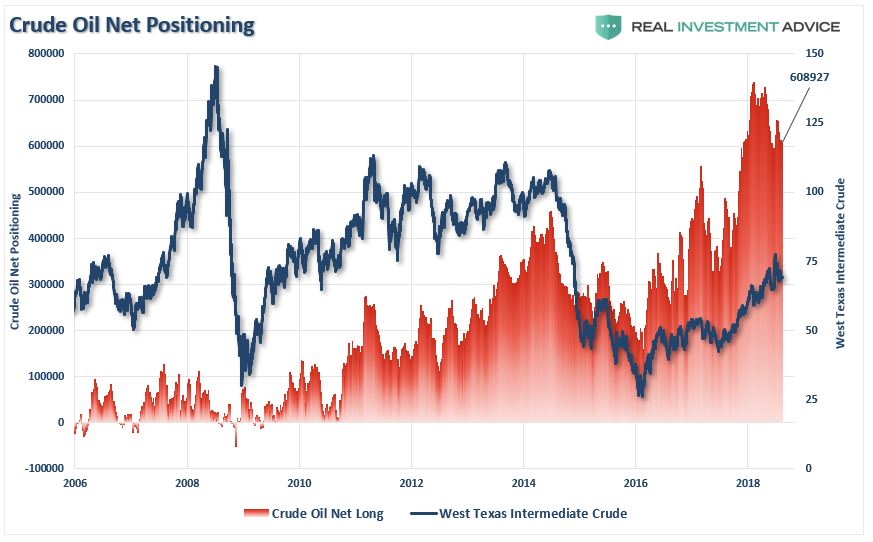
Since then, that prediction has become a disappointing reality. However, it is critically important that oil holds support at $50/bbl, otherwise, you are looking at oil prices near $40/bbl, substantially weaker economic data, and even lower stock market values.
Oil prices are just another confirming factor that we have likely edged into a “bear market” and downside risk continues to outweigh upside reward.
Last week, we further reduced equity risk further bringing exposures down to just 40% of our portfolios. On a rally to the 200-dma which fails, we will reduce risk more and add negative hedges to portfolios.
Daily View
There is little good news to be had this week. The market broke recent lows and will now be looking to retest the lows of earlier this year. With the 50-dma sloping sharply lower and the 200-dma following suit, the backdrop of the market has turned decidedly “bearish.”
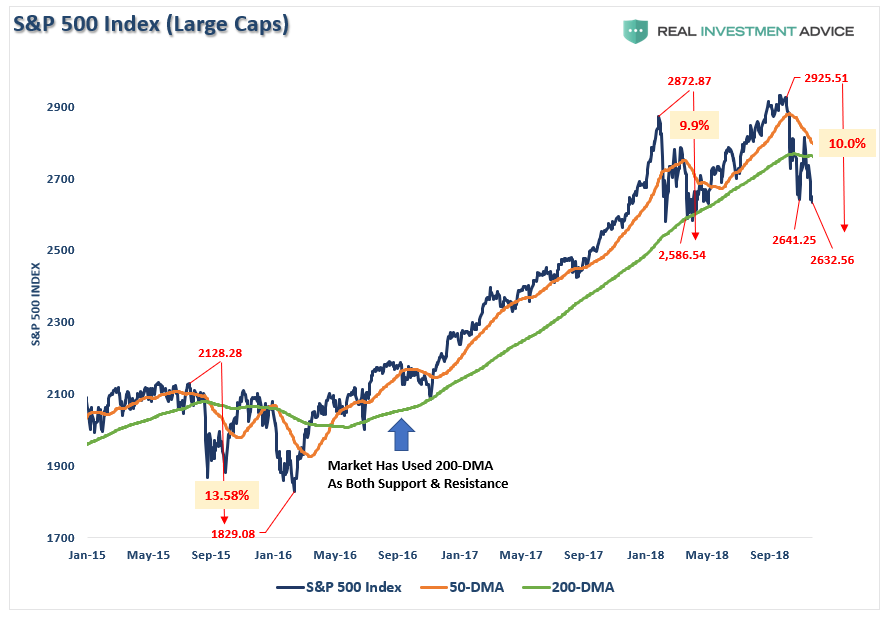
More importantly, and also a negative, is the market is now consistently trading below the 200-dma. This should serve as a warning to investors to reduce equity exposure on rallies and remain hedged until these trends begin to reverse themselves.
Action: After reducing exposure in portfolios previously, we reduced risk further this past week. Sell weak positions into any market strength on Monday.
Weekly View
As stated previously, since we prefer longer-term holding periods for our positions, we prefer to use weekly and monthly data to reduce the number of signals but reveals the more important overall trends of the market.
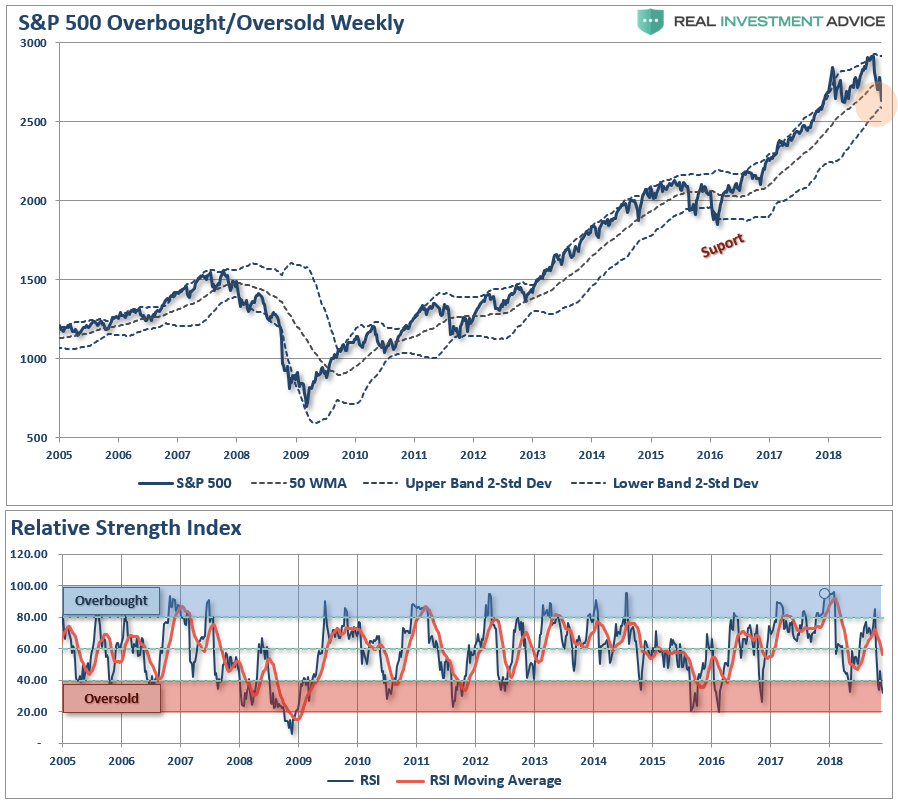
On a weekly basis, the market is now extremely oversold on both a relative-strength basis and prices are pushing 2-standard deviations below the 50-week moving average. As shown below, on a weekly basis, a “sell signal” has been registered for the second time this year suggesting that investors reduce equity risk in portfolios.
However, given the extreme oversold conditions of the market, look for a rally through the end of the year to make adjustments to overall risk exposures.
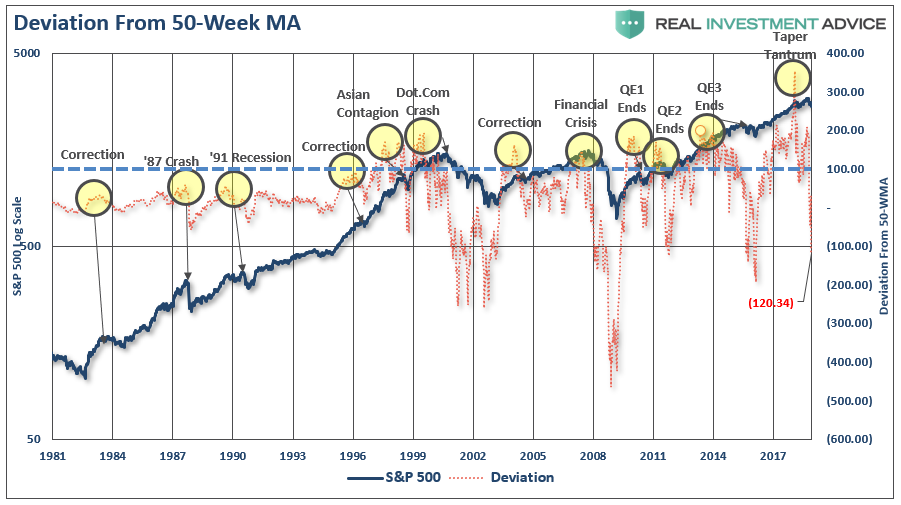
Note that such reversions from prior over-extensions are usually associated with more meaningful market events. However, as I noted on Tuesday at RIA PRO
“Currently, the market is oversold and is set up for a short-term bounce. In the next few days, we will look to add a trading position to portfolios for a potential year-end rally. As we have stated previously, we are moving into the ‘seasonally strong’ period of the year combined with a post-midterm election period which has historically equated to a positive push in the market.
However, nothing is guaranteed so the recent changes to portfolios to raise cash, shore up risk, shorten-durations, and increase credit quality all remain prudent actions.
Most importantly, while the market will indeed garner a rally over the next couple of months, such will not change the fact that we are in the midst of a substantially more important topping process. The chart below lays out the potential range for a bounce before a continuation of the current decline ensues.”
I want to caution you that by the time longer-term sell signals are issued, the market tends to be more extremely oversold and due for a reflexive bounce. It is still highly advised that bounces be used to reduce equity exposure until there is a definitive improvement in the overall technical backdrop of the market.
Action: Sell weak positions into any strength next week.
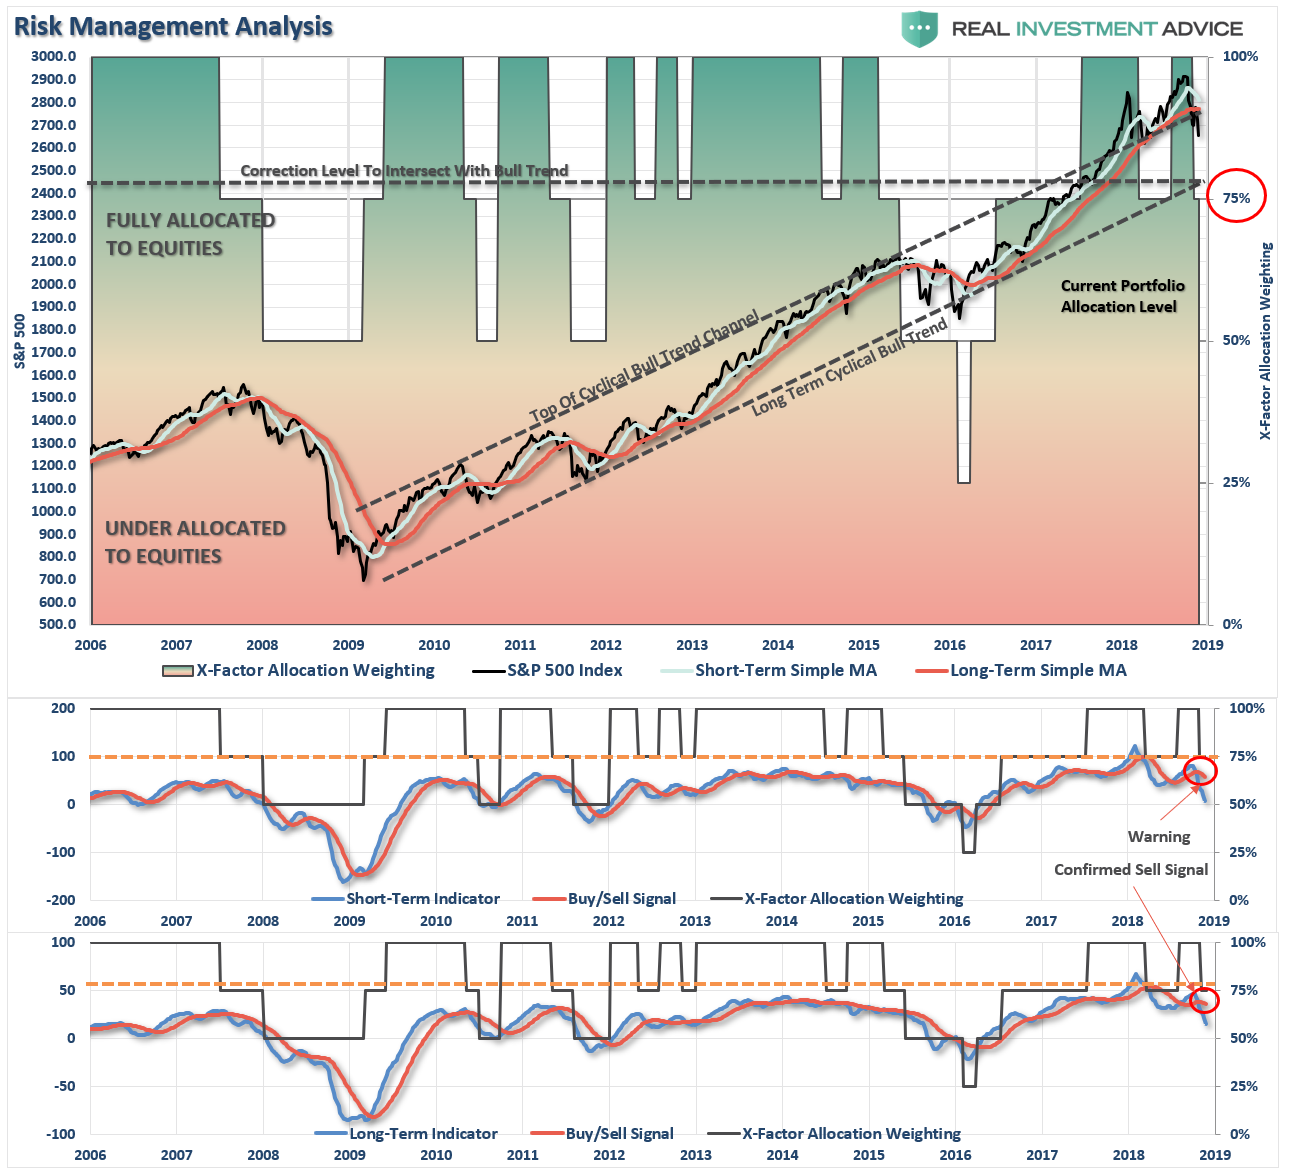
Monthly View
Moving back to a monthly view, signals become much slower and much more important. However, signals are ONLY VALID on the 1st trading day of each month. Therefore, while the markets have registered a monthly signal as of this week, it will ONLY be valid if the markets fail to rally enough to reverse it by the end of the month.
Nonetheless, the deterioration in the markets is extremely concerning and by slowing the signals down further to crosses of very long-term moving average, the risk to investors becomes much clearer.
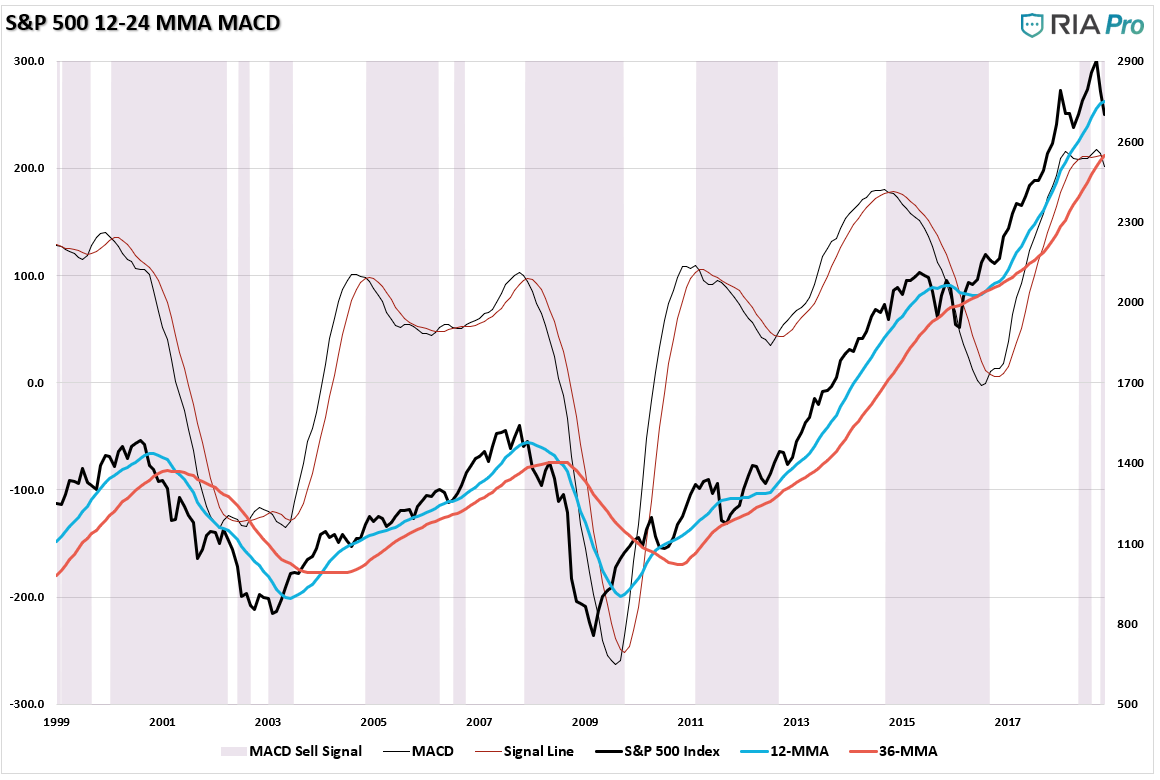
Action: Reduce risk on rallies, as detailed above, and look to add hedges.
As always, the messages being sent by the market are more than just concerning and suggests that actions be taken to reduce portfolio risk on rallies in the weeks ahead.
I warned previously the Fed was likely to hike rates until something broke.
“But one thing is for sure…if something hasn’t already broken, it will break soon if rates keep rising.
That day may be much sooner than most expect.”
It continues to appear that day has come.
As always, we will keep you apprised of what we are thinking.
You can also follow our actual portfolio models and positioning at RIA PRO.
Market & Sector Analysis
Data Analysis Of The Market & Sectors For Traders
S&P 500 Tear Sheet
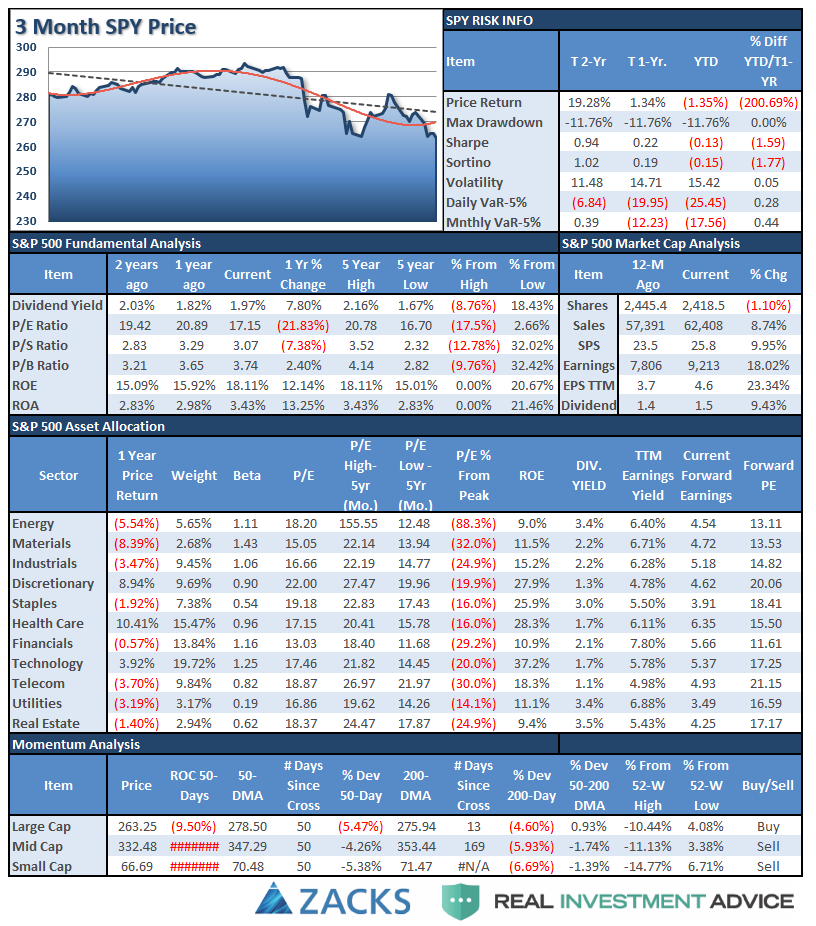
Performance Analysis
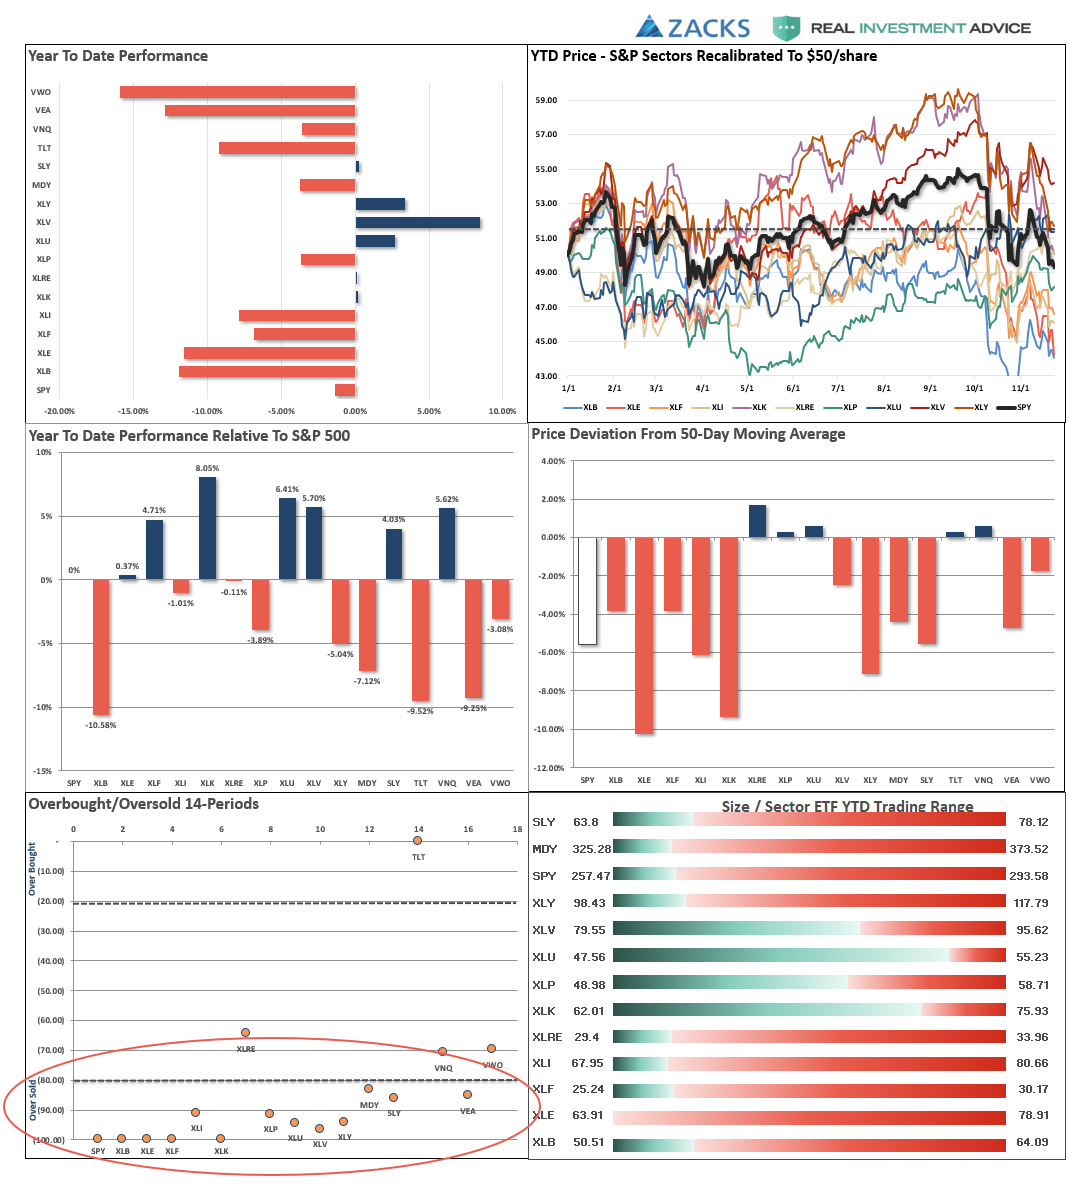
ETF Model Relative Performance Analysis
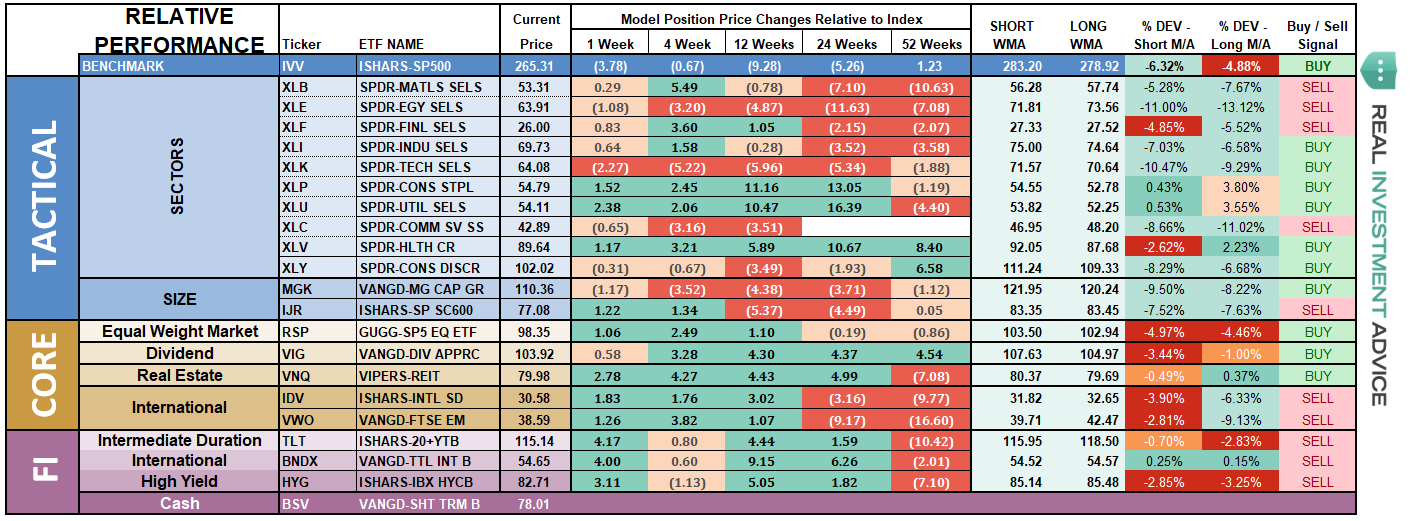
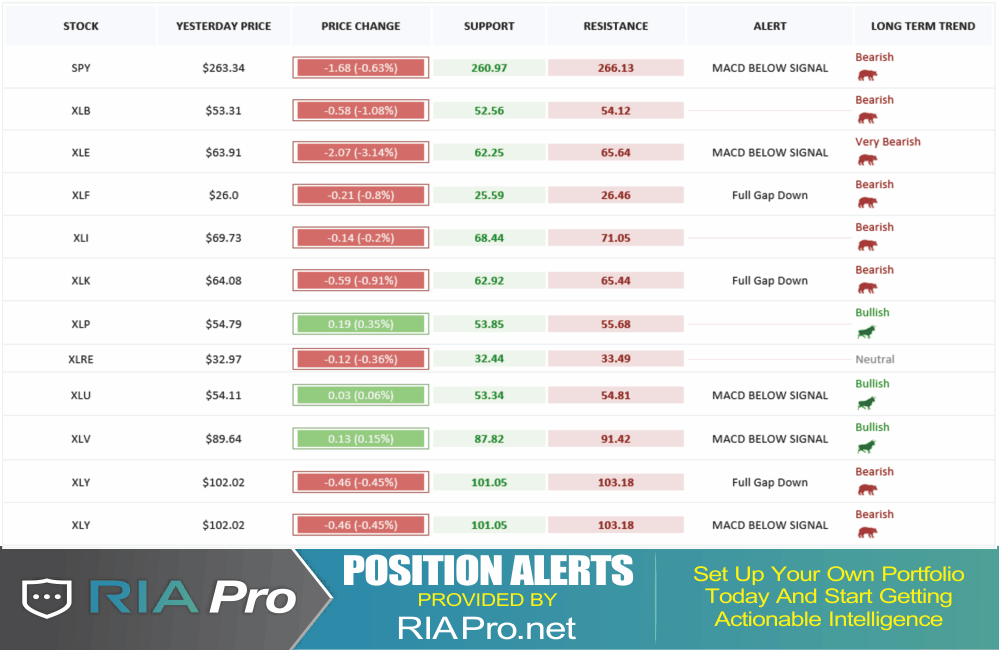
Sector & Market Analysis:
Sector-by-Sector
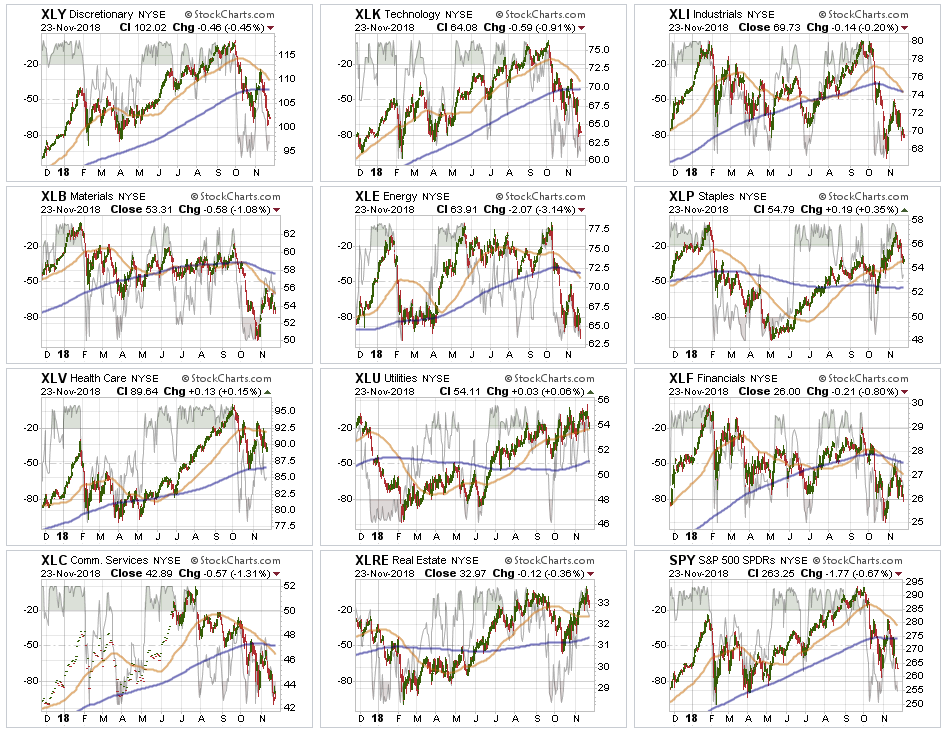
Discretionary & Technology Two weeks ago, we noted that both sectors had rallied and failed at important overhead resistance at the 200-dma. We also suggested “taking profits and look at the 200-dma support as critical.” We are currently out of both sectors for now until performance improves. Both sectors are extremely oversold, so look for rallies back to the 200-dma to reduce exposures for now.
Industrials, Materials, Energy, Financials, Communications – we are currently out of all of these sectors as the technical backdrop remains much more bearish. As noted above, oil prices failed to find support and the entire energy complex remains under pressure. We continue to suggest reducing exposure on any rally next week.
Real Estate, Staples, Healthcare, and Utilities continue to be bright spots but showed a bit of weakness last week. We continue to watch for an opportunity to increase our weightings in these areas for now. However, if we get into a more protracted bear market, these sectors will not be immune to the decline so caution remains high.
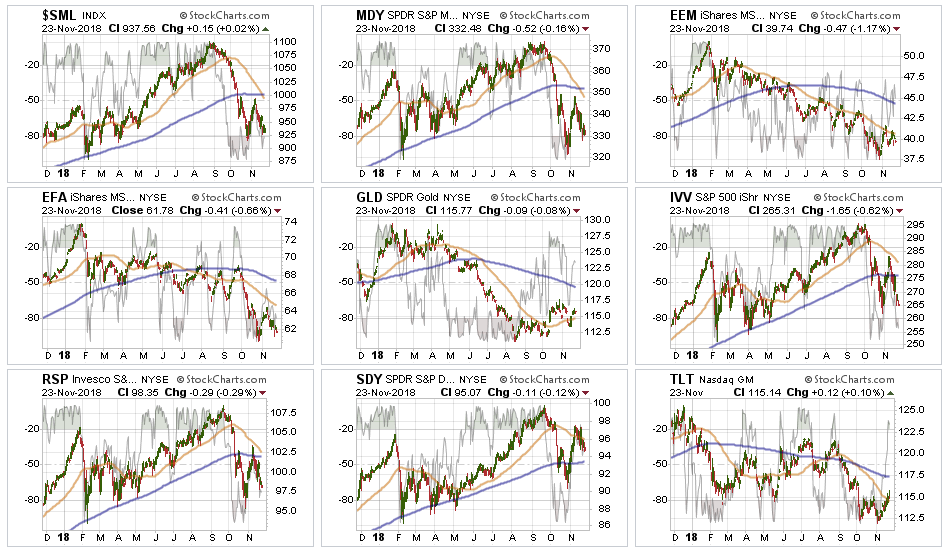
Small-Cap and Mid Cap – Small-cap followed suit with Mid-caps, as expected, last week registering a macro sell signal as the 50-dma crossed below the 200-dma. After having closed out of our positions in these areas we continue to look for opportunities to reduce risk further on rallies.
Emerging and International Markets continue to be dragged lower along the underside of their 50-dma’s. With a major sell signal in place currently, there is still no compelling reason to add these markets to portfolios at this time. The message of global weakness should not be dismissed with respect to the overall market environment.
Dividends, Market, and Equal Weight – The overall market dynamic has changed for the negative in recent weeks. Currently, Dividends are outperforming Equal and Market Weight indices as the chase for yield and safety has weighed on more aggressive sectors of the market. With the markets extremely oversold on a short-term basis look for rallies to reduce risk further.
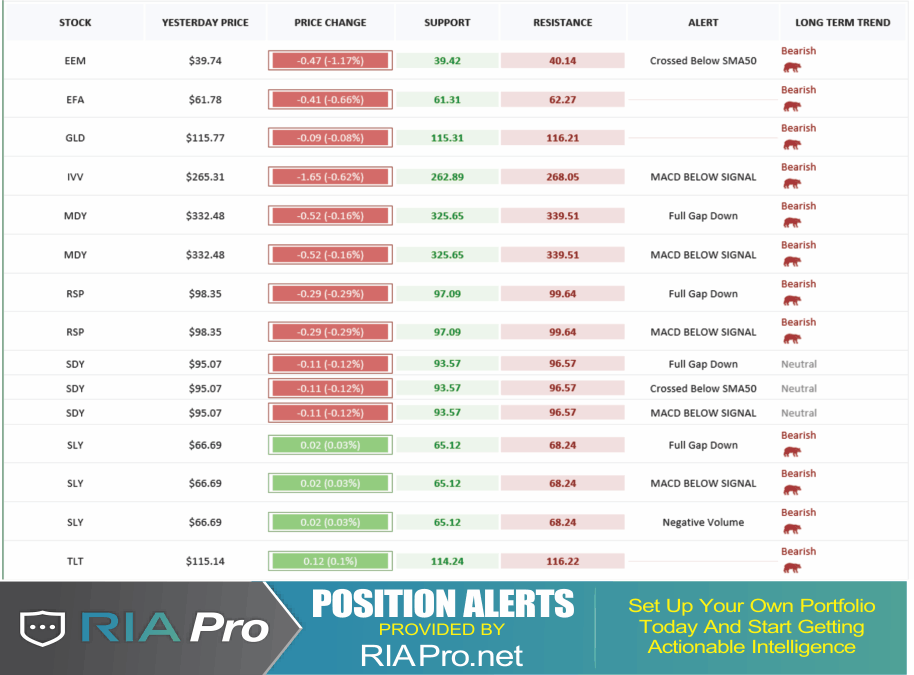
Gold – A sign of life has emerged in the precious metals sector. It is too early to add positions, but the higher bottom put in last week is very encouraging. Also, the stops at $111 have continued to hold. A break above the highs from a couple of weeks ago will be a trading opportunity so raise stops to $113 on current holdings. Don’t try and front run the trade, with the S&P 500 extremely oversold there is a high probability of a counter-trend rally that would “suck investors” back into the market and out of the “safety” of gold. Be patient.
Bonds – continued to rally last week and broke above the 50-dma. With a short-term buy signal in place, but very overbought, it is not yet time to lay on a trade just yet. A rally in the market will likely pull money, like gold, out of bonds temporarily. However, if bonds are able to test and hold the 50-dma then a trading setup will be likely.
We remain long our core bond holdings for capital preservation purposes but all trading positions are currently closed.
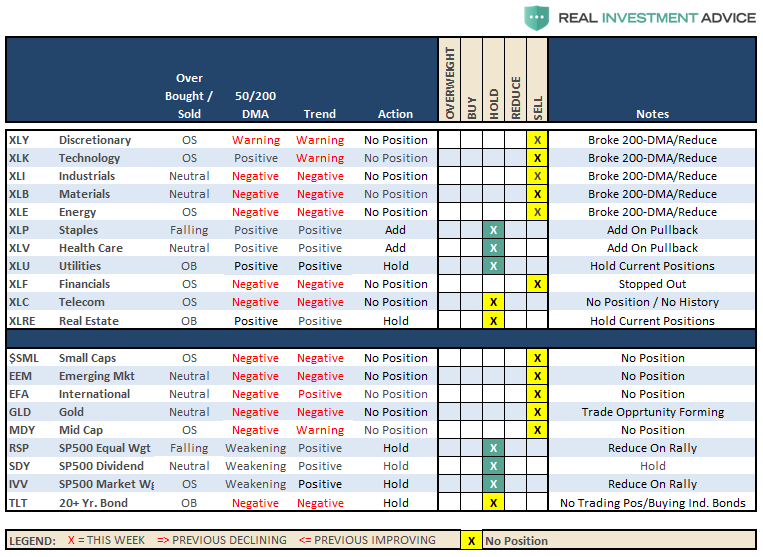
The table below shows thoughts on specific actions related to the current market environment.
(These are not recommendations or solicitations to take any action. This is for informational purposes only related to market extremes and contrarian positioning within portfolios. Use at your own risk and peril.)
Portfolio/Client Update:
Overall market action remains troubling, to say the least. The bullish trend longer-term remains intact and more bearish dynamics are rising.
However, as repeatedly stated above, the market is EXTREMELY OVERSOLD and we are moving into the seasonal strong end-of-the-year which coincides with a historically positive mid-term election year. Importantly, this DOES NOT mean the bull market is set to resume, it just means that we could have a decent rally, which we will look to opportunistically trade, before the bear market resumes next year.
There is no guarantee, of course, that such a rally will come to fruition. It is just weighing probabilities versus possibilities with respect to managing overall risk exposures in portfolios.
We remain comfortable holding extra cash right now. Last week, we removed our overweight in Discretionary holdings as we had noted in last weekend’s missive would be the case. We are now going to “wait and see” what happens next.
- New clients: We will continue to sell down “out of model” holdings and raise cash on rallies.
- Equity Model: After having sold a bulk of positions over the last couple of weeks, we are maintaining a higher weight in cash. We will be looking for a trading opportunity for a counter-trend rally over the next month.
- Equity/ETF blended – Same as with the equity model.
- ETF Model: We sold XLY last week. With portfolios carrying a good bit of cash, we are looking for a trading opportunity for a counter-trend rally over the next month.
We remain vigilant of the risk currently and are happy to err to the side of caution until a new trend emerges.
THE REAL 401k PLAN MANAGER
The Real 401k Plan Manager – A Conservative Strategy For Long-Term Investors
There are 4-steps to allocation changes based on 25% reduction increments. As noted in the chart above a 100% allocation level is equal to 60% stocks. I never advocate being 100% out of the market as it is far too difficult to reverse course when the market changes from a negative to a positive trend. Emotions keep us from taking the correct action.

Looking For A Sellable Rally
Two weeks ago, I stated:
“Next week, it is critically important for the market to rally IF the bulls are going to regain control of the market.”
Not only were they unable to muster a rally then, but also failed last week as well, which keeps the bulls in a very weak position currently.
We continue to deepen the much more important long-term signal which suggests that we should reduce risk in portfolios even more. However, as repeatedly stated above, the markets are EXTREMELY OVERSOLD on a short-term basis AND we are moving into the seasonal strong end-of-the-year, so use rallies to reduce risk accordingly and move portfolios more in line with the model.
We will be looking on a failed rally to overhead resistance to lower the model to 50% of target.
As I noted previously, we have reduced our managed 401k portfolios by another 5%. As long as the market remains in a more negative trend we will continue to use rallies to reduce equity further as needed.
Continue to use rallies to reduce risk towards a target level with which you are comfortable. Remember, this model is not ABSOLUTE – it is just a guide to follow.
Defense remains our primary strategy for 401k-plans currently.
- If you are overweight equities – reduce international, emerging market, mid, and small-capitalization funds on any rally next week. Reduce overall portfolio weights to 75% of your selected allocation target.
- If you are underweight equities – reduce international, emerging market, mid, and small-capitalization funds on any rally next week but hold everything else for now.
- If you are at target equity allocations reduce overall equity exposure to 75% of your allocation target on any rally next week.
Unfortunately, 401k plans don’t offer a lot of flexibility and have trading restrictions in many cases. Therefore, we have to minimize our movement and try and make sure we are catching major turning points. Over the next couple of weeks, we will know for certain as to whether more changes need to be done to allocations as we head into the end of the year.
If you need help after reading the alert; don’t hesitate to contact me.
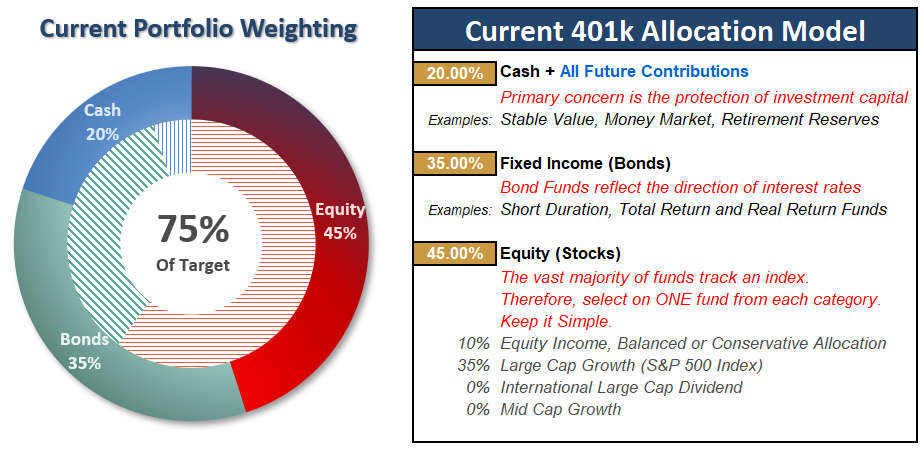
Current 401-k Allocation Model
The 401k plan allocation plan below follows the K.I.S.S. principle. By keeping the allocation extremely simplified it allows for better control of the allocation and a closer tracking to the benchmark objective over time. (If you want to make it more complicated you can, however, statistics show that simply adding more funds does not increase performance to any great degree.)
401k Choice Matching List
The list below shows sample 401k plan funds for each major category. In reality, the majority of funds all track their indices fairly closely. Therefore, if you don’t see your exact fund listed, look for a fund that is similar in nature.

Disclosure: The information contained in this article should not be construed as financial or investment advice on any subject matter. Real Investment Advice is expressly disclaims all liability in ...
more

