
Oil Prices Unfazed By Trump Warning Shot- Charts Highlight July Range
OIL TALKING POINTS
Oil holds a narrow range even as U.S. President Donald Trump fires warning shots against Iran, and the near-term correction in crude appears to have stalled as energy prices come off of the monthly-low ($67.08).
OIL PRICES UNFAZED BY TRUMP WARNING SHOT- CHARTS HIGHLIGHT JULY RANGE

President Trump tweeted Iran ‘will suffer consequences’ if the oil producer threatens the United States again, but the limited reaction suggests crude may continue to face choppy price action over the days ahead as especially Organization of the Petroleum Exporting Countries (OPEC) and its allies remain committee to rebalancing the energy market.
Moreover, recent remarks from Iran Minister of Petroleum,Bijan Namdar Zanganeh, suggest the group will continue to carry out its production-cutting measures as the official argues that ‘dishonoring the OPEC deal by some countries would cause the organization to suffer greatly from the point of view of dignity,’ and the ongoing adjustment in global supply may continue to foster a long-term bullish outlook for crude as oil prices extend the upward trend from earlier this year.
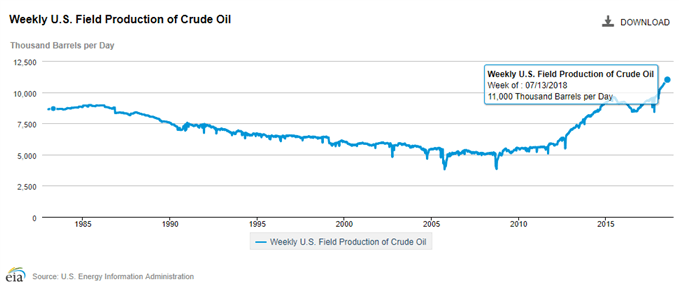
Keep in mind, updates from the U.S. Energy Information Administration (EIA) showed field production picking up for the first time in nearly a month, with outputs increasing to 11,000K b/d from 10,900K b/d in the week ending July 6, and OPEC and its allies may keep the door open to make additional adjustments to its production schedule in an effort to keep oil prices afloat.
In turn, the broader outlook for crude remains constructive as both price and the Relative Strength Index (RSI) track the upward trends from earlier this year, and crude may work its way back towards the top of the July range amid the string of failed attempt to break/close below the $67.10 (23.6% expansion) to $67.30 (50% expansion) region.
OIL DAILY CHART
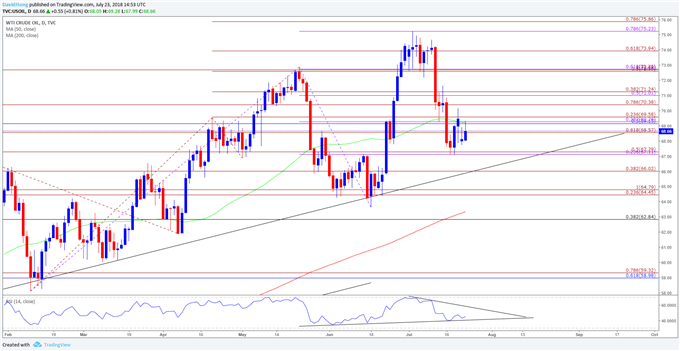
- The near-term correction in crude may continue to unravel as oil prices bounce back ahead of trendline support, with the monthly range largely in focus as the $67.10 (23.6% expansion) to $67.30 (50% expansion) region offers support.
- Need a break/close above $70.40 (78.6% expansion) to bring the topside targets back on the radar, with the next region of interest coming in around $71.00 (50% expansion) to $71.20 (38.2% expansion) followed by the overlap around $72.70 (50% expansion) to $72.80 (100% expansion).
- Break/close above the former-support zone brings up the $74.00 (61.8% expansion) handle followed by the $75.20 (78.6% expansion) to $75.90 (78.6% expansion) region, which largely lines up with the July-high ($75.24).
Disclosure: Do you want to see how retail traders are currently trading the US Dollar? Check out our IG Client Sentiment ...
more

