
Next Stop — $80 Oil?
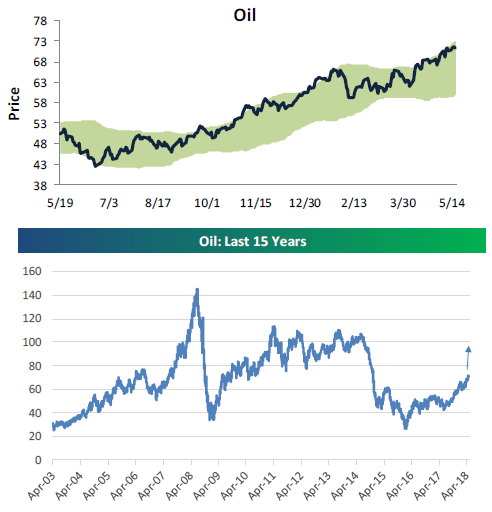
Below are two charts for oil — a one-year chart and a fifteen-year chart. As you can see in the one-year chart, the price of oil has been in a steady uptrend for the last eleven months.
The longer term chart for oil looks much different than the one-year chart. Ten years ago, oil was trading above $140, so it’s about half that price right now. Should price continue higher in the near-term, it’s next resistance level is $80, which is the bottom of the $80-$100 range that it traded in from 2010 through 2014.
How did you like this article? Let us know so we can better customize your reading experience.

Comments
Leave a comment to automatically be entered into
our contest to win a free Echo Show.

