
Gold Trading Lower And Now Testing Key Level… Again
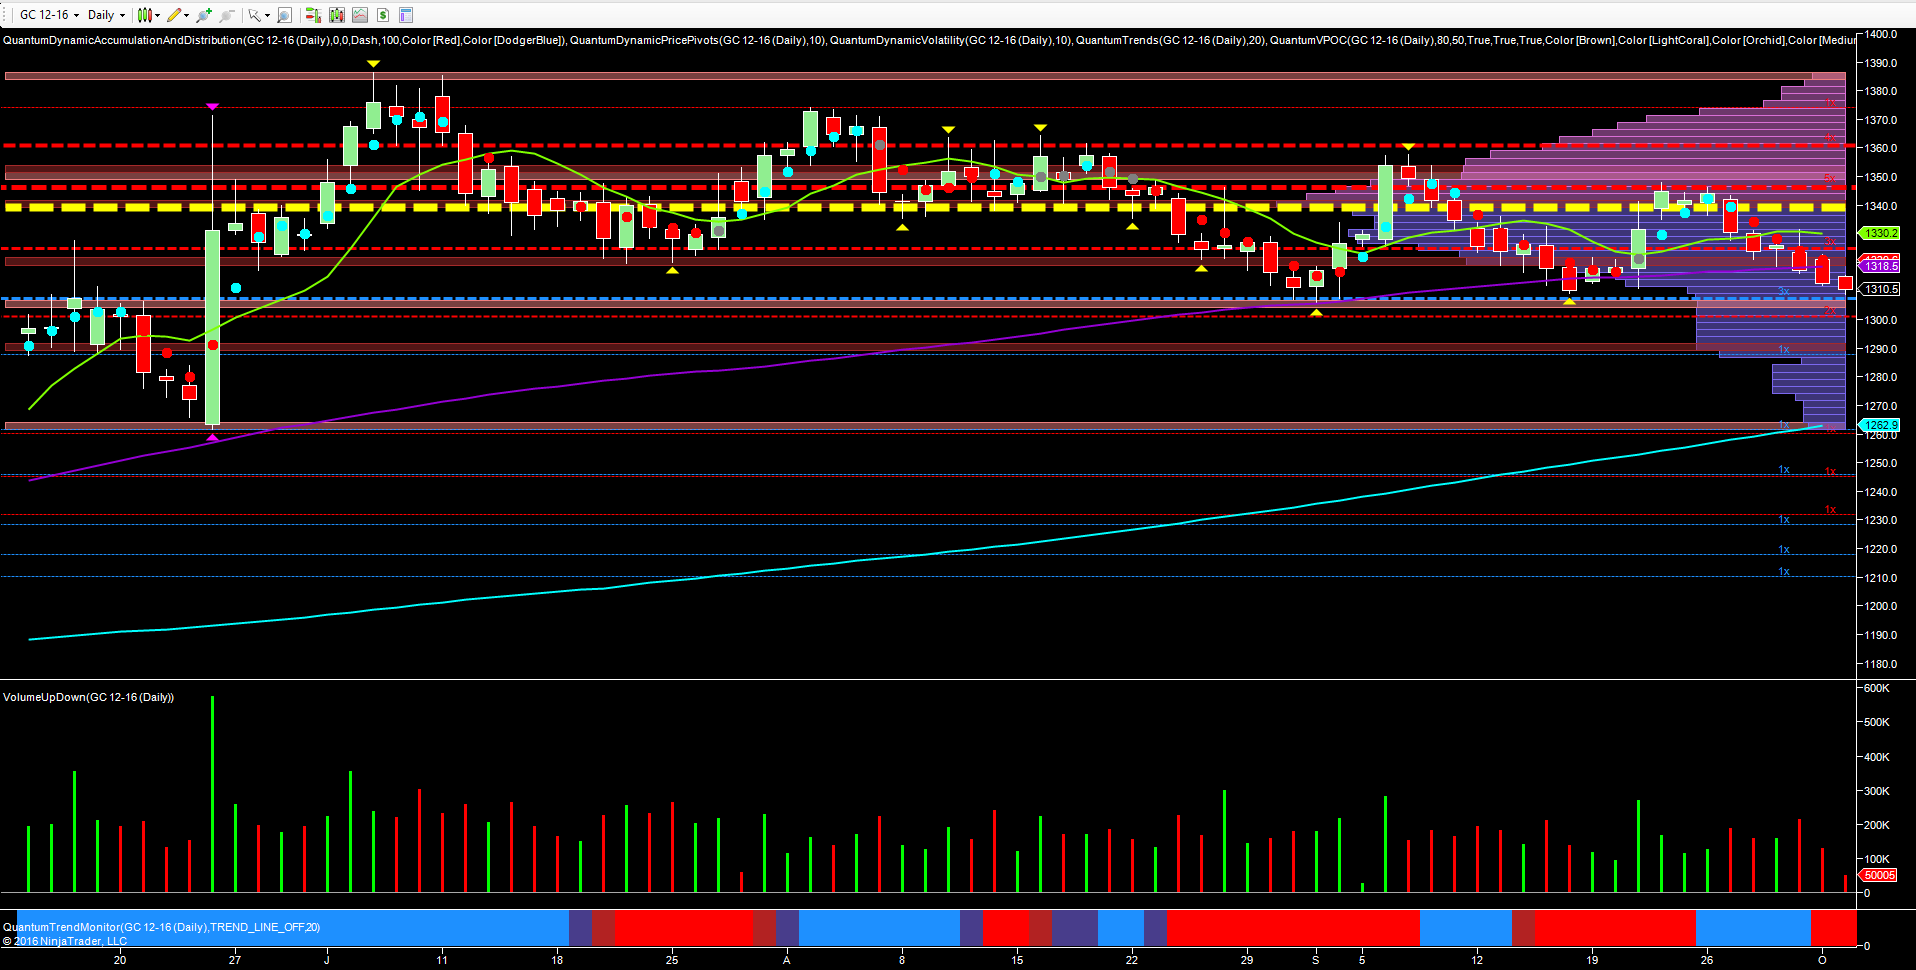
The metronomic price action for gold is continuing to play out once again on the daily chart, with the rally of late September starting to wane once again, as the precious metal descends once more to test the all important technical support area in the $1308 per ounce region in early trading. This level is one which has been building for many weeks, and repeatedly tested, most recently in late August and again in mid September. On both occasions it held firm with a consequent rally higher and back to the volume point of control. However, following yesterday’s move lower and a continuation of the bearish sentiment in early trading today, this level is once again under attack, and as I have said in previous analysis, if this floor is breached then gold looks set to test the Brexit low of $1260 per ounce, with only minor potential support waiting in the $1290 per ounce area.
Trading volumes remain relatively light, and it was interesting to note the fall in volume yesterday, and repeating the volume pattern of mid September which resulted in a bounce higher.
Disclaimer: Futures, stocks, and spot currency trading have large potential rewards, but also large potential risk. You must be aware of the risks and be willing to accept them in order to invest in ...
more

