
Gold Prices Fly As USD Slides- FOMC, NFP To Drive February Open
Fundamental Forecast for Gold:Neutral
- Gold prices set monthly opening-range just below structural resistance
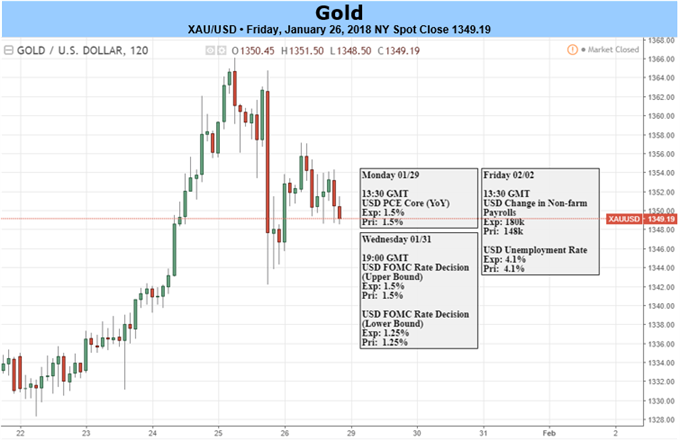
Gold prices rallied this week with the precious metal up more than 1.5% to trade at 1366 ahead of the New York close on Friday. The advance comes amid continued weakness in the greenback with the DXY (Dollar Index) down more than 2.2% to mark fresh three-year lows. However, with a big week of event risk on tap and prices coming off technical resistance, the rally may be vulnerable near-term heading into the close of the month.
Looking ahead to next week the central focus will shift on key U.S. event risk with the FOMC interest rate on Wednesday and the Non-Farm Payrolls report on Friday. This will be Janet Yellen’s final policy meeting as Chair before newly confirmed Jerome Powell takes the reins on February first. Market expectations are that the newly minted Federal Reserve Chairman will broadly carry on the central bank’s steady and measured pace of monetary tightening.
For gold, the events are likely to fuel added volatility after prices responded to technical resistance levels this week. Note that the January opening range break suggests a late month high in prices and while the broader picture remains constructive for bullion, heading into the February open there are a few key levels to keep in mind.


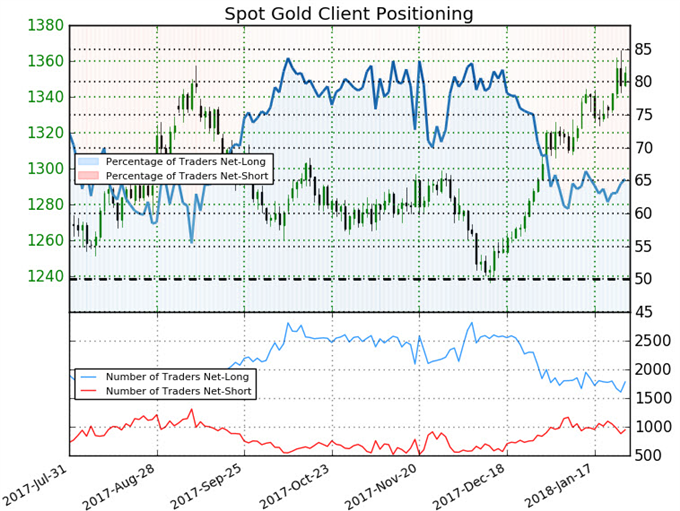
- A summary of IG Client Sentiment shows traders are net-long Gold - the ratio stands at +1.88 (65.2% of traders are long)- bearish reading
- Long positions are 2.4% lower than yesterday and 4.6% lower from last week
- Short positions are 2.7% lower than yesterday and 10.1% lower from last week
- We typically take a contrarian view to crowd sentiment, and the fact traders are net-long suggests
- Spot Gold prices may continue to fall. Traders are further net-long than yesterday and last week, and the combination of current sentiment and recent changes gives us a stronger Spot Gold-bearish contrarian trading bias.
Gold Weekly Price Chart
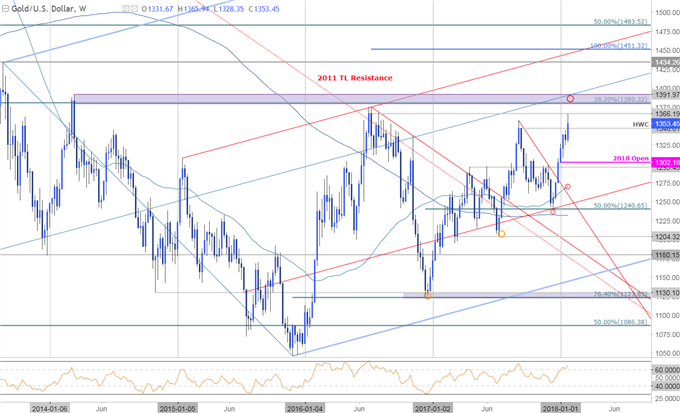
A breach above the 2017 high-week close at 1346 saw prices stretch into the 2016 high-close at 1366 before pulling back late in the week. A critical resistance range is eyed just higher at 1380-1391 where the 2014 highs converges on the 38.2% retracement of the decline off the record 2011 highs. Note that the median-line of the broader ascending pitchfork formation extending off the 2013 lows also converges on this zone. Bullish invalidation now raised to the April highs / yearly open at 1295-1302.
Gold 240min Price Chart
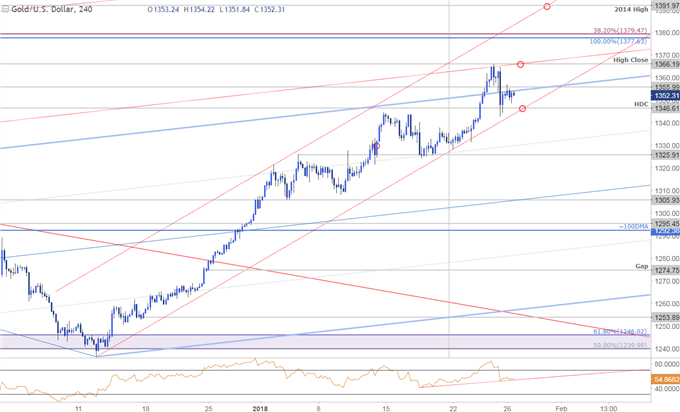
A closer look at near-term price action highlights an ascending channel formation extending off the December lows with the lower parallel now converging on the 1346 target. A break below this level would suggest a more significant correction is underway with such a scenario targeting 1325 and the median-line, currently around ~1306/11.
Bottom line: I’ll be look for a reaction at channel support into the start of the week with a breach above this week’s high targeting subsequent resistance objectives at 1378/79 and the upper parallel / 2014 high at 1391. A daily close below channel support would shift the focus back towards structural support near the median-line- a level of interest for possible exhaustion / long-entries IF reached.
Disclosure: New to Trading? Get started with this Free Beginners Guide What are the ...
more

