
Gold Price Forecast: Monthly-High On Radar Amid String Of Higher-Lows
Gold pulls back from a fresh weekly-high ($1229) despite the renewed rout in risk sentiment, but recent price action keeps the monthly-high ($1237) on the radar as prices for the precious metal extend the recent string of higher-lows.
GOLD PRICE FORECAST: MONTHLY-HIGH ON RADAR AMID STRING OF HIGHER-LOWS

Keep in mind that gold prices appear to be bound by a broad range as the recent advance appears to be sputtering ahead of the October-high ($1243), and the precious metal may continue to consolidate ahead of the next Federal Reserve interest rate decision on December 19 as the central bank is widely anticipated to raise the benchmark interest rate by 25bp to a fresh threshold of 2.25% to 2.50%.
It seems as though the Federal Open Market Committee (FOMC) will further normalize monetary policy in 2019 despite the gridlock in Congress, and the central bank may continue to endorse a hawkish forward-guidance as the economy sits at full-employment, while inflation climbs above the 2% target.
At the same time, the shift in U.S. trade policy may ultimately encourage Chairman Jerome Powell & Co. to temporary push the fed fund rate above neutral as ‘several participants reported that firms in their Districts that were facing higher input prices because of tariffs perceived that they had an increased ability to raise the prices of their products.’ Rising interest rates may continue to sap the appeal of gold as the FOMC shows no interest of abandoning the hiking-cycle, but sentiment surrounding the precious metal remains skewed even though market participation appears to be waning ahead of the U.S. holiday.
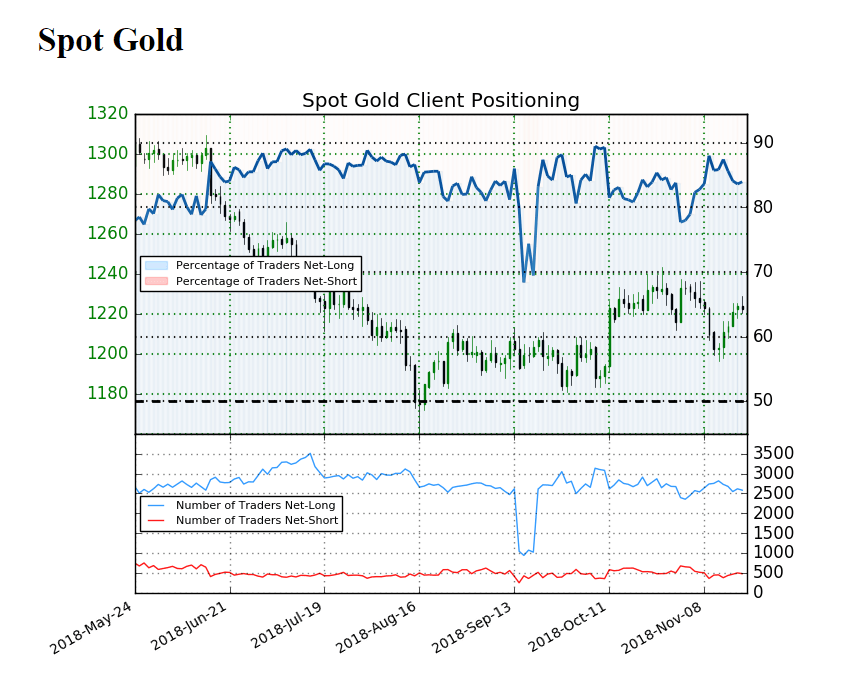
The IG Client Sentiment Report shows 84.0% of traders are still net-long gold versus 86.7% last week, with the ratio of traders long to short at 5.24 to 1. The number of traders net-long is 3.5% lower than yesterday and 8.0% lower from last week, while the number of traders net-short is 1.0% lower than yesterday and 5.9% lower from last week.
The ongoing tilt in retail position undermines the rebound from the 2018-low ($1160) as it offers a contrarian view to crowd sentiment, but recent price action keeps the monthly-high ($1237) on the radar as the price for bullion extends the recent string of higher-lows.
GOLD DAILY CHART
(Click on image to enlarge)
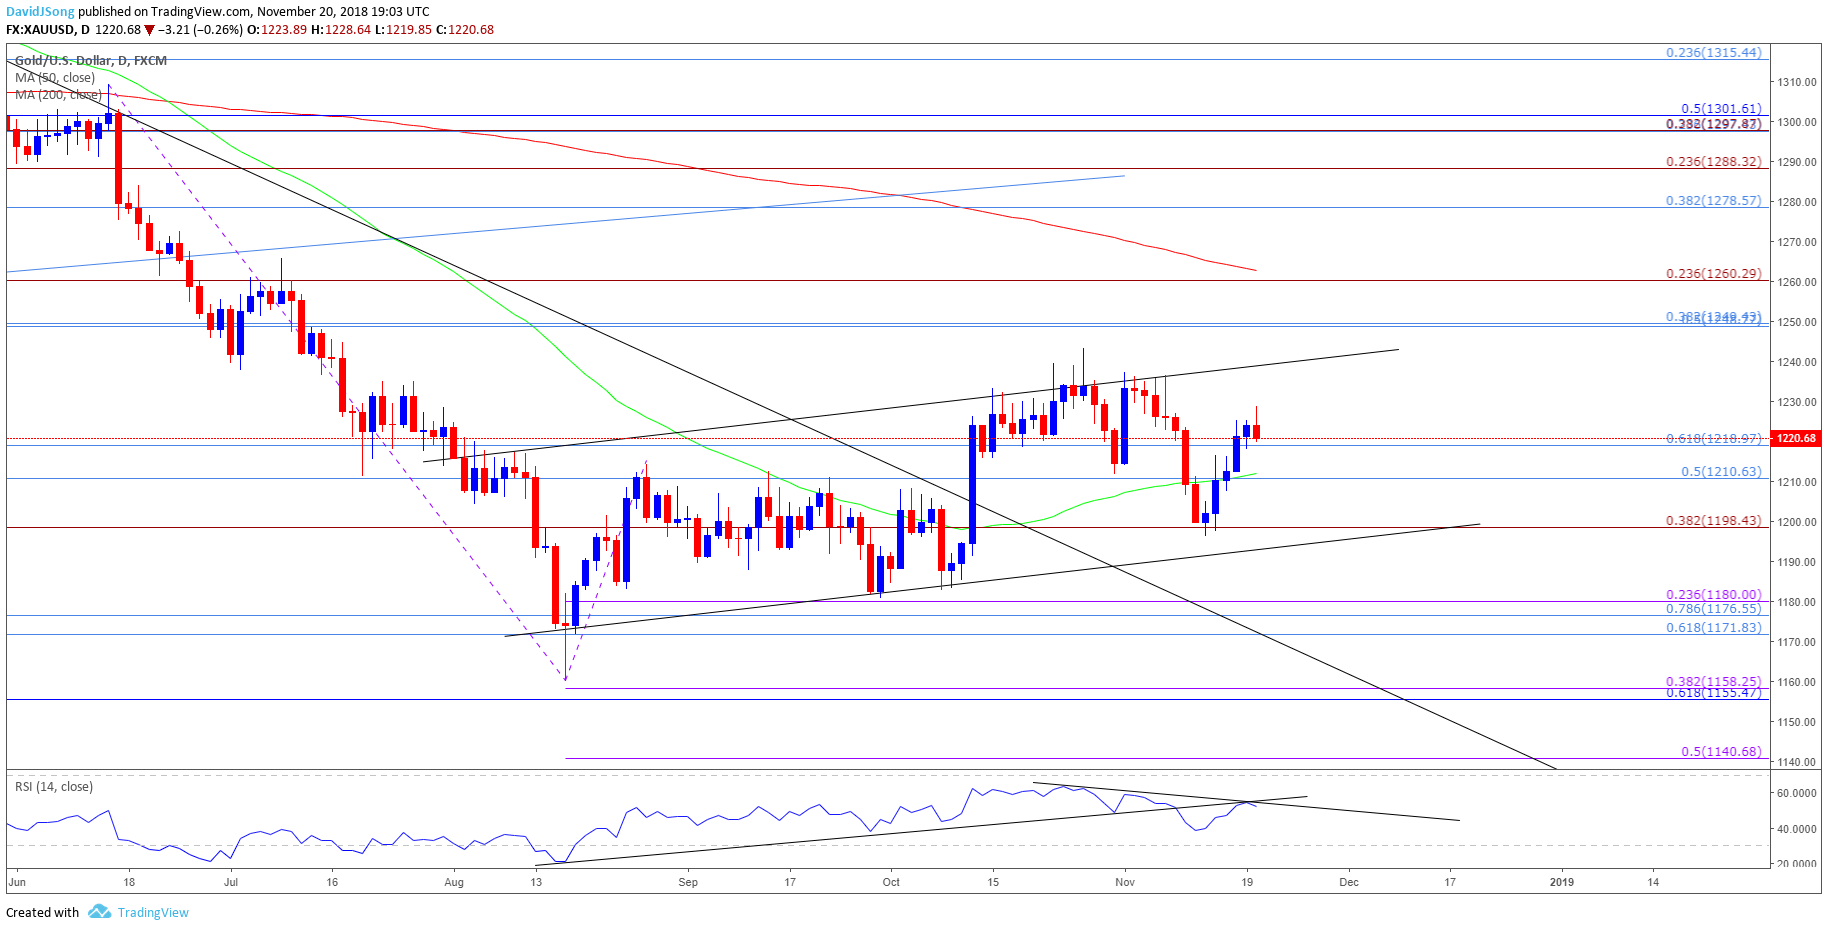
- Keep in mind, gold appears to be stuck in the upward trending channel after breaking out a downward trend from earlier this year, with a failed attempt to test the October-low ($1183) raising the risk for a move towards the monthly-high ($1237).
- The October-high ($1243) comes up next followed by the Fibonacci overlap around $1249 (50% retracement) to $1250 (38.2% retracement).


