
Gold Has A Full Fractal Tank Of Gas
After a rousing break of the four year doldrums in February, gold can't seem to get out of its own way now for the last four months. It has been range bound with a false break out:

Well, four months (as well as 4 years) is a fractal time segment for gold where its behavior tends to change. I examined this four year fractal behavior back in mid February with the article Gold's Bull/Bear Status, after suspecting a major turn in gold at the four year mark of the decline was beginning. And if you look at the fractal dimension of gold at the monthly scale, you see a bigger picture of why things seem to be on the verge of changing.
Fractal dimension is a high math way of quantifying any moving object's pent up reversion to random motion. With stocks, it's a way of gauging how much fuel is in the tank for any possible trend, either up or down. The higher the fractal dimension, the more fuel is in the tank. Gold is at an interesting juncture right now with its monthly scale fractal dimension. These dimensions are calculated in daily, weekly, or monthly scales for stock use with the monthly being the most instructive for long term trends (over a year). According to the algorithm on my desk, we have this current condition for gold:
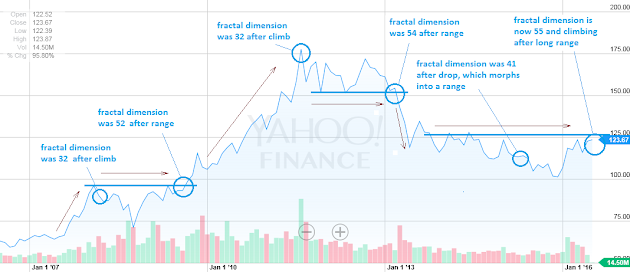
The fractal dimension is low after an extended, powerful move, and builds to a high after a protracted sideways move or range. It exhausted to a low of 32 after the big climb into the 2008 top and built to a high of 52 just before the blitz up to the 2011 top. After a range at this top, a dimension of 54 was built, which exhausted itself quickly with the 2013 move.
This is a monthly chart, and you can see the volume confirmation for the February break-out of gold this year. The condition we have now is a range extending from 2013, and the fractal dimension is quickly building, currently at 55 - higher than it was at the start of the 2009 climb, or at any time in the last 10 years. This suggests an energetic move, up or down, coming up. The attempted break of the channel shown at the top chart is looking less and less like the failed break back at the end of April. The other technicals, and certainly the fundamentals, point in the up direction. But we shall soon see.
I am long gold and gold miners.


