
Gold And Silver At Resistance
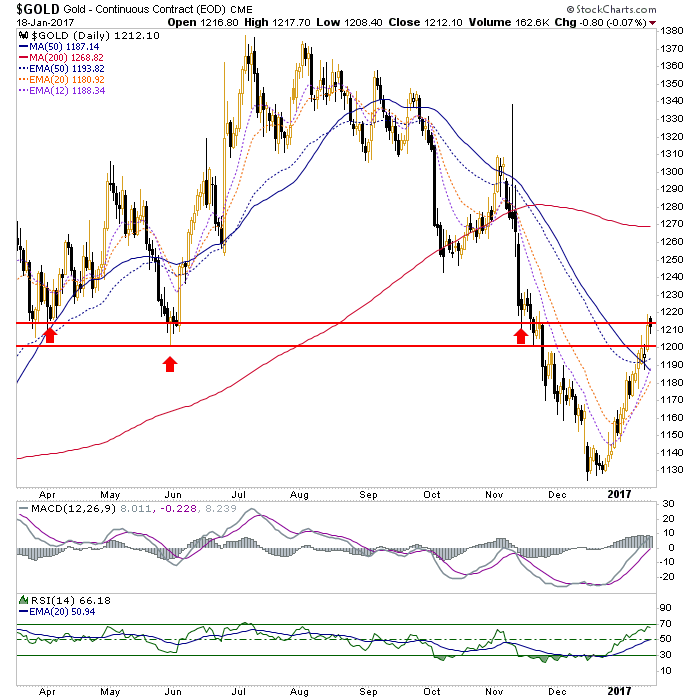
Everybody knows gold had resistance at the nice, round 1200 number. It got through there yesterday, but can still be considered at resistance defined by the spring lows. At the moment gold is trading at 1201 (this chart’s data closed before it did its little in-day reversal).
Silver was shown to have a very clear line in the sand at 17.25, which it made an attempt at today, before reversing. A break and hold above 17.25 would make us stand up and take notice. It is at 17.07 in real time at the time of this post, however. So nice try but no cigar yet.
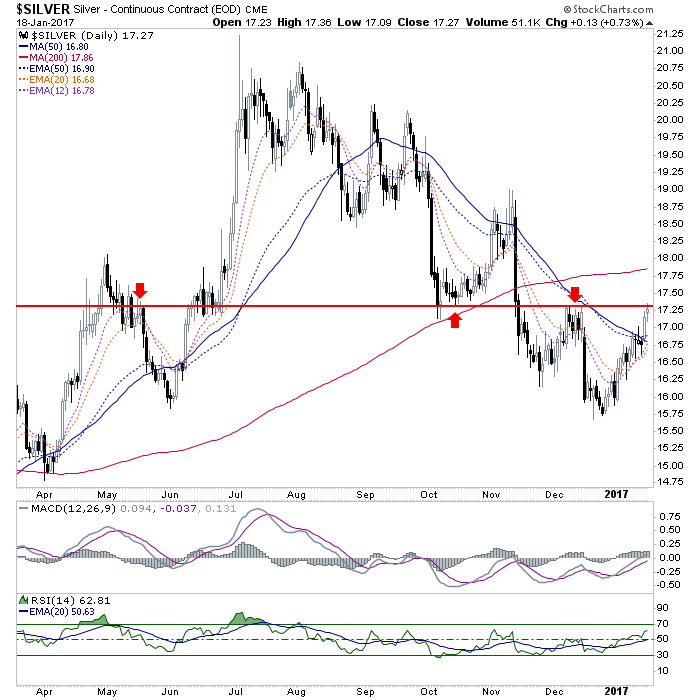
Using this weekly chart we have been noting that gold could actually take out the headline news-worthy 1200 resistance but still face the bear market ball and chain, AKA the weekly EMA 70. Silver’s bear market ball and chain was the EMA 55, and silver has reversed at that level.

I don’t pretend to be able to predict squat, but it was advised in an update yesterday that traders – those who played the precious metals for the “bounce” that it is still technically categorized as – should consider taking profits.
The miners look better (for now, at least) relative to the metals and there is a lot of macro stuff in play as well, along with silver’s concerning Commitments of Traders and gold’s potentially incomplete CoT trend. It’s been a good bounce so far, but technically that is all we have been able to call it it since it began. If it changes that status to something more, fine, we’ll take note and adjust tack. But as you can see above, that has not happened yet.
Disclosure: Subscribe to more


