Gold & Gold Stocks Nearing A Big Move

Gold and especially gold mining stocks rebounded on Wednesday and trended higher into the weekend. This is giving some investors renewed hopes that the bull market that began roughly 18 months ago is about to reassert itself. We cannot know for sure yet but what we can say is precious metals are nearing a big move. Gold and gold stocks have traded in tight ranges which will compress further while volatility indicators approach multi-year lows. This is the setup for a break and then a powerful move with increasing momentum and volatility.
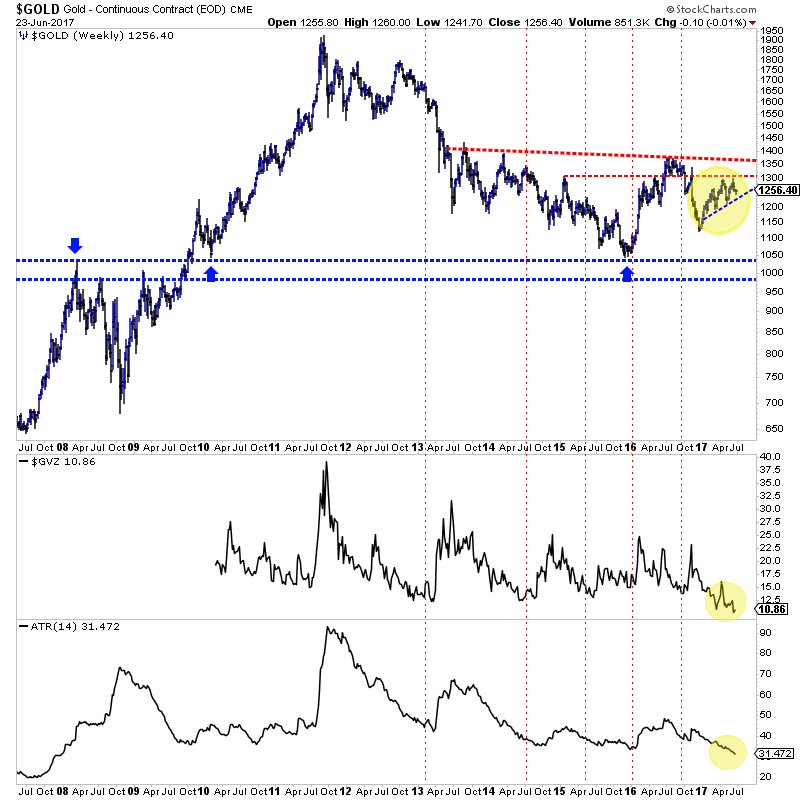
First let’s take a look at Gold. Its weekly bar chart is shown (going back 10 years) with two volatility indicators at the bottom. One is the GVZ contract and one is the average true range (ATR) indicator. The ATR indicator is at a 10-year low while GVZ is near an 8-year low. Gold has tested major resistance ($1300) twice and failed both times. If Gold loses its 2017 uptrend (support is around $1230) then it is susceptible to an accelerated decline with increasing volatility and momentum. On the other hand, if Gold could bust through $1300 and then consolidate around $1350, it could setup that anticipated breakout through $1350-$1375.

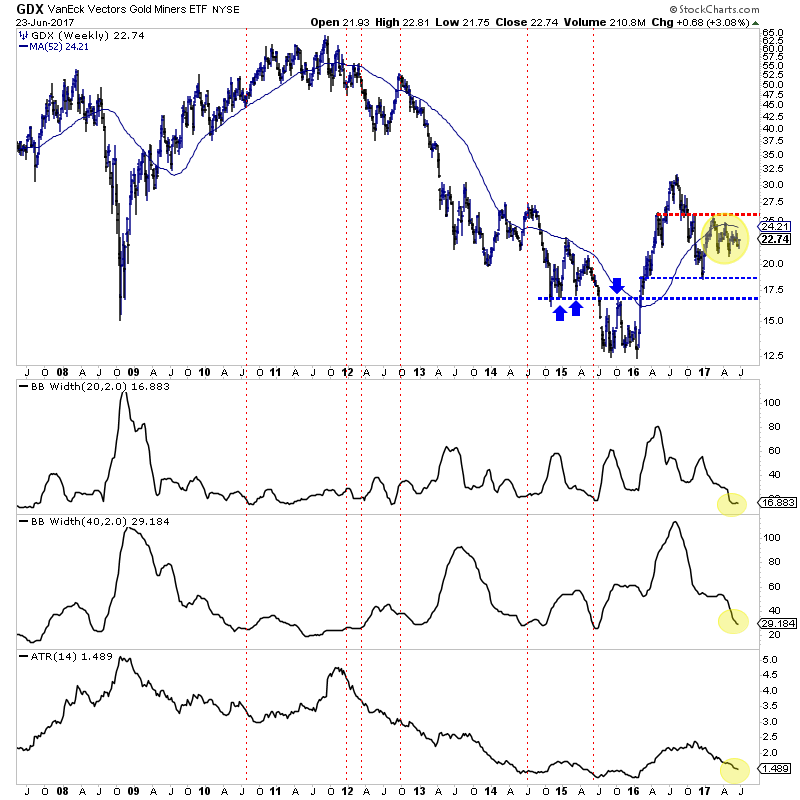
Turning to the gold stocks, we plot a 10-year bar chart of GDX along with the ATR indicator and the bollinger band width for two periods (20 and 40 weeks). These volatility indicators are trending down and approaching multi-year lows. This is not a surprise as GDX has traded in a tighter and tighter range since January 2017. Specifically, GDX has traded in a descending triangle pattern which, if GDX breaks $21 to the downside has a downside target of $17. The bullish outcome would entail GDX rallying to $25 and then breaking higher after a consolidation.

The bulls are cheering this latest rebound but they have a lot more work to do if the next big move is going to be higher. First things first, Gold needs to break $1300 and GDX needs to retest $25 again. The short-term trend could be higher now but until the Gold sector can attain those marks then the bias for the next big move (due to among other reasons the relative weakness in Silver and gold stocks) should remain to the downside. That is why we remain cautious.


Gold dropped through its 200-day moving average of $1241 this Monday morning >dropping almost $11 in one swell swoop at 3:55AM
>hitting a low of $1,239.01 at 8:20AM
>before bouncing up to $1,245.81 mid-morning
>before beginning to decline once again (currently down to $1,243.59).
I can see why Jordan remains cautious.
Jordan says "Gold needs to break $1300 and GDX needs to retest $25 again...Until the Gold sector can attain those marks then the bias for the next big move...should remain to the downside. That is why we remain cautious."
Hubert Moolman agrees illustrating that fact in a graph in an article (www.munknee.com/gold-chart-says-a-massive-move-up-or-down-is-imminent/) that shows that:
">Gold is currently trading near a critical 6-year resistance line that the gold price has to overcome, for the continuation of the gold bull market.
>Since price has now failed more than four times at the line, there is a great chance that we could see a big drop.
>If the price is to turn around and break through the resistance line, then a great amount of energy is required to fuel such a move – and that can only come from a collapse of a big market like the general stock market, or the bond market.
>•When gold breaks through the resistance line, however, we will see a gold rally like that of 1979/1980."
Moolman also maintains in the same article that "there is a peculiar fractal that suggests the current situation for gold is very similar to that of May 1979, just before the massive rise in gold" illustrating that possibility/likelihood in a long-term gold chart which is self-explanatory.
Sean Brodrick looks at it slightly differently but comes to the same conclusion, more or less, saying in www.munknee.com/this-could-be-the-most-important-gold-pullback-ever-to-consider-buying-into-heres-why/ that
>"if gold breaks its 200 day support (at $1,241)…THAT would be a heck of a buying opportunity.
>IF we break support...then you should buy gold and miners with both hands because that will likely mark the beginning of the next Mega Bull trend.
> The market won’t really turn bullish on gold again, however, until it pushes up through $1300."
Anyone taking issue with what Jordan, Hubert or Sean have had to say? If so, I'd like to hear from you.