
GLD… Break Out Day
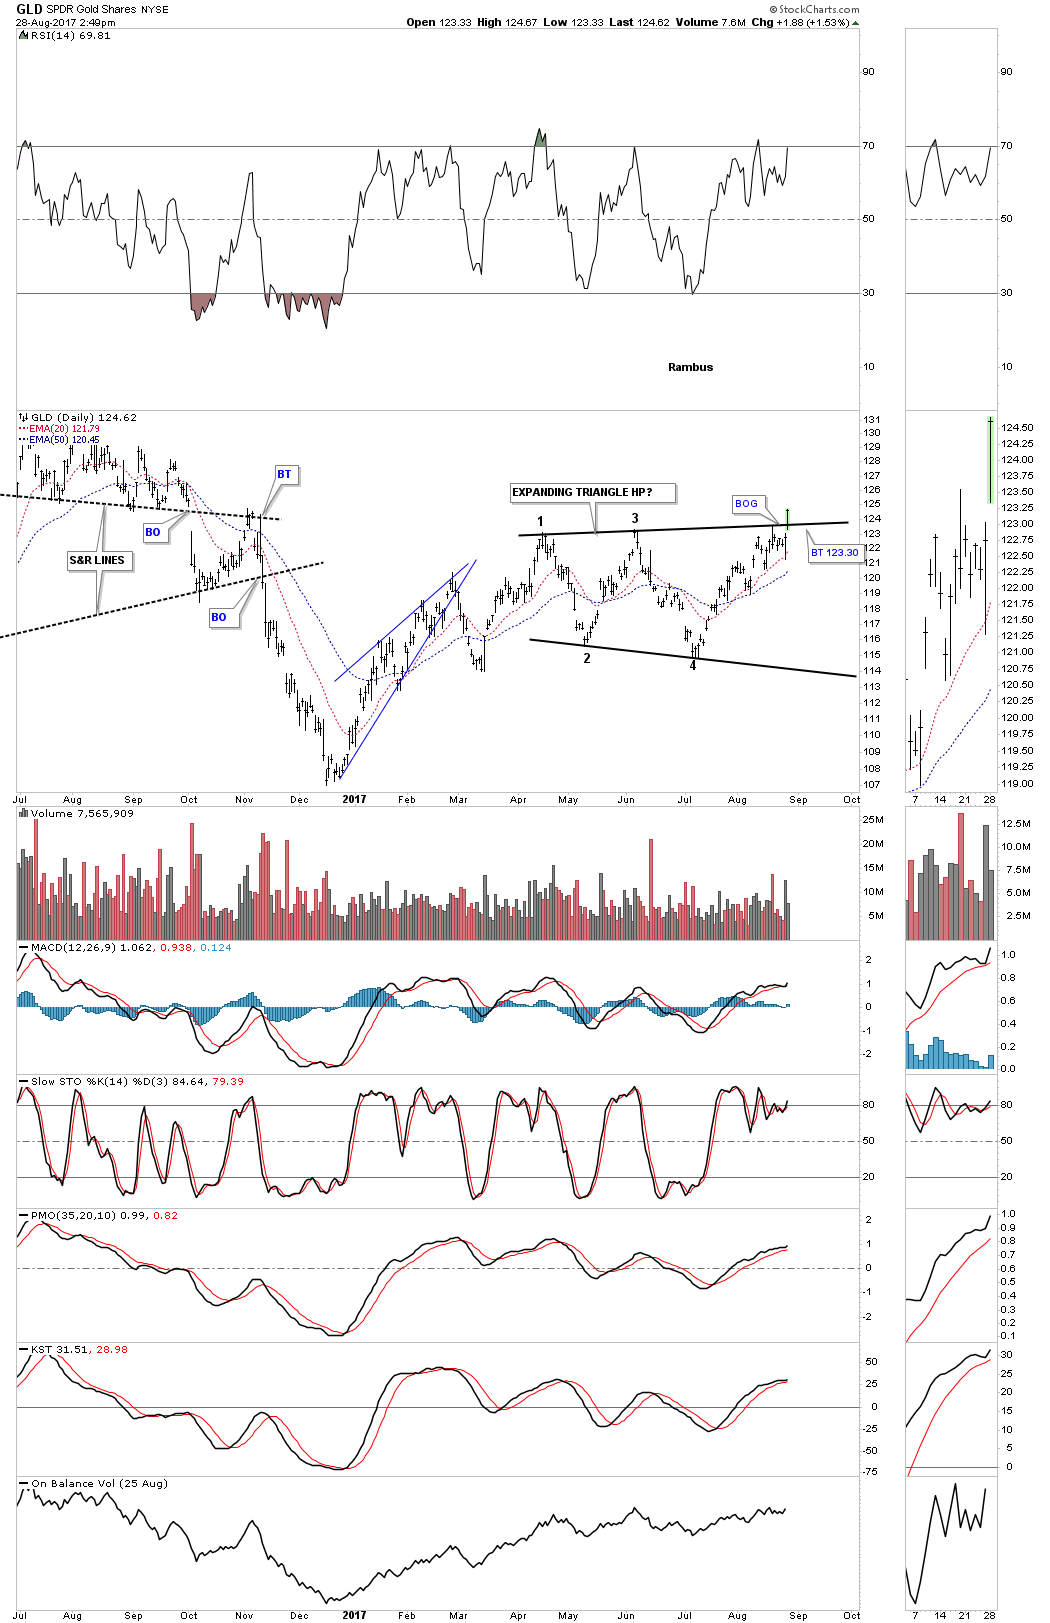
Below is a short term daily chart for GLD which shows it breaking out above the top rail of the blue expanding triangle today.
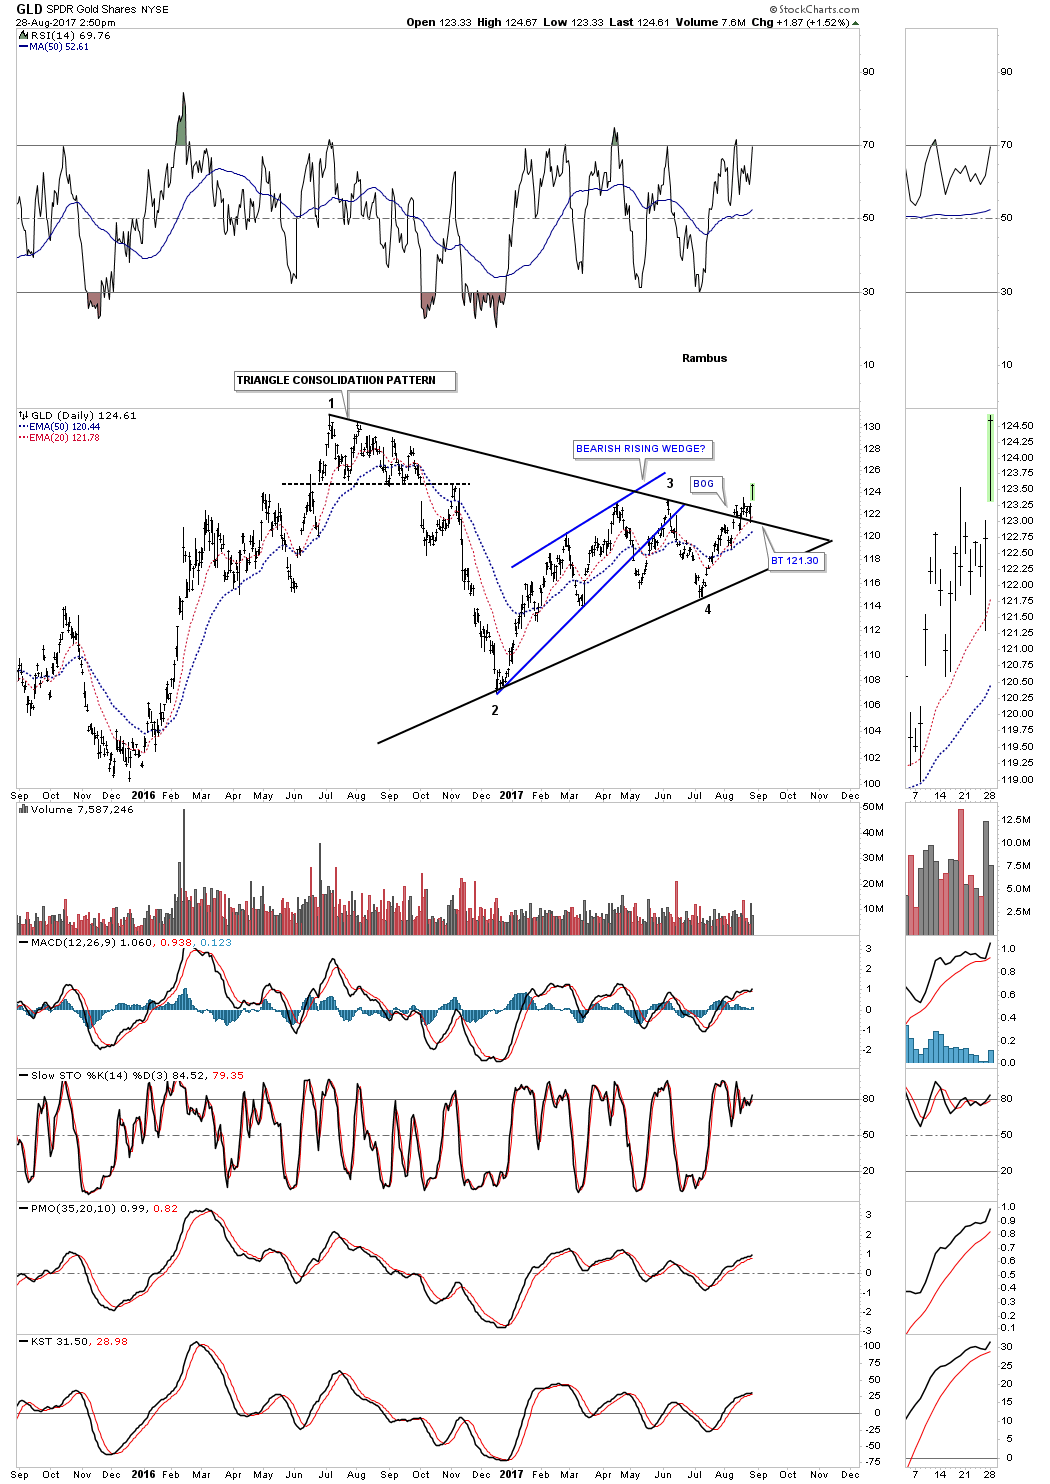
The longer term 2-year daily chart shows GLD breaking out and backtesting the top rail of the triangle consolidation pattern. It looks like all the work is now finished with the breaking out and backtesting process.
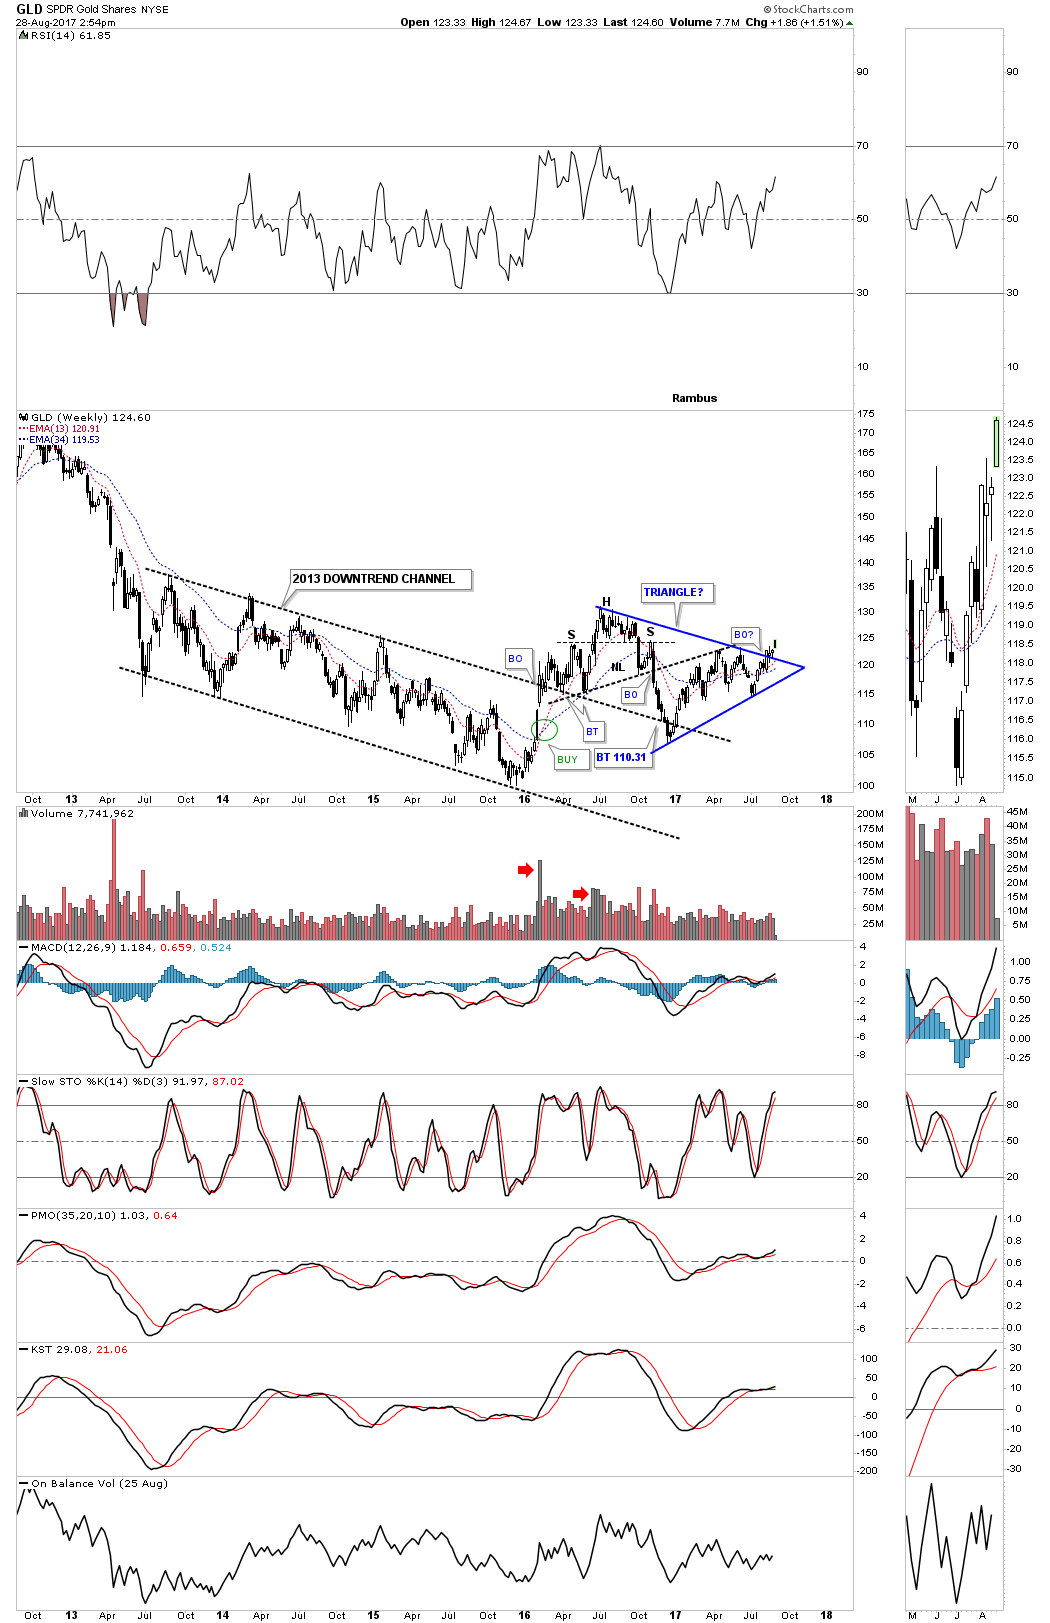
Below is the 5-year weekly chart for perspective.
Disclosure: None.
How did you like this article? Let us know so we can better customize your reading experience.

Comments
Leave a comment to automatically be entered into
our contest to win a free Echo Show.

