Thursday, November 16, 2017 1:44 AM EDT
Crude oil prices sank, suffering the largest daily loss in two months, after the IEA lowered its demand outlook and predicted a firm new floor has not been established. This was followed by API inventory data that revealed a shocking 6.5 billion inflow into US storage last week.
The spotlight now turns to EIA inventory data, where a 1.8 million barrel drawdown is expected. A result that registers closer to the API estimate may engineer another lunge downward. Reports that OPEC is struggling to convince Russia to participate in an output cut extension might compound selling pressure.
Gold prices continued to mark time in familiar territory. October’s US CPI statistics are now in focus, with expectations pointing to a slowdown in the year-on-year inflation rate. Traders might look past the report to focus on prospects for US tax reform however.
GOLD TECHNICAL ANALYSIS – Gold prices remain stuck within the narrowing bounds of a would-be Triangle chart pattern. The setup’s bearish implications would be activated on a close below 1272.01, the intersection of the 38.2% Fibonacci expansion and the Triangle floor. That would initially expose the 1260.80-61.50 area (October 6 low, 50% level). Alternatively, a move above the Triangle top – now at 1294.10 – paves the way for another challenge of the October 16 high at 1306.04.
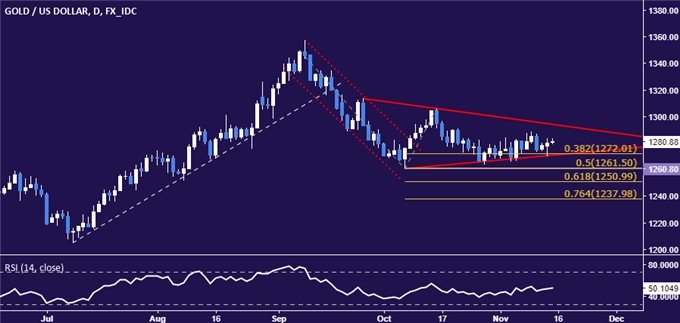
Chart created using TradingView
CRUDE OIL TECHNICAL ANALYSIS – Crude oil prices turned sharply lower to test support at 55.01, the 23.6% Fibonacci retracement. A daily close below that exposes the 38.2% level at 53.21. Alternatively, a move back above the 14.6% Fib at 56.12 opens the door for a retest of the November 8 high at 57.92.
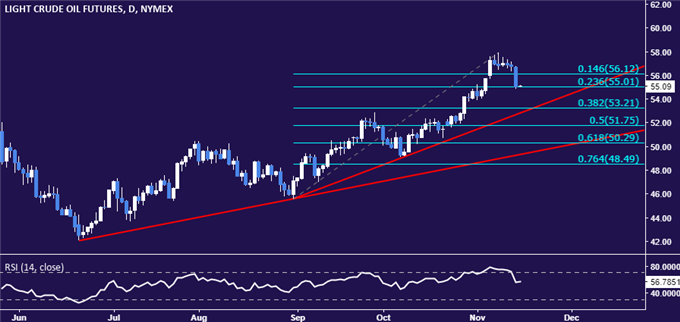
Chart created using TradingView
Disclosure: DailyFX, the free news and research website of leading forex and CFD broker FXCM, delivers up-to-date analysis of the ...
more
Disclosure: DailyFX, the free news and research website of leading forex and CFD broker FXCM, delivers up-to-date analysis of the fundamental and technical influences driving the currency and commodity markets. With nine internationally-based analysts publishing over 30 articles and producing 5 video news updates daily, DailyFX offers in-depth coverage of price action, predictions of likely market moves, and exhaustive interpretations of salient economic and political developments. DailyFX is also home to one of the most powerful economic calendars available on the web, complete with advanced sorting capabilities, detailed descriptions of upcoming events on the economic docket, and projections of how economic report data will impact the markets. Combined with the free charts and live rate updates featured on DailyFX, the DailyFX economic calendar is an invaluable resource for traders who heavily rely on the news for their trading strategies. Additionally, DailyFX serves as a portal to one the most vibrant online discussion forums in the forex trading community. Avoiding market noise and the irrelevant personal commentary that plague many forex blogs and forums, the DailyFX Forum has established a reputation as being a place where real traders go to talk about serious trading.
Any opinions, news, research, analyses, prices, or other information contained on dailyfx.com are provided as general market commentary, and does not constitute investment advice. Dailyfx will not accept liability for any loss or damage, including without limitation to, any loss of profit, which may arise directly or indirectly from use of or reliance on such information.
** All times listed in GMT. See the full DailyFX economic calendar here.
less
How did you like this article? Let us know so we can better customize your reading experience.


