
Bulls Remain In Charge
Markets Hit New Highs
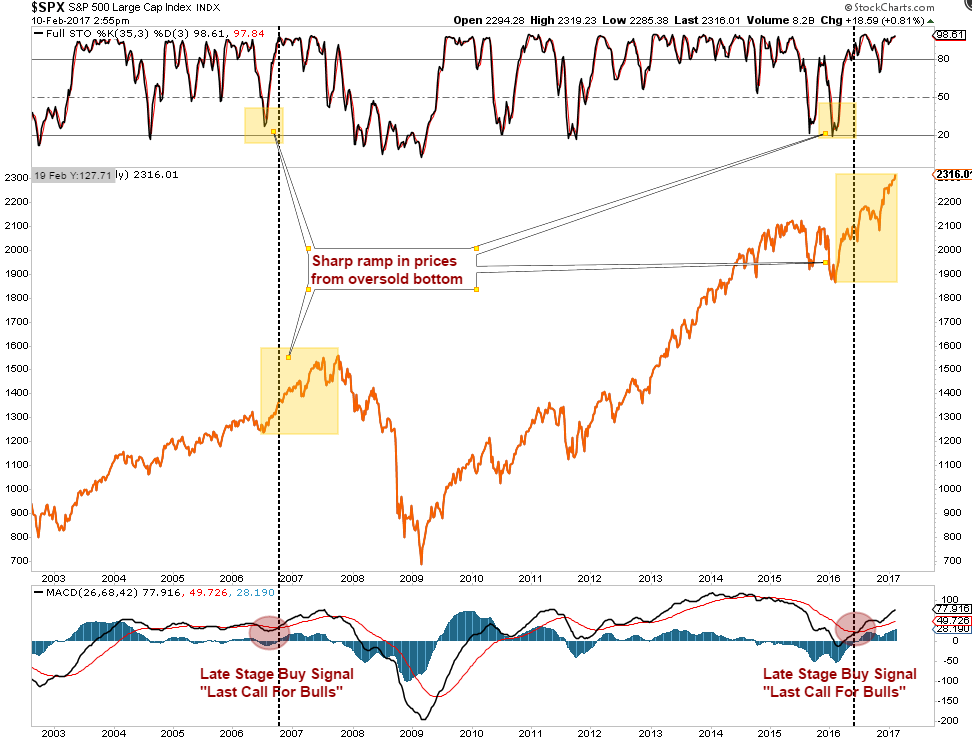
Since the beginning of January, the markets have remained in a very low volatility sideways trading pattern as shown in the chart below. However, this past week all three indices broke out to the upside with the Dow moving above 20,000 and the S&P 500 surging above the 2,300 mark.
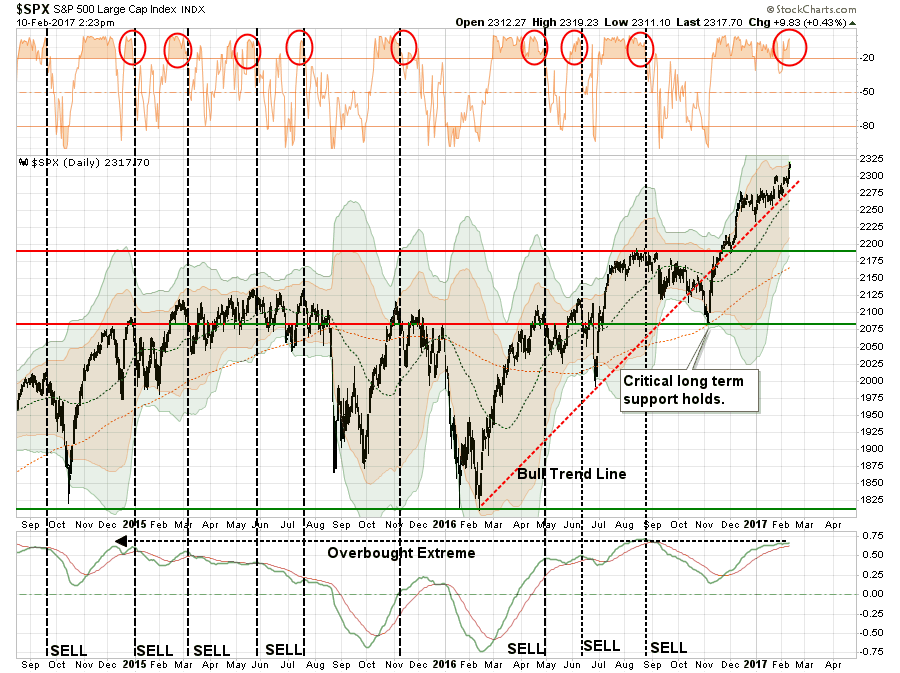
Not surprisingly, the push this week has once again pushed markets back into extreme overbought conditions as we head into the weakest part of February as I noted previously:
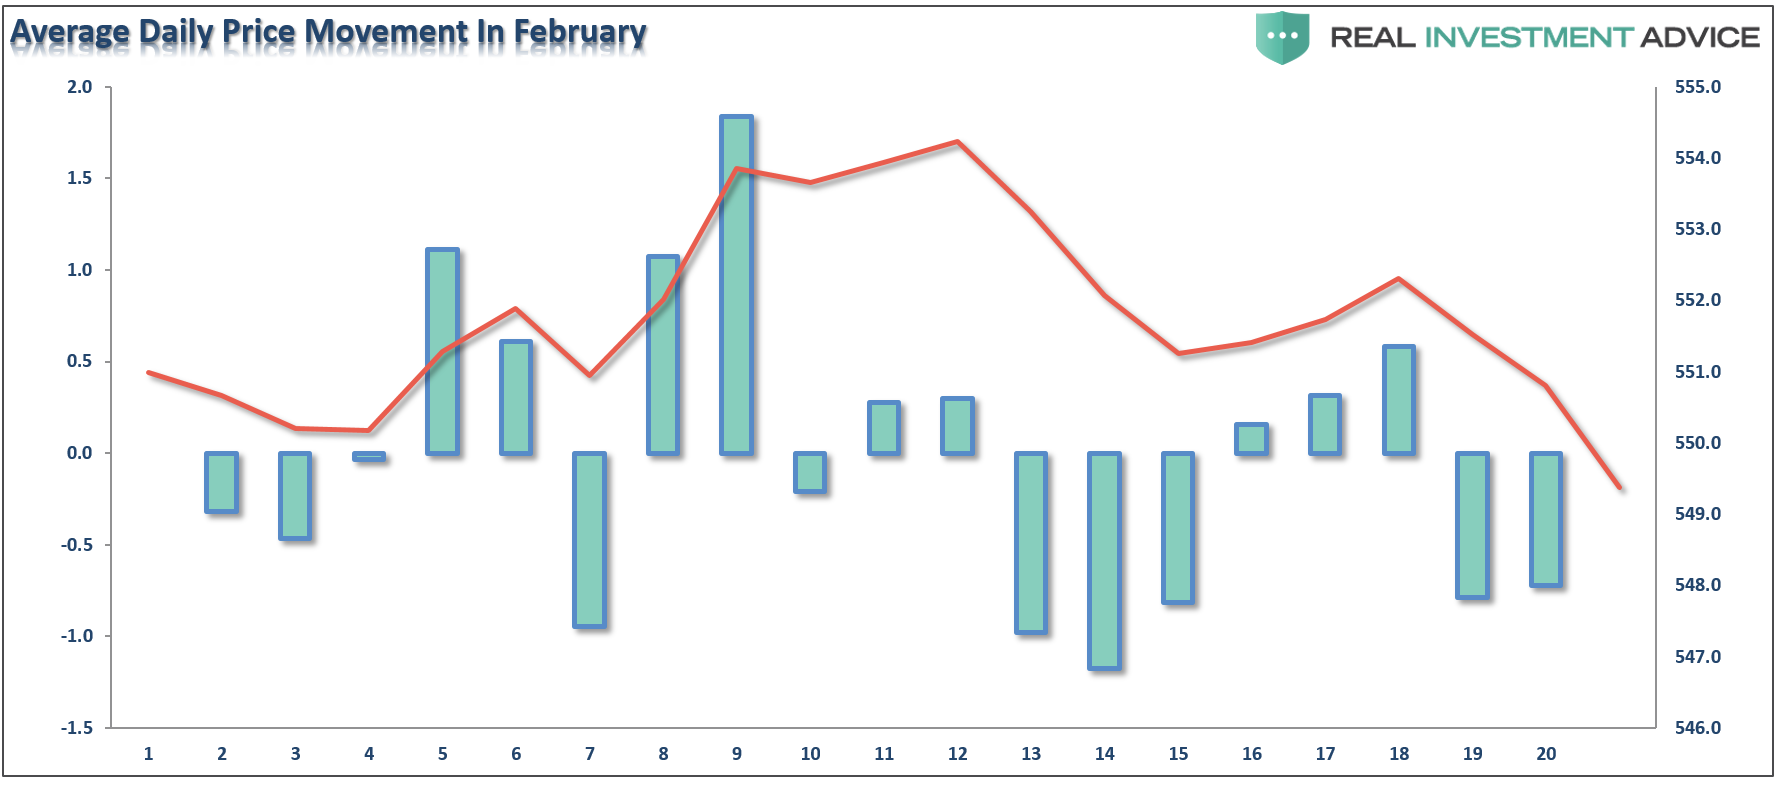
“However, a look at daily price movements during the month, on average, reveal the 4th trading day of February through the 12th day are the best opportunity we will likely have to rebalance portfolio allocations and reduce overall portfolio risk.“
As we enter into the statistically weak end of February, a bit of caution may be advisable. Particularly as noted by Mark Arbeter, CMT on Friday: "$SPX, $SPY getting sucked into the apex of the triangle."
However, for now, there is little argument the bulls remain in charge.
As I noted last week, there are plenty of bullish supports currently that warrant keeping portfolios exposed to equity risk currently:
- The bullish trend remains intact as noted by the red dashed line in the first chart above.
- The NYSE Advance/Decline remains bullish biased
- The number of stocks on bullish buy signals remains bullish
- The number of stocks above their 50 and 200 DMA’s is rising.
- Bullish confidence is high
- Volatility remains low
Of course, this current move reminds me much of the last stage of the previous bull market advance where we saw many of the same similarities.
Remain Long, But Remain Wary
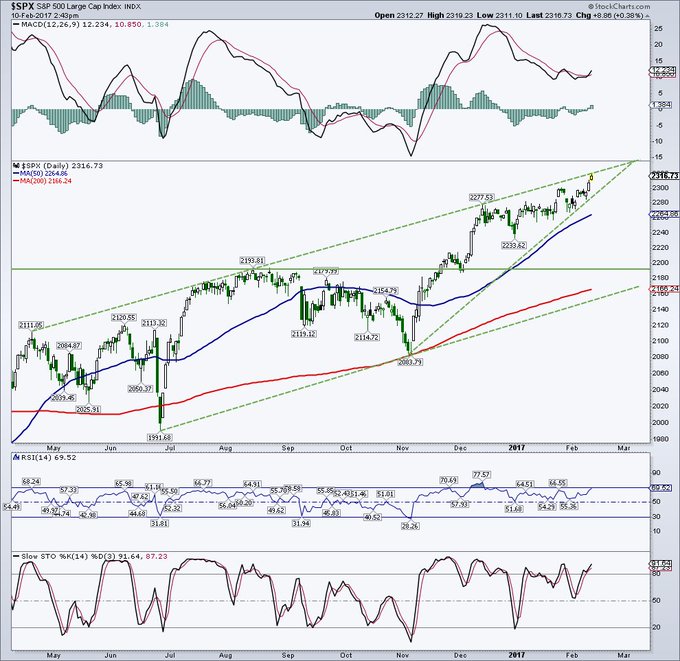
For now, portfolios remain fully invested as the bullish mantra persists. How long the current “buying stampede” lasts is anyone’s guess, but with the markets currently extremely deviated from their long-term averages, a correction of some degree should not be surprising.
One of the reasons I suspect we may be witnessing the final “melt-up” stage of the market is due to the rising global uncertainty regarding policy relative to the complacency in the financial markets. The chart below shows the Economic Policy Uncertainty Risk divided by the Volatility Index.
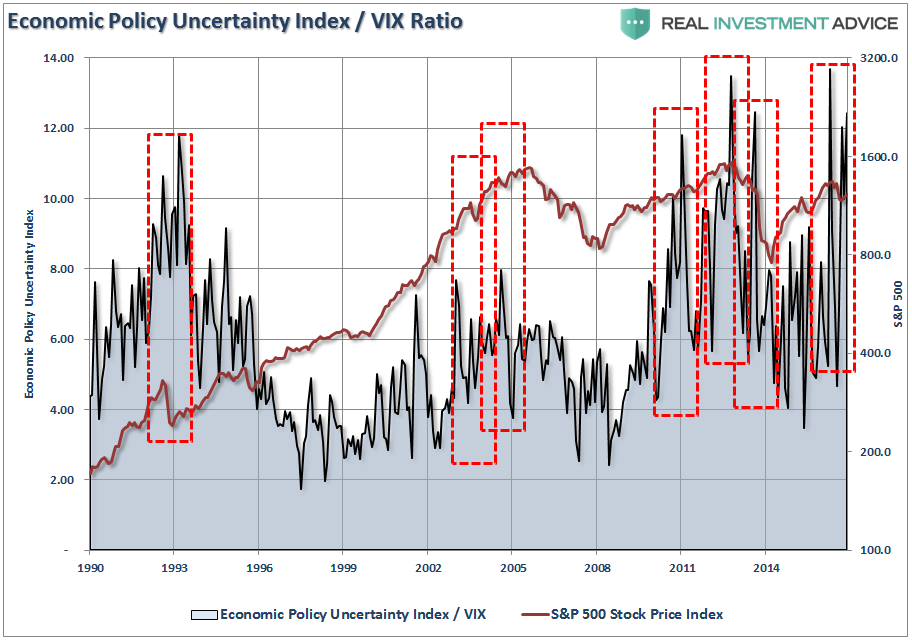
Each time these particular levels have been reached, it has been near the peak of the“exuberance phase” of a particular advance.
Of course, nothing says “exuberant” like the consumer confidence composite indicator which is currently registering its highest levels since 1999.
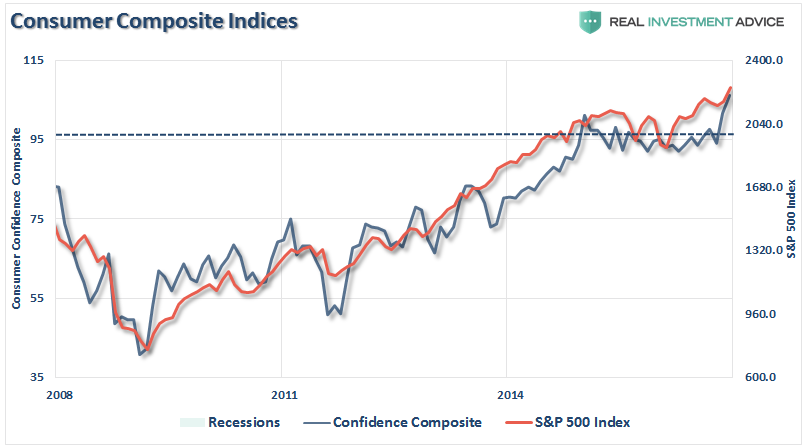
This chart simply confirms the all Street axiom that “Investors tend to buy the least at the bottom of the market, and the most at the tops.”
Of course, it is not just me saying that. As BlackRock’s CEO, Larry Fink, told Yahoo in an interview earlier this week:
“‘I see a lot of dark shadows. The markets are probably ahead of themselves.’
Fink, whose company manages $5.1 trillion in assets, said investors are caught up in the potential for a restructuring of U.S. tax policy, which may not take place until 2018.
But disruptions to trade are a possibility in the meantime, he said.
‘We’re living in a bipolar world right now. In my conversations with CEOs in Europe and CEOs in the United States, they may be very bullish about what may come but most business people are not investing today.”
That last point is something I noted on Thursday:
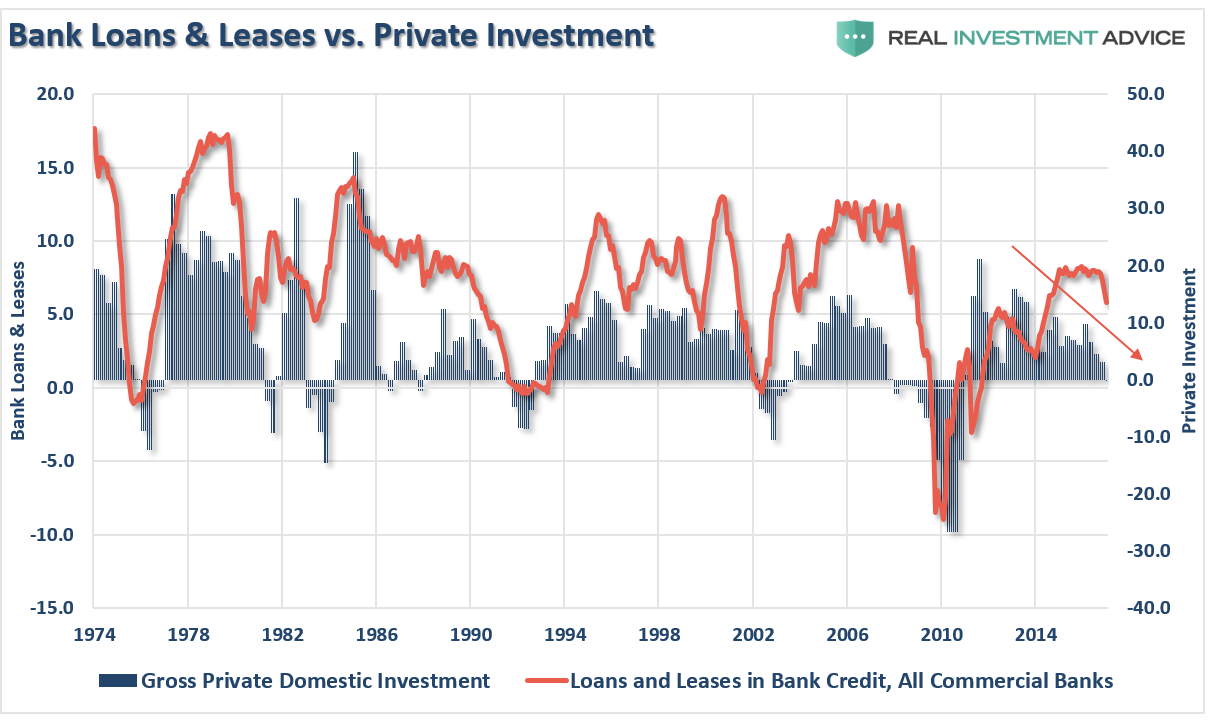
“Without the end demand from consumers to push companies to expand production, increase employment and raise prices, there is little impetus for companies to expend capital. The chart below shows the relationship between the extensions of loans and leases as it relates to private fixed investment. Despite hopes that companies would deploy borrowed capital into fixed investment to expand production leading to more job creation, this has not been the case. The ongoing decline in fixed investment continues to suggest an ongoing caution by business owners in deploying capital in productive manners but rather through leverage capital to increase productivity and financial engineering.”
And lastly, this note by Gavekal Capital certainly suggests the bull market remains intact currently, but should not be taken for granted.
“The Boom-Bust Barometer (made famous by Dr. Ed Yardeni) is a simple, but effective, way of avoiding large drawdowns in the stock market. This indicator is calculated by taking the CRB Raw Industrial Price Index divided by initial unemployment claims. The theory goes that if commodity prices are rising and unemployment claims are falling (thus the indicator is increasing), then economic activity is on sound footing. As you can see in the charts below, the indicator is currently making all-time highs. Additionally, you can see that the Boom-Bust Barometer has had a very high positive correlation to various stock indexes going all the way back to 1966 in some cases. When it is increasing as it currently is, it is very rare to see a major correction in stock prices.”

The problem with surging commodity prices is that it typically leads to an economic downturn, not necessarily a recession, that weighs on the outlook for stock prices. Given the recent surge in prices, and a likely inability to pass those increases along to consumers, a negative impact on the economy and earnings is certainly viable especially when combined with the effects of a stronger dollar.
But again, that is just what we are being wary of.
Portfolios remain long-biased, however, we have continued to maintain our hedges in interest rate sensitive investments to hedge portfolios in the event of a shift from “risk on”to “risk off” behavior by investors.
It will happen. Only a question of when.
Riddle Me This
When I was growing up I was a huge fan of the original Batman with Adam West. Yes, it was really bad acting and cheesy one-liners, but it was always fun to watch. As I was writing this missive, I received an email from a reader asking if this was a good time to put a 50% of his investible assets into the market.
It immediately reminded me of the Riddler when he would query Batman:

The chart below shows the difference between “dumb money,” aka retail investors and“smart money,” aka institutional investors.
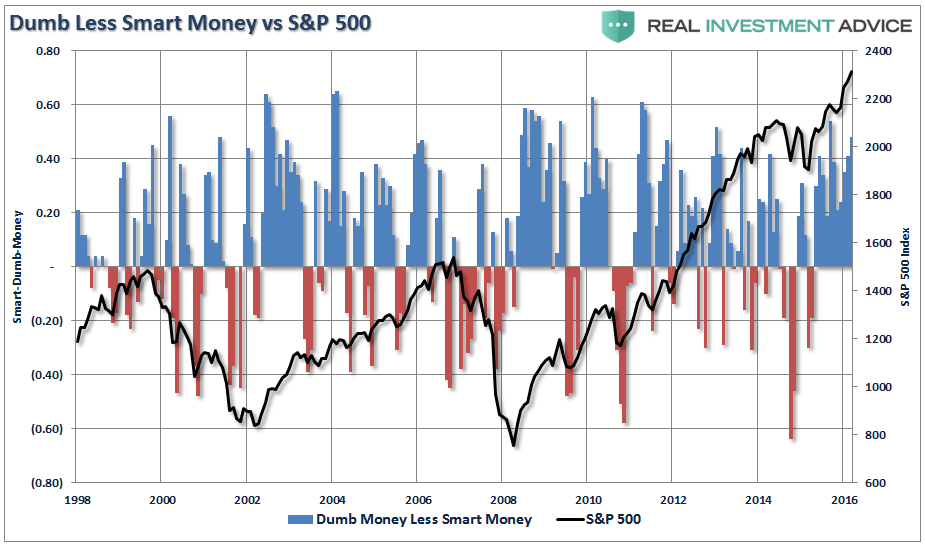
Historically, the “dumb money” has a tendency to answer the Riddler’s question incorrectly. Unfortunately, for individual investors, this triggers the release of the man-eating sharks as they are slowly lowered toward their doom.
In the series, this was the point where Robin would spout of one of his lines: “Holy Tuna Fish, Batman.”
But in order to find out if the daring duo would escape their watery fate, you would have to wait until next week and tune into the show. Of course, it was always at the “Same Bat Time And Same Bat Channel.”
With the markets pushing historic highs, volatility registering historic lows and deviations from long-term medians at extremes – exactly how are investors acting currently? Fearful or Greedy?
Riddle me that.
#PortfolioHedgesMatter
Market & Sector Analysis
Data Analysis Of The Market & Sectors For Traders
S&P 500 Tear Sheet
The “Tear Sheet” below is a “reference sheet” provide some historical context to markets, sectors, etc. and looking for deviations from historical extremes.
If you have any suggestions or additions you would like to see, send me an email.

Sector Analysis
The Rotation Becoming More Pronounced
Over the last couple of months, I have been discussing the coming rotation of the “risk on”versus the “risk off” sectors in the market. As I noted (with a video) at the beginning of the year, these rotations usually are early indicators of a “risk off” transition and provide opportunities for investors.
As you can see, that rotation has continued to accelerate over the last couple of weeks.
Portfolio Note: I have made two adjustments to the model below so it will align more closely with our actual portfolio allocations. I have swapped IDV for VEA and added VWO.
Due to the weight of our portfolio hedges in portfolios currently, we are using a position in IWM as a proxy for MDY and SLY.
Portfolios reside at our maximum portfolio equity weightings including hedges.

This rotation is still likely early in its movement. As noted previously, when the “Trump exuberance trade” reached its peak post-election, the rotation trade became very obvious. As noted at the beginning of this missive, from a historical viewpoint corrections in the month of February tend to amass towards the end of the month.
In other words, don’t let this week’s rally fool you. It is historically very well aligned with normal early February advances. The “risk off” trade is likely telling us something more important.
Last week, in response to Matt Drudge’s criticism of the GOP for not pushing tax reform through more quickly, President Trump responded by saying during an interview:
“Lowering the overall tax burden on American business is big league, that’s coming along very well. We’re way ahead of schedule, I believe. And we’re going to be announcing something — I would say over the next two or three weeks — that will be phenomenal.”
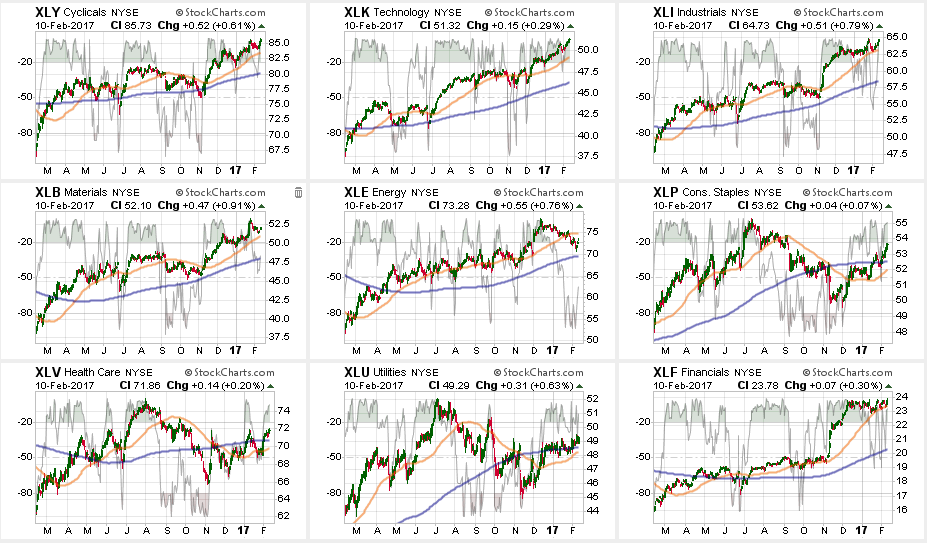
From a position view, the commitment of tax cuts sent the “Trump Trade” sensitive sectors higher.
Technology, Discretionary, Industrials, Staples, Utilities, Health Care and Financials pushed higher, but even despite a rise in oil prices, Energy weakened after breaking its 50-dma last week. Basic Materials lagged but held its ground.
Notably, watch Utilities as the 50-dma is heading back up suggesting a cross of the 50-200 dma is likely. The same goes for Staples and Healthcare.
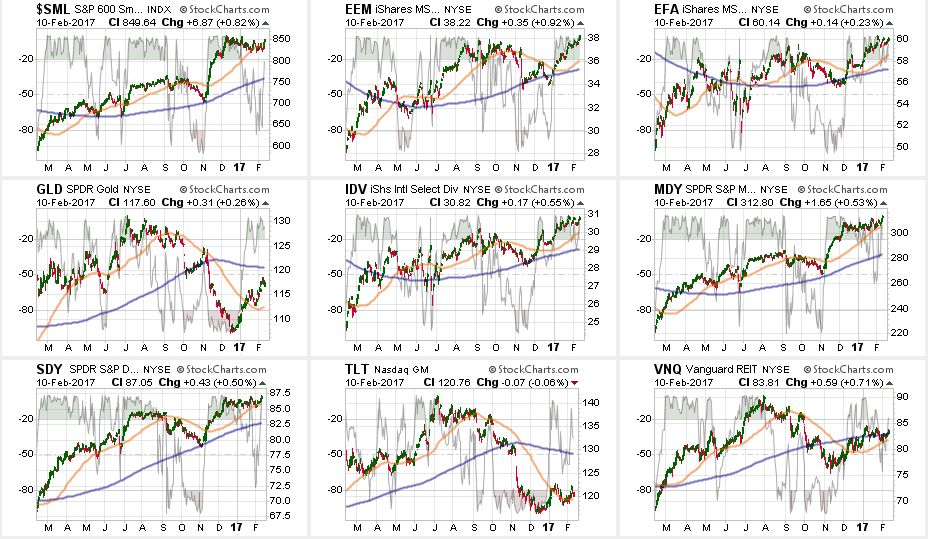
From the broader index positioning:
Small Caps, REIT’s, Mid Caps, Dividend Stocks and Bonds continue to flirt with their respective 50-dmas. Emerging and International markets got a lift from the weakening dollar which prompted an increase in International weightings in portfolios last week from a trading perspective.
Gold retested its 50-dma and bounced higher which is a technical improvement but remains locked in a long-term downtrend.
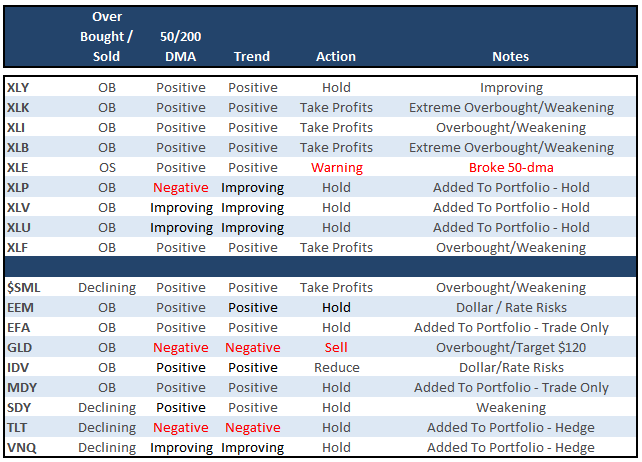
The table below shows thoughts on specific actions related to the current market environment.
(These are not recommendations or solicitations to take any action. This is for informational purposes only related to market extremes and contrarian positioning within portfolios. Use at your own risk and peril.)
Portfolio Update:
Nine weeks ago, as suggested, we hedged our long-equity positions with deeply out-of-favor sectors of the market (Bonds, REIT’s, Staples, Utilities, Health Care and Staples) which have continued to perform well in reducing overall portfolio volatility risk.
As noted last week, we added two new positions from a “Trading” perspective only: IWM – Russell 2000 and VEA – International
The short-term bullish trend and technical setup required an increase in equity risk in portfolios. However, all positions maintain very tight trailing stops as the mid to longer-term dynamics of the market continue to remain very unfavorable.
As I have been warning over the last couple of months, the stronger dollar and the rise in rates should not be dismissed.
Everything is currently pointing to this being a very late stage advance, so profit taking, hedging, and rebalancing remains strongly advised.
THE REAL 401k PLAN MANAGER
The Real 401k Plan Manager – A Conservative Strategy For Long-Term Investors
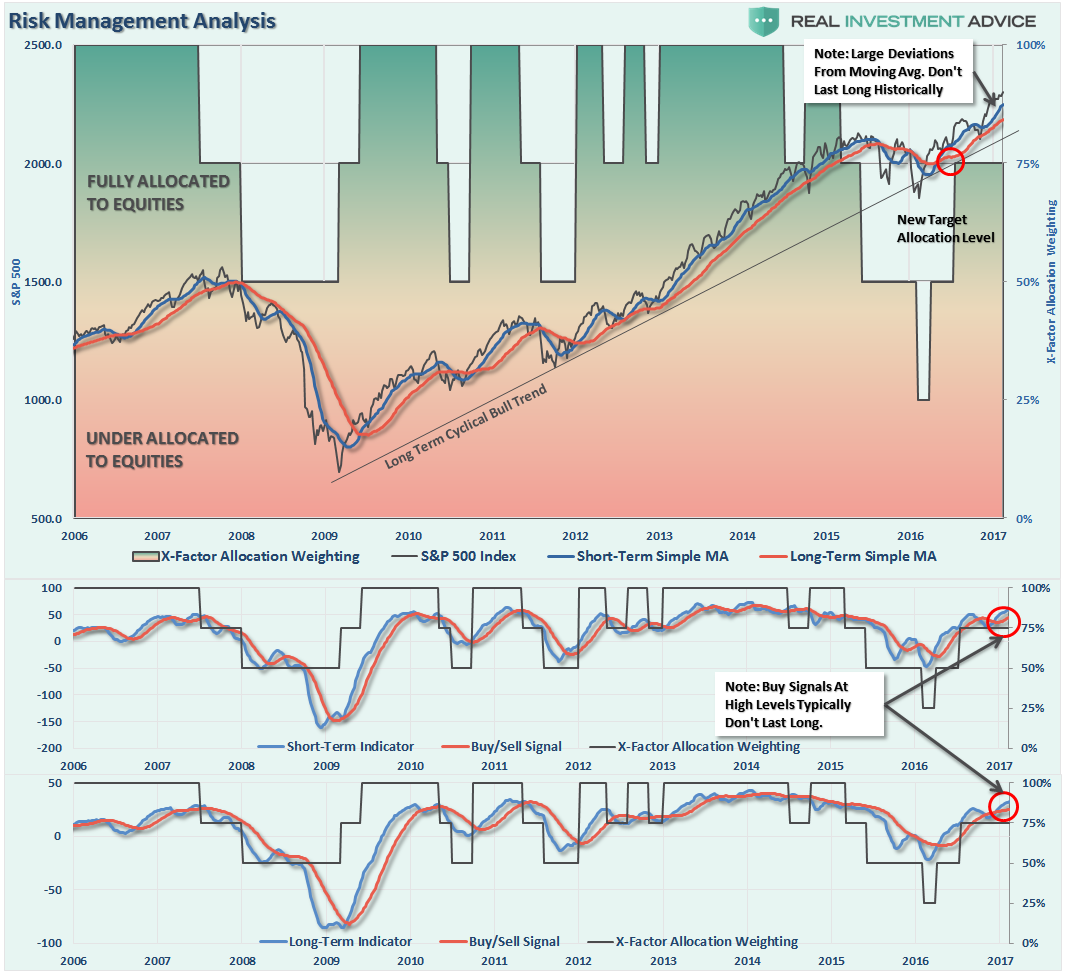
There are 4-steps to allocation changes based on 25% reduction increments. As noted in the chart above a 100% allocation level is equal to 60% stocks. I never advocate being 100% out of the market as it is far too difficult to reverse course when the market changes from a negative to a positive trend. Emotions keep us from taking the correct action.

Markets Hit Highs, Increase Allocations?
As I noted last week:
“While there really isn’t any ‘bad news’ to speak of, the extension of the market continues to remain extreme. A correction is needed to allow for an increase in 401k exposure for the remainder of the ‘seasonally strong’ period. As noted above, we are in the early stages of a ‘risk off’ rotation which suggests a mild correction is likely in store during February.
With buy signals on all three indicators registered currently, any corrections are likely to be somewhat limited back to the rising short to intermediate-term moving averages.”
While, in retrospect, I should have increased the 401k model allocation to 100% at the beginning of the year, the risk/reward setup for an incremental increase in exposure simply has not been justifiable given the limitations that exist in 401k plans as it relates to trading limitations.
A correction back to short-term supports around 2200-2250 on the S&P 500 would likely be a “buyable” trading level. As noted in the chart above, the current extension above the moving average will likely be corrected sooner rather than later. Such a correction will relieve some of the extreme overbought conditions that currently exist and allow for additional risk exposure in portfolios if needed.
I continue to suggest using this current extension to as an opportunity to clean up portfolios. (Use guidelines noted previously.)
- Tighten up stop-loss levels to current support levels for each position.
- Hedge portfolios against major market declines.
- Take profits in positions that have been big winners
- Sell laggards and losers
- Raise cash and rebalance portfolios to target weightings.
If we can get a correction that resolves the overbought, extended and excessively bullish backdrop to the markets currently, I WILL increase the allocation model to 100%. For now, we will wait and let the markets tell us what it wants to do next.
If you need help after reading the alert; don’t hesitate to contact me.
Current 401-k Allocation Model
The 401k plan allocation plan below follows the K.I.S.S. principal. By keeping the allocation extremely simplified it allows for better control of the allocation and a closer tracking to the benchmark objective over time. (If you want to make it more complicated you can, however, statistics show that simply adding more funds does not increase performance to any great degree.)

401k Choice Matching List
The list below shows sample 401k plan funds for each major category. In reality, the majority of funds all track their indices fairly closely. Therefore, if you don’t see your exact fund listed, look for a fund that is similar in nature.

Disclosure: The information contained in this article should not be construed as financial or investment advice on any subject matter. Streettalk Advisors, LLC expressly disclaims all liability in ...
more


thanks for sharing