August – The Bigger Picture

We often we concentrate on U.S. indexes and Treasuries and miss the bigger picture. Here are some interesting charts to remind us of the current state of the market.
Keep in mind that unlike equities, forex and commodity prices do have a strong impact on the real economy and imbalances are hard to bear by the respective economies.
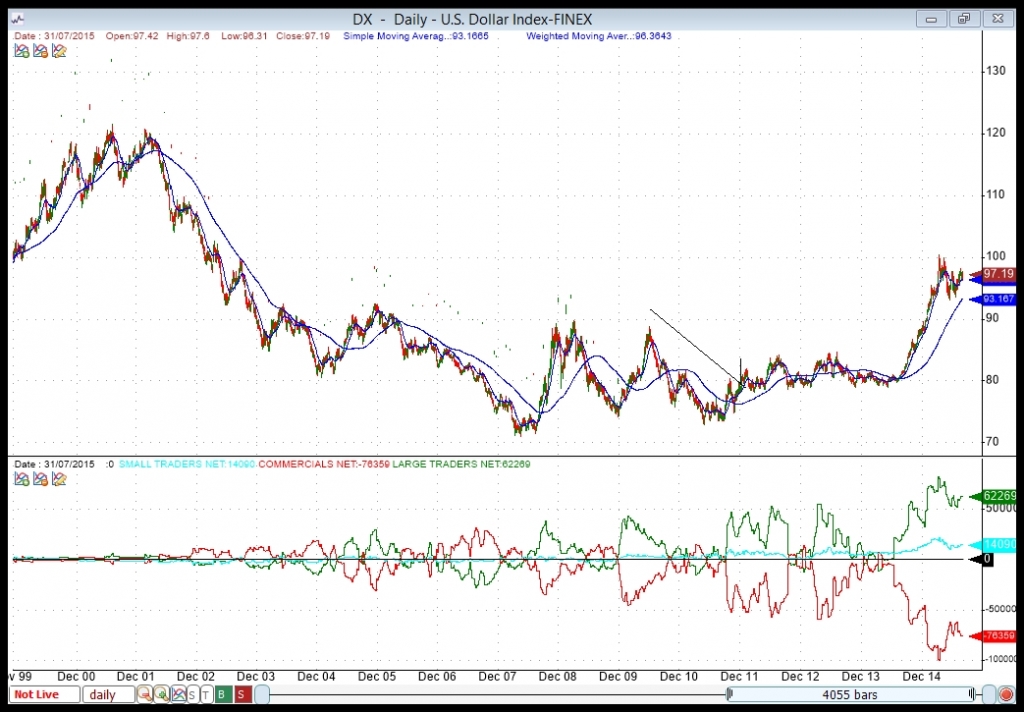
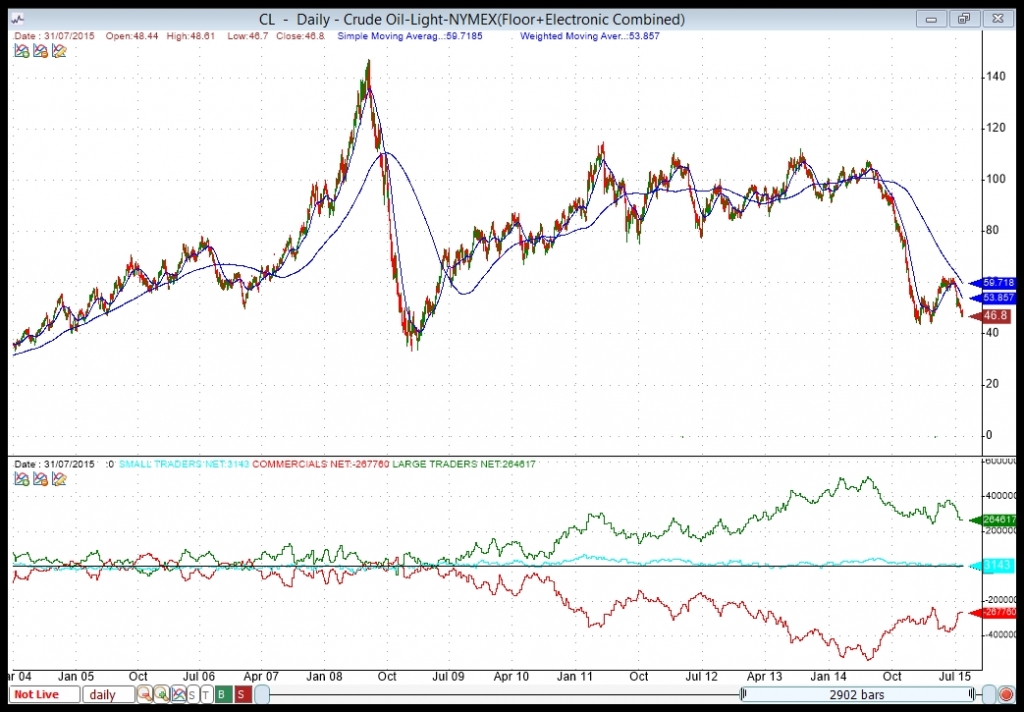
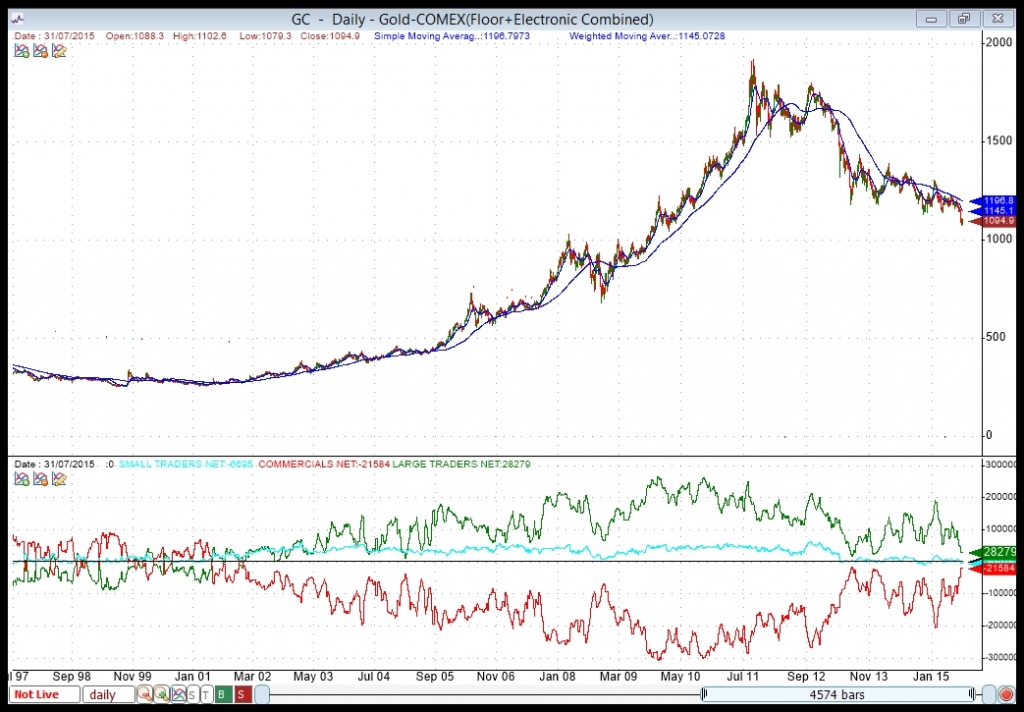
The bottom pane shows Commitment of Traders (COT) data. Here is a bit of info on the COT.
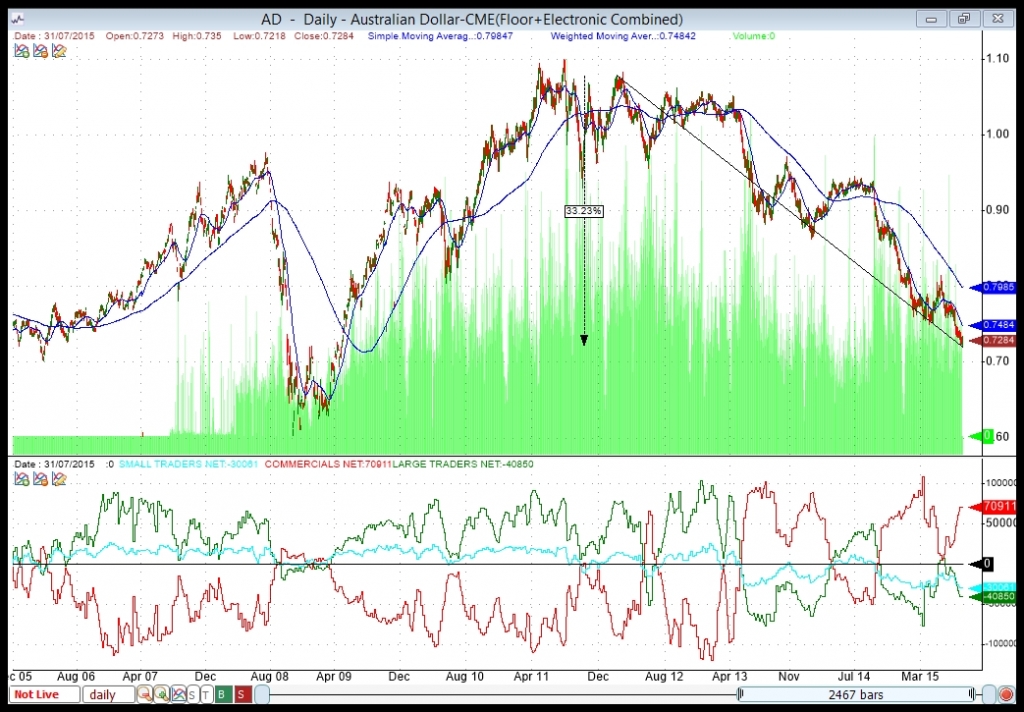
1. The Australian Dollar – Not too far from ’09 crisis levels at -35% from peak.
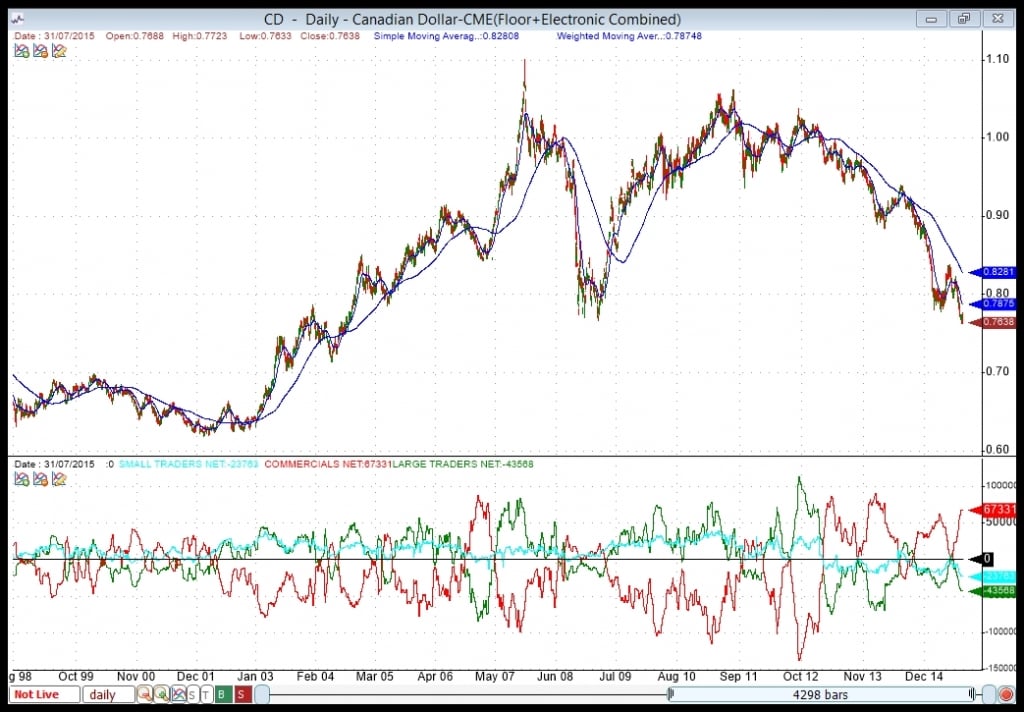
2. Canadian Dollar – Below ’09 levels due to Crude collapsing.
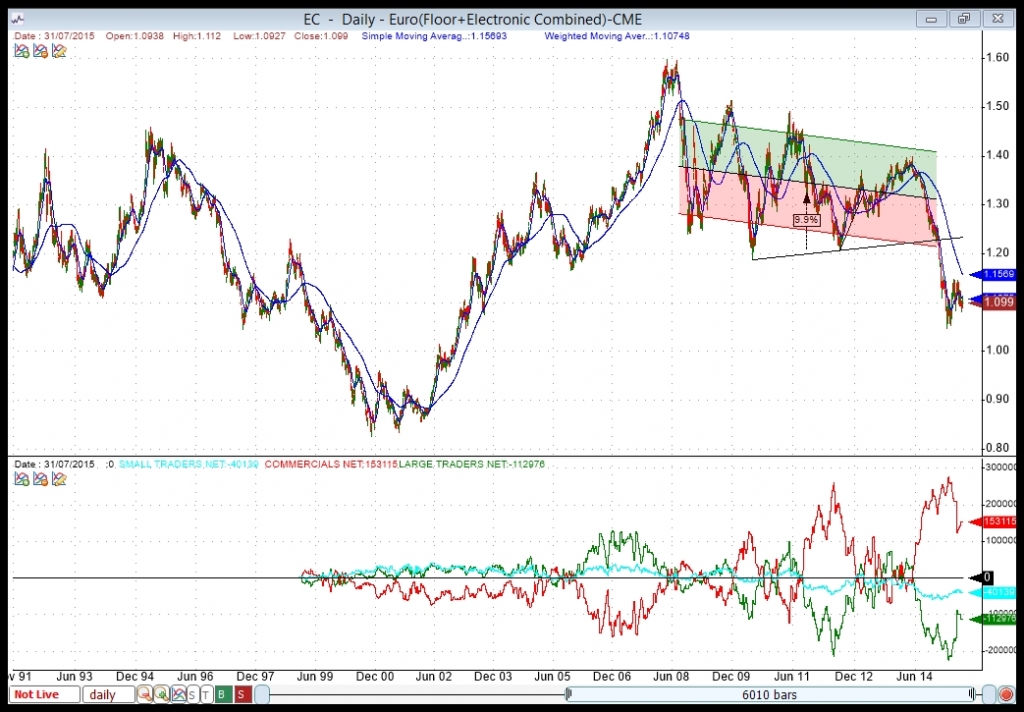
3. The Euro – Massive QE, Grexit, etc.
4. The Dollar Index – Above ’09 crisis levels.
5. Oil – Who would have guessed this… Below $50 while no visible crisis in sight…
6. Gold – Like most commodities on a downtrend with no hint of being used as a safe-heaven.
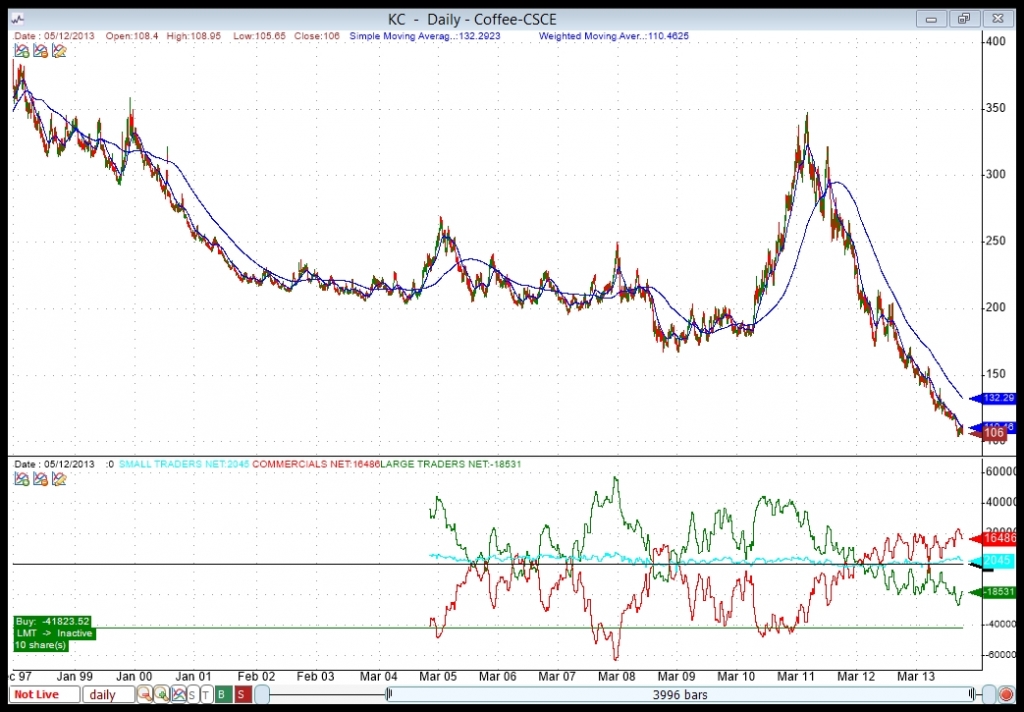
7. Coffee – Just an example of commodity extreme pricing.