
Commitment Of Traders This Week: Futures, Hedge Fund Positions
Following futures positions of non-commercials are as of October 30, 2018.
10-year note: Currently net short 502.8k, down 41.2k.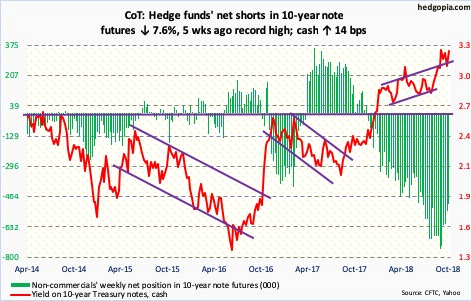
The 10-year Treasury rate continues to trade in a no-man’s land. Sort of. On October 5, it began retreating after touching 3.25 percent. That was the highest since May 2011. Then by the 26th, it was down to 3.06 percent, before bond bears showed up just under the daily lower Bollinger band.
Yields ended the week at 3.21 percent, up seven basis points Friday in reaction to October’s jobs report, which showed average hourly earnings rose 3.1 percent year-over-year in October, the first time wages grew with a three handle since April 2009. On the 10-year, short-term support lies at 3.11 percent. This level also approximates the upper bound of a multi-year rising wedge. The lower bound lies near three percent.
Non-commercials obviously hope yields continue higher, and are positioned accordingly. Over the past several weeks, they have cut back net shorts in 10-year notes, but holdings remain massive. Currently, the 10-year hovers near the upper bound, but a wedge breakdown at some point in the future exposes them to the risk of a squeeze.
30-year bond: Currently net short 82k, down 5.8k.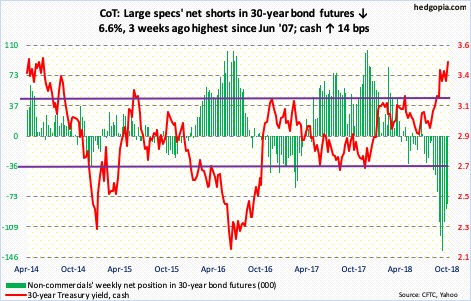
Major economic releases next week are as follows.
The ISM non-manufacturing index for October is due out Monday. Services activity in September jumped 3.1 points month-over-month to 61.6, which is the highest ever, although data only goes back to January 2008.
September’s JOLTS is scheduled for Tuesday. In August, non-farm job openings rose 59,000 m/m to 7.14 million – a new record.
Also Tuesday, mid-term elections are held.
Wednesday, the FOMC meets; the meeting concludes the next day. No hike is expected. The fed funds rate went up 25 basis points in September, to a range of 200 to 225 basis points. Markets expect a raise in December (18-19), with futures pricing in 79-percent probability.
Friday brings core PPI (October) and University of Michigan’s consumer sentiment index (November, preliminary).
Producer prices rose 0.2 percent m/m in September and 2.6 percent in the 12 months to September. Core PPI increased 0.4 percent and 2.9 percent in the 12 months through September.
Consumer sentiment dropped 1.5 points m/m in October to 98.6. March’s 101.4 was the highest since 103.8 in January 2004.
Crude oil: Currently net long 504.3k, down 6.3k.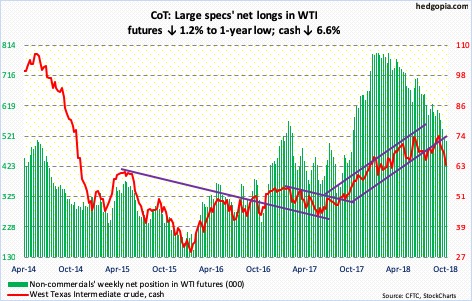
Spot West Texas Intermediate crude ($63.14/barrel) continued lower this week, with weekly overbought conditions dominating action. The daily chart remains grossly oversold, with the daily RSI sub-30 for the first time since June 2017. Last week, bulls unsuccessfully tried to defend the 200-day moving average. This week’s 6.6-percent drop places the crude 6.8 percent away from that average. This will act as resistance for sure. Not to mention broken-support-turned resistance at $64-plus before that. Worse, a trend line from February 2016, when the crude bottomed at $26.05, gets tested around $59.
The EIA report for the week of October 26 was a mixed bag, but bulls likely focused on crude stocks, which rose another 3.2 million barrels to 426 million barrels. Since mid-September, crude stocks have gone up 31.9 million barrels. Crude production rose too, up 300,000 barrels/day to 11.2 million b/d. Crude imports, however, fell 334,000 b/d to 7.3 mb/d. Gasoline and distillate stocks dropped 3.2 million barrels and 4.1 million barrels respectively to 226.2 million barrels and 126.3 million barrels. Refinery utilization rose two-tenths of a point to 89.4 percent.
E-mini S&P 500: Currently net long 263k, up 23.6k.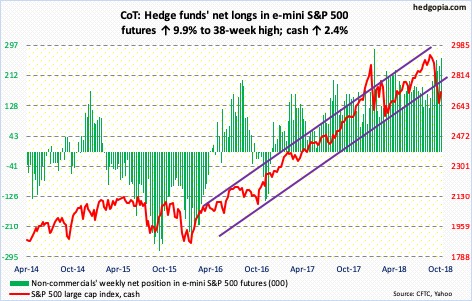
After signs of a real bull-bear tussle in the latter part of last week, the cash (2723.06) rallied 2.4 percent this week. Thursday, bulls stepped up intraday near the 10-day, and again on Friday. Nearest resistance lies at the 200-day (2764.66), which was just about tested Friday. Then comes the crucial 2800, which already resisted rally attempts on the 17th last month. This level also approximates the underside of a broken rising trend line from February 2016. Takeout of this resistance – or a lack thereof – will decide how much of the damage wrought on the S&P 500 during last month’s rout gets repaired.
Bulls obviously put foot down this week. Failure to recapture the 200-day as soon as possible raises the odds of a retest of this week’s lows.
In the week to Wednesday, flows were in cooperation. US-based equity funds (including ETF’s) gained $2.4 billion (courtesy of Lipper.com). SPY (SPDR S&P 500 ETF) and IVV (iShares core S&P 500 ETF) each took in $2.8 billion, and VOO (Vanguard S&P 500 ETF) $340 million (courtesy of ETF.com).
Euro: Currently net short 32.7k, up 2.4k.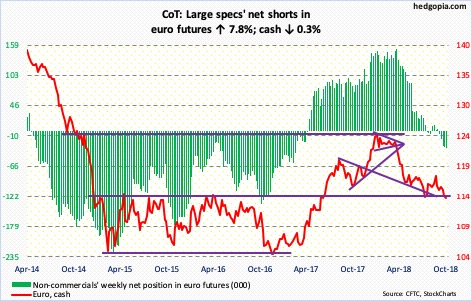
Mid-August, after having dropped all the way from $125.37 in June, the cash ($113.88) bottomed at $113.01, with a bullish weekly hammer. This week, bulls defended that low, with a weekly spinning top. In fact, bulls also showed up at the $113 level in the prior couple of weeks. This is an opportunity for them. There is room for the daily in particular to unwind oversold condition. Major resistance lies at $115-plus.
Gold: Currently net long 13.2k, down 16.2k.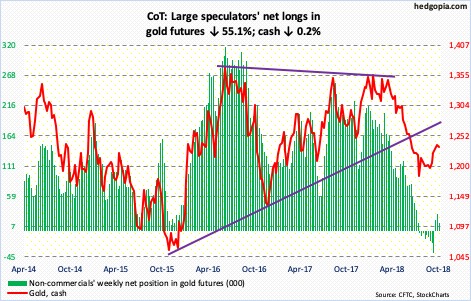
It is as if gold bugs were waiting for this opportunity. After getting denied several times at $1,240-ish since mid-October, the cash ($1,233.30/ounce) came under pressure early this week, to an intraday low of $1,213.40. Support just north of $1,200 goes back several years. More specifically, $1,213-ish has proven to be an important level for over three months now, which was defended Wednesday. The next hurdle lies at the aforementioned $1,240-ish, which needs to give way for continued momentum.
Perhaps encouragingly for bulls, GLD (SPDR gold ETF) continued to attract funds. In the week to Wednesday, it gained $175 million, for a total of $937 million in the past four (courtesy of ETF.com).
Nasdaq 100 index (mini): Currently net long 10.2k, up 966.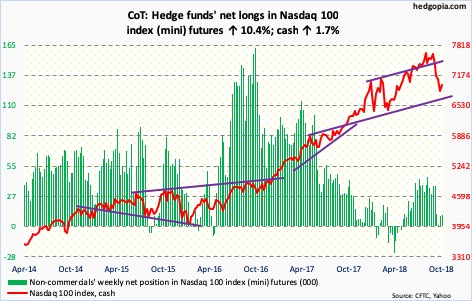
In the week through Wednesday, which includes Monday’s intraday drop to 6574.75 on the cash (6965.29), QQQ (Invesco QQQ Trust) attracted $875 million (courtesy of ETF.com). In the subsequent sessions, the Nasdaq 100 rallied enough to go test the 200-day. A rally past this opens the door to a test of 7300.
On the weekly, there is room for continued rally. On the daily, several momentum indicators are right at the median. If momentum were to weaken, it can happen right here. Apple (AAPL)’s September-quarter results were not perceived well, and caused the Nasdaq 100 to pull back 1.5 percent Friday, with intraday rejection at the 200-day. Following Wednesday’s gap-up, near-term support lies at 6930.
Russell 2000 mini-index: Currently net short 33k, down 48.7k.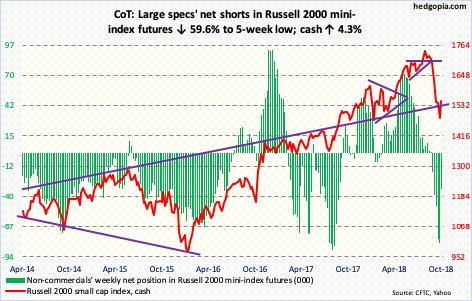
The cash (1547.98) took quite an assault last month, down 16.2 percent from intraday high of August 31 to the low of October 26. On the monthly, last month’s candle has an ominous look to it. The weekly paints a different picture. In the last couple of weeks, 16-month support at 1450-ish held. Although this comes after loss of one after another support, including a rising trend line from February 2016 and major horizontal support at 1610-ish. Ideally, small-cap bulls would like to go test that support. The 200-day (1617.26) lies there as well. So does the underside of that broken trend line.
Flows need improvement. In the week ended Wednesday, IWM (iShares Russell 2000 ETF) lost $65 million, while IJR (iShares core S&P small-cap ETF) took in $73 million (courtesy of ETF.com). Another positive sign would be if non-commercials begin covering their net shorts, which they did this week.
US Dollar Index: Currently net long 39.5k, up 1.5k.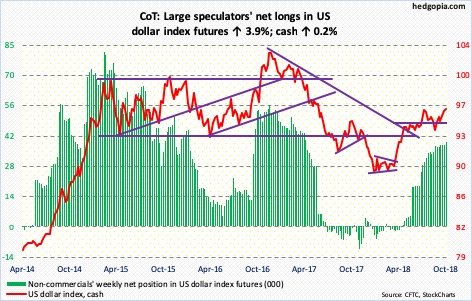
Mid-August, the cash (96.34) rose to an intraday high of 96.86 before reversing lower, with a weekly shooting star. It ultimately bottomed at 93.39 on September 21. Wednesday, the US dollar index tested that high, rallying to 96.98 intraday. Thursday, it cratered 0.9 percent, with a weekly spinning top. The daily has plenty of room to continue lower. The 50-day lies at 95.10. This also approximates support at 95-plus.
VIX: Currently net long 2k, up 12.3k.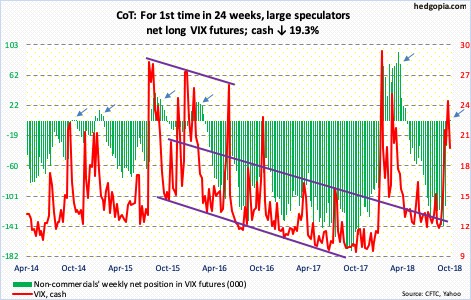
Premium is coming out of elevated shorter-term volatility. In due course, the VXST-VIX-VXV-VXMT volatility curve, which is in backwardation, should give way to contango. As this happens, the cash (19.51) comes under pressure.
This week, non-commercials switched to net long VIX futures. In the past, this has coincided with a peak in the cash.
Concurrently, the VIX-to-VXV ratio ended the week at 0.961, down from 1.075 last week. It can continue lower. That is also the case with the 21-day moving average of the CBOE equity-only put-to-call ratio, which ended Friday at 0.681. Thursday’s 0.684 was the highest since August 2017. Several times in the past, the ratio has retreated from high-0.60s to low-0.70s. As this happens, investors tend to gravitate toward risk-on.
Disclaimer: This article is not intended to be, nor shall it be construed as, investment advice. Neither the information nor any opinion expressed here constitutes an offer to buy or sell any ...
more

