
Yellen Speaks Japanese
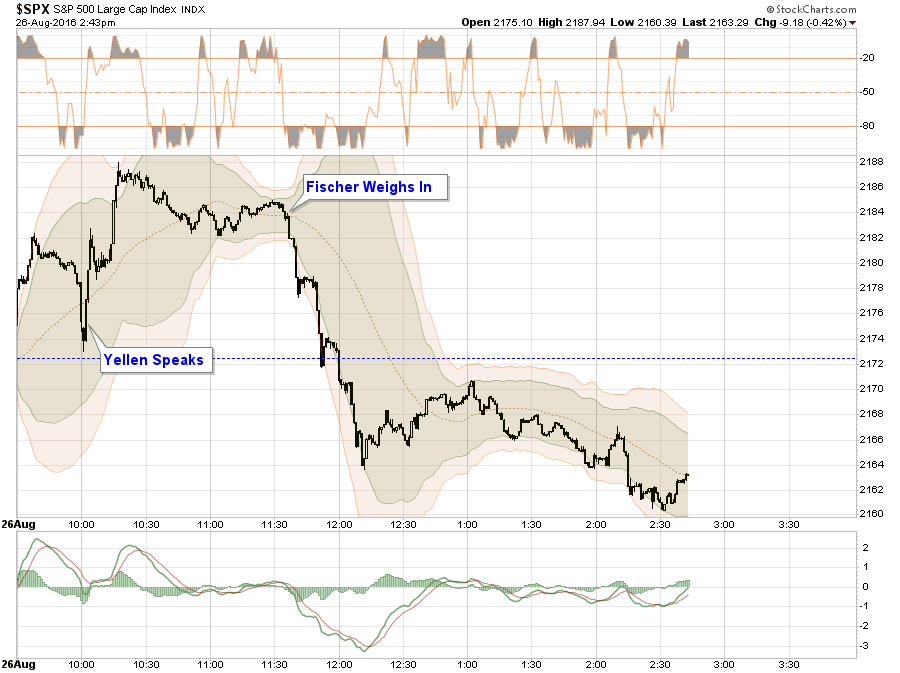
As Yellen spoke on Friday, the markets surged back into the trading range that we have been locked into for the past few weeks. Despite GDP being revised lower and economic data continuing to remain weak, the hopes for a strengthening economic recovery from the Fed remain. Here are Yellen’s key points:
- YELLEN SAYS RATE-HIKE CASE `HAS STRENGTHENED IN RECENT MONTHS’
- YELLEN SAYS ECONOMY NEARING FED’S EMPLOYMENT, INFLATION GOALS
- YELLEN: FOMC NOT ACTIVELY CONSIDERING ADDITIONAL TOOLS
- YELLEN SAYS GROWTH NOT RAPID BUT ENOUGH TO IMPROVE LABOR MKT
On those headlines, the market rallied as the expectations for a September rate hike dissolved.
Remember, raising the Fed Funds rate is a tightening of monetary policy which withdraws liquidity from the financial markets. With fundamentals and economics weak, the only supportive argument for higher asset prices, and for “yield chasers” paying 3.5x sales for a 2.5% dividend, is continued accommodative policy.
But it was this statement that sent the markets surging higher:
“On the monetary policy side, future policymakers might choose to consider some additional tools that have been employed by other central banks, though adding them to our toolkit would require a very careful weighing of costs and benefits and, in some cases, could require legislation. For example, future policymakers may wish to explore the possibility of purchasing a broader range of assets.”
This, of course, dovetails with my article from Thursday discussing the recent Fed research paper on the possibility of another $4 Trillion in QE to offset the next recession. To wit:
“David Reifschneider, deputy director of the division of research and statistics for the Federal Reserve board in Washington, D.C., released a staff working paper entitled ‘Gauging The Ability Of The FOMC To Respond To Future Recessions.‘
The conclusion was simply this:
‘Simulations of the FRB/US model of a severe recession suggest that large-scale asset purchases and forward guidance about the future path of the federal funds rate should be able to provide enough additional accommodation to fully compensate for a more limited [ability] to cut short-term interest rates in most, but probably not all, circumstances.’
In other words, the Federal Reserve is rapidly becoming aware they have become caught in a liquidity trap keeping them unable to raise interest rates sufficiently to reload that particular policy tool. As I have discussed in recent weeks, and below, there are an ever growing number of indications the U.S. economy is currently headed towards the next recession.
He compares three policy approaches to offset the next recession.
- Fed funds goes into negative territory but there is no breakdown in the structure of economic relationships.
- Fed funds returns to zero and keeps it there long enough for unemployment to return to baseline.
- Fed funds returns to zero and the FOMC augments it with additional $2-4 Trillion of QE and forward guidance.
In other words, the Fed is already factoring in a scenario in which a shock to the economy leads to additional QE of either $2 trillion, or in a worst case scenario, $4 trillion, effectively doubling the current size of the Fed’s balance sheet.
Here is the problem with the entire analysis. It assumes a normalized economic environment in which the Federal Reserve has several years before the next recession AND that large-scale asset purchases actually create economic growth.Both are likely faulty conclusions.”
Unfortunately, the post-Yellen speech push higher in stocks was quickly reversed when the Federal Reserve’s own Stan Fischer clarified the situation:
- FISCHER: I DON’T THINK FED IS BEHIND THE CURVE
- FISCHER: YELLEN’S COMMENTS CONSISTENT WITH POSSIBLE SEPT. HIKE
- FISCHER: ON EMPLOYMENT, WE’RE DOING WELL
- FISCHER: NOT TOO CONCERNED ABOUT ASSET BUBBLES NOW
So, just as quickly as the rally came, it went away as the specter of a September rate hike weighed on the market.
In a nutshell, the best summation of Yellen’s speech came from Macquarie’s Thierry Wizman who simply said:
“Yellen’s speech was a whole lot of nothing.” – h/t Zerohedge
Let’s Be Like Japan
But let’s revisit Ms. Yellen’s comments for a moment. As noted, she made two very interesting points. The first was the call for more “fiscal” policy out of Government. This is essentially a call for more government spending. ($19 Trillion In Debt Is A Problem)

Clearly, more expansive government spending, represented in the chart above by the surge in Federal Debt, is having no substantial impact to economic growth. As I have written previously, debt is a retardant to organic economic growth as it diverts dollars from productive investment to debt service.
The second, and most important, was the suggestion of expanding monetary policy programs to include other assets.
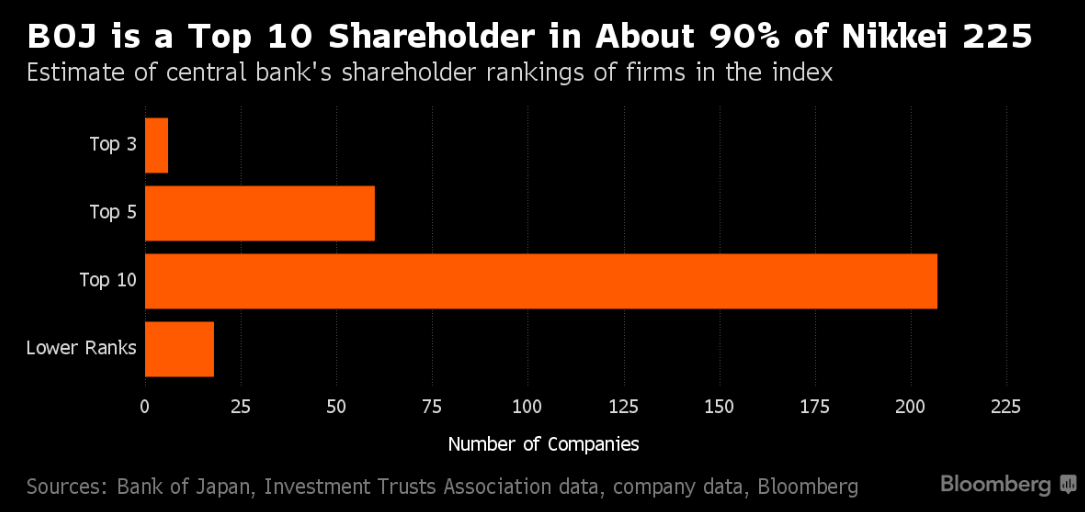
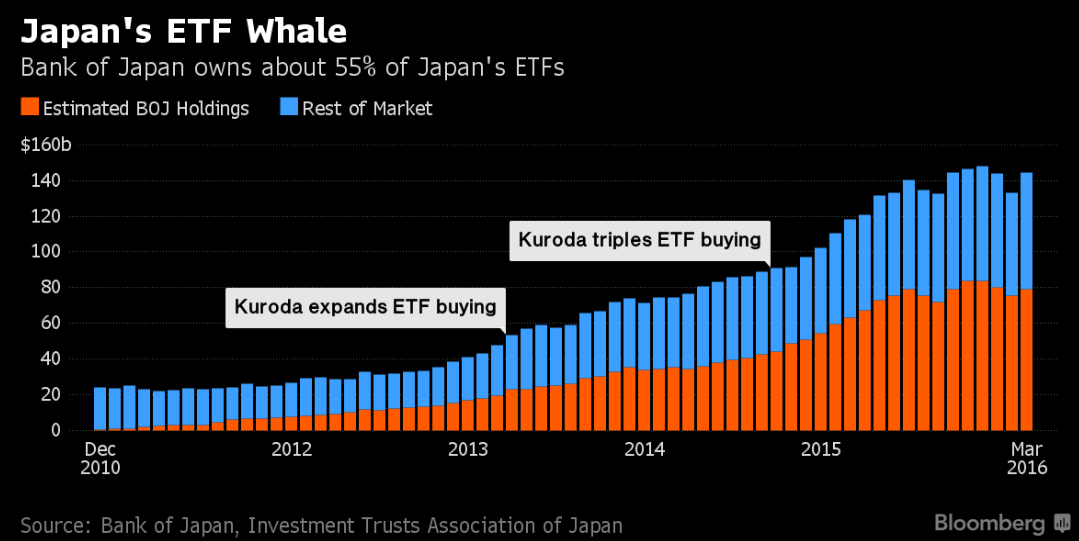
Japan has been doing this for the last couple of years and, according to Bloomberg, has now accumulated a majority of the Nikkei 225 and about 55% of Japan’s ETF’s.
“While the Bank of Japan’s name is nowhere to be found in regulatory filings on major stock investors, the monetary authority’s exchange-traded fund purchases have made it a top 10 shareholder in about 90 percent of the Nikkei 225 Stock Average, according to estimates compiled by Bloomberg from public data.”
But, that spending has done little for the realization of success in Japan economically. Take a look at the chart below which shows the expansion of the BOJ assets versus growth of GDP and levels of interest rates.
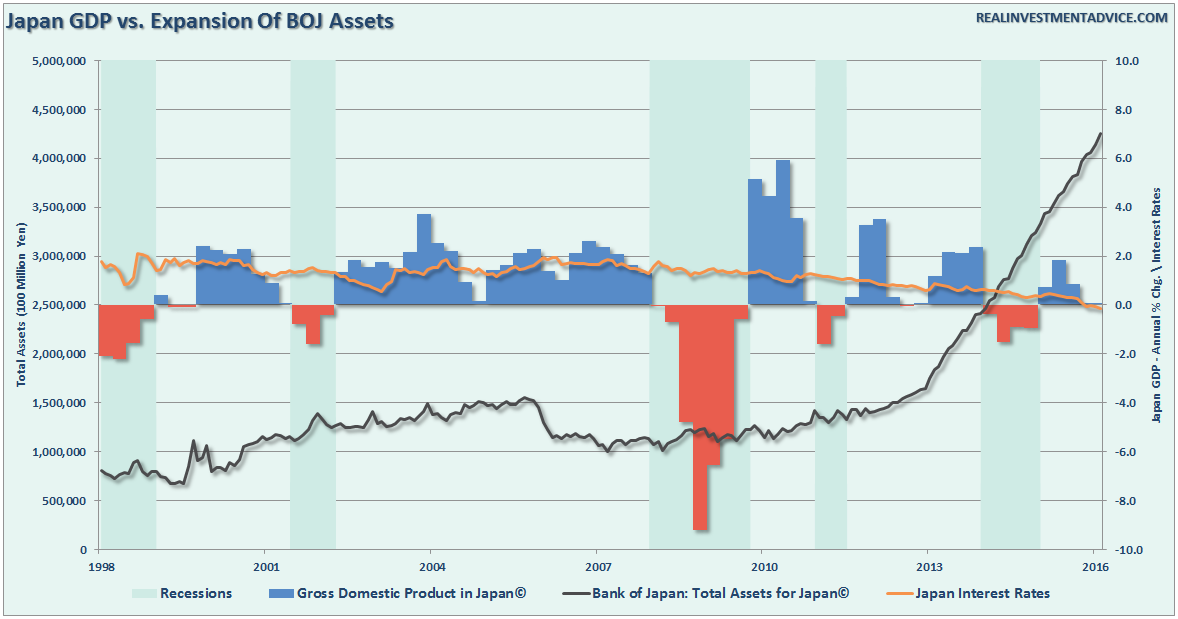
With interest rates now pushing into negative territory and economic growth near zero, there is little evidence to support the idea that inflating asset prices by buying assets leads to stronger economic outcomes.
Yellen has become caught in the same liquidity trap as Japan. With the current economic recovery already pushing the long end of the economic cycle, the risk is rising that the next economic downturn is closer than not. The danger is that the Federal Reserve is now potentially trapped with an inability to use monetary policy tools to offset the next economic decline when it occurs.
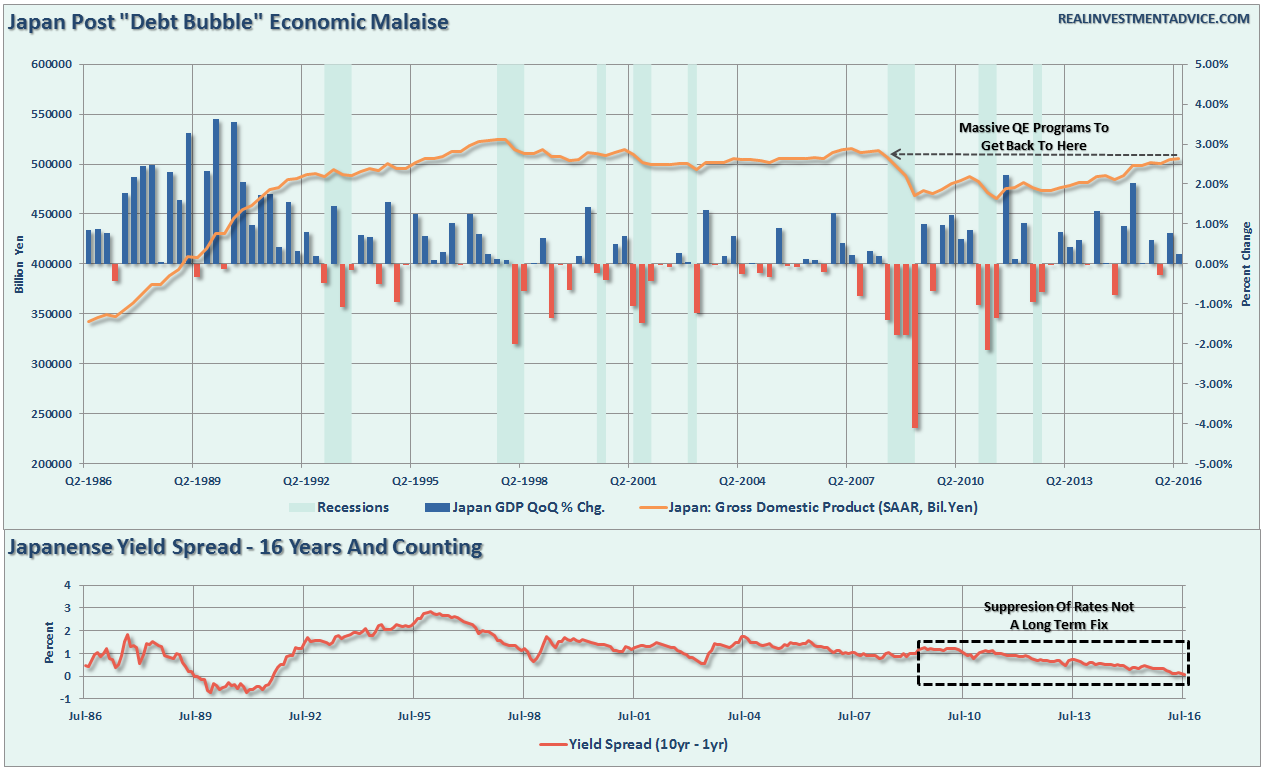
This is the same problem that Japan has wrestled with for the last 20 years. While Japan has entered into an unprecedented stimulus program (on a relative basis twice as large as the U.S. on an economy 1/3 the size) there is no guarantee that such a program will result in the desired effect of pulling the Japanese economy out of its 30-year deflationary cycle. The problems that face Japan are similar to what we are currently witnessing in the U.S.:
- A decline in savings rates to extremely low levels which depletes productive investments
- An aging demographic that is top heavy and drawing on social benefits at an advancing rate.
- A heavily indebted economy with debt/GDP ratios above 100%.
- A decline in exports due to a weak global economic environment.
- Slowing domestic economic growth rates.
- An underemployed younger demographic.
- An inelastic supply-demand curve
- Weak industrial production
- Dependence on productivity increases to offset reduced employment
The lynchpin to Japan, and the U.S., remains interest rates. If interest rates rise sharply it is effectively “game over” as borrowing costs surge, deficits balloon, housing falls, revenues weaken and consumer demand wanes. It is the worst thing that can happen to an economy that is currently remaining on life support.
Japan, like the U.S., is caught in an on-going “liquidity trap” where maintaining ultra-low interest rates are the key to sustaining an economic pulse. The unintended consequence of such actions, as we are witnessing in the U.S. currently, is the ongoing battle with deflationary pressures. The lower interest rates go – the less economic return that can be generated. An ultra-low interest rate environment, contrary to mainstream thought, has a negative impact on making productive investments and risk begins to outweigh the potential return.
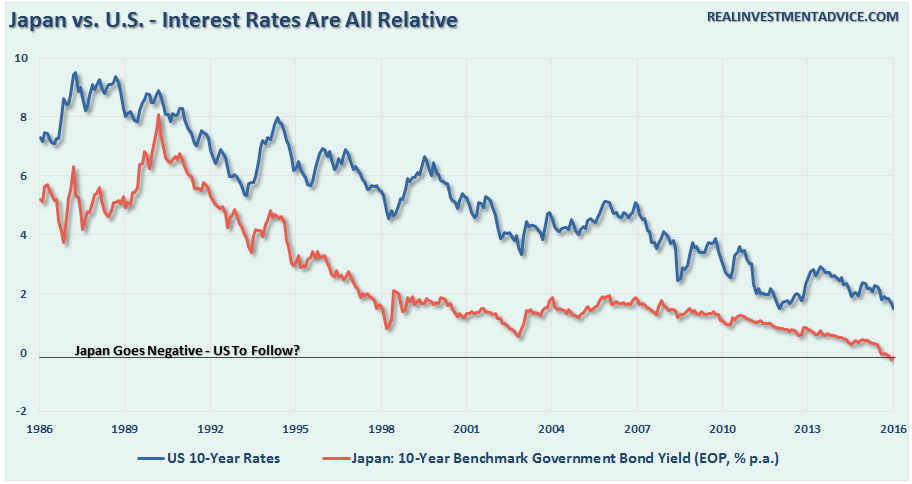
More importantly, while there are many calling for an end of the “Great Bond Bull Market,” this is unlikely the case. As shown in the chart below, interest rates are relative globally. Rates can’t rise in one country while a majority of economies are pushing negative rates. As has been the case over the last 30-years, so goes Japan, so goes the U.S.
Unfortunately, for Ms. Yellen, the reality is MORE spending is unlikely to change the outcome in the U.S. just as it has failed in Japan. The reason is that monetary interventions and government spending don’t create organic, and sustainable, economic growth. Simply pulling forward future consumption through monetary policy continues to leave an ever growing void in the future that must be filled. Eventually, the void will be too great to fill.
But hey, let’s just keep doing the same thing over and over again, which hasn’t worked for anyone as of yet, hoping for a different result.
What’s the worst that could happen?
THE MONDAY MORNING CALL
The Monday Morning Call – Analysis For Active Traders
Charts Suggest Higher Levels Of Caution
Despite a “belief” that “This Time Is Different (TTID)” due to Central Bank interventions, the reality is that it probably isn’t. The only difference is the interventions have elongated the current cycle, and has created a greater deviation, than what would have normally existed. What is “not different this time” is the eventual reversion of that extreme will likely be just as damaging as every other previous bear market in history.
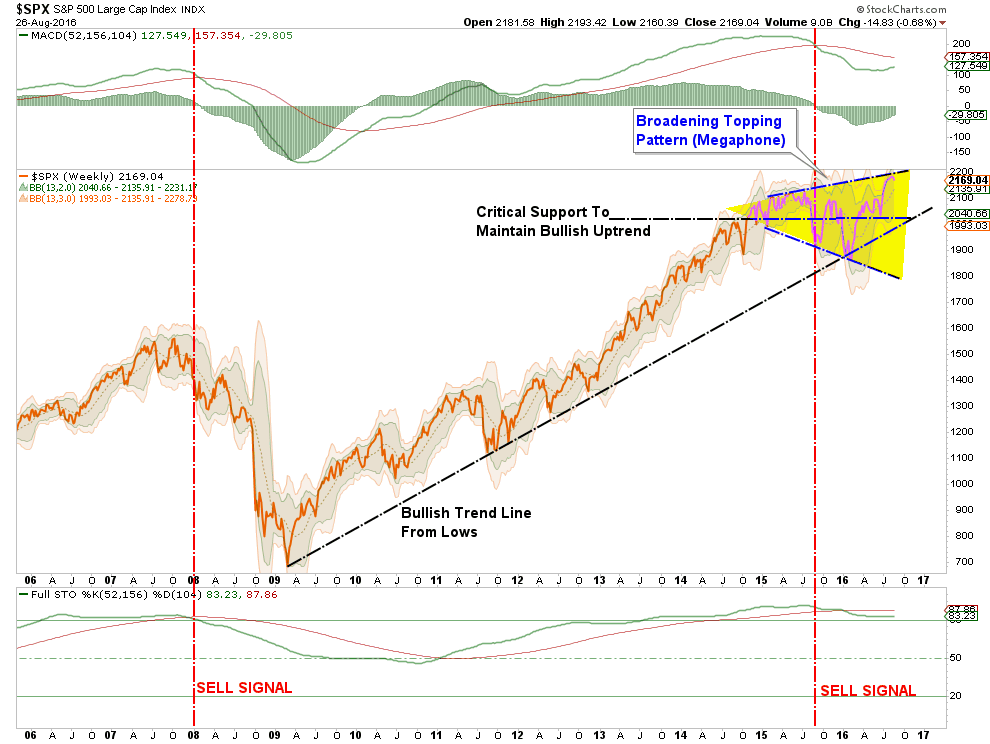
The chart below shows the S&P 500 back to 1925 with the long-term trend line overlaid with a 72-month (6-year) moving average and Bollinger bands. The bottom two graphs are the percentage of the band width of 2-standard deviations of the 72-month moving average and the 72-month W%R.
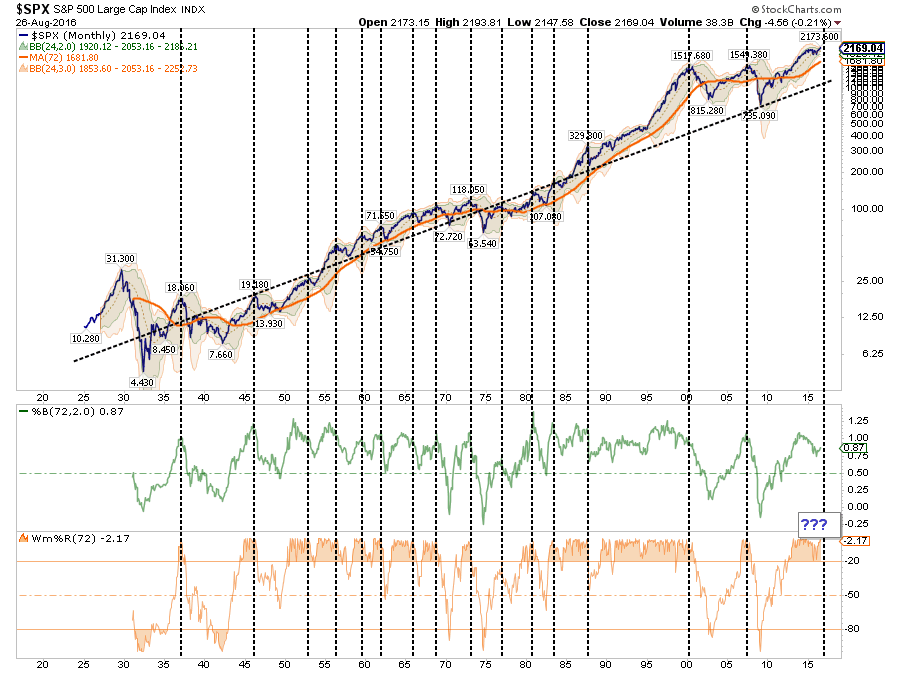
The vertical dashed lines correspond with corrections when both the %B and Wm%R both turn down from highs. While that has not occurred as of yet, it is unlikely at this point that it won’t. It’s just a matter of timing.
Furthermore, on a longer-term basis, the market continues within a “broadening topping process” or a “megaphone” pattern. While these patterns do not always come to fruition, the fact this one is combined with a dual sell-signals only registered prior to the financial crisis does provide some cause for concern.
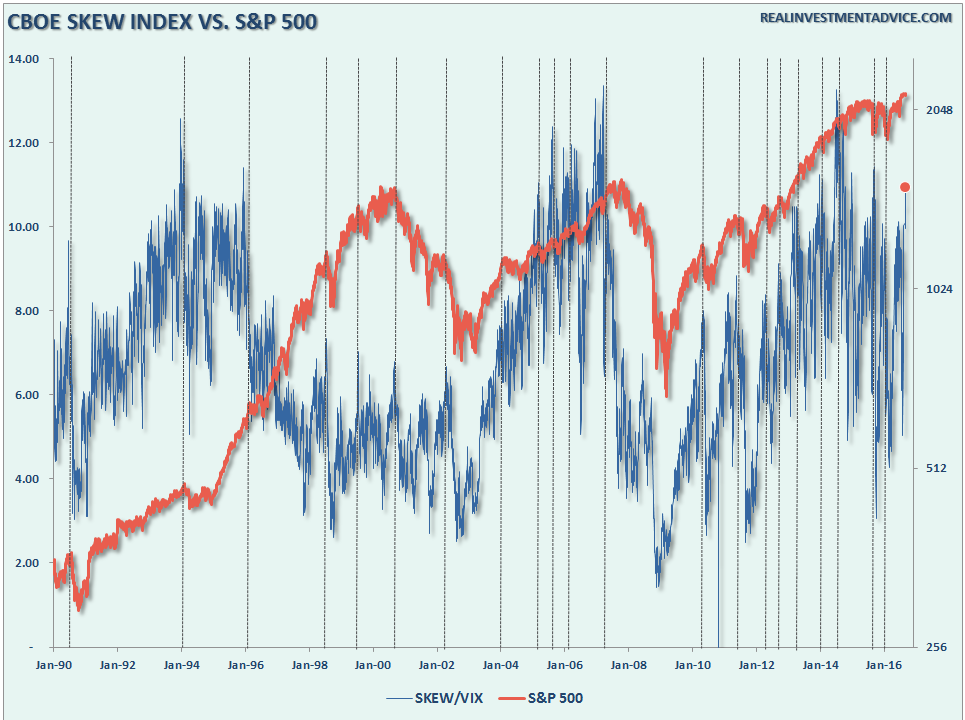
One of the more “off-the-beaten-path” indicators I watch is the CBOE SKEW Index divided by the Volatility Index. This ratio has spiked in recent days and such spikes historically have led to either short-term corrective actions or more full-fledged bear market declines.
Dana Lyons did a better job than I this past week with the Put/Call Ratio. To wit:
“However, even based on recent history, and even on a normalized basis, the August 23 reading was the lowest ever recorded.
So looking at the readings below 50, what can we glean, if anything?”
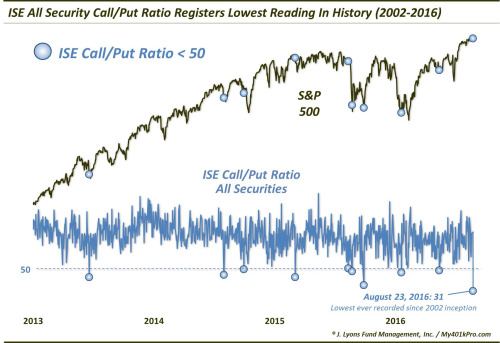
“Again, as the chart shows, most of the readings occurred after at least a short-term selloff. They also marked almost the precise short-term bottom in the S&P 500 at many of the readings. Therefore, the performance of the index was generally very positive going forward. However, it is not all bull fodder, as the following table of previous incidents demonstrates:”

“However, it is the 2 failed readings, and their similarity to current circumstances, that gives us pause in assuming an all-clear sign. Unlike the other events, those 2 failures, on 3/5/2015 and 8/12/2015, occurred in the absence of any noteworthy weakness. In fact, they were the only 2 prior readings that occurred while the S&P 500 was positive over either the previous 1 day, 4 days or 1 month. They were also the only 2 occurring with the S&P 500 within about 2% of its 52-week high.
Given the similar conditions presently to previous readings that failed, we’d have a hard time putting this into the bullish column.”
Lastly, the weekly full-stochastic indicator as shown in the chart below has issued a “sell signal.” Combined with the volatility index turning up from extremely low levels, it suggests a near-term potential for a continued corrective action.
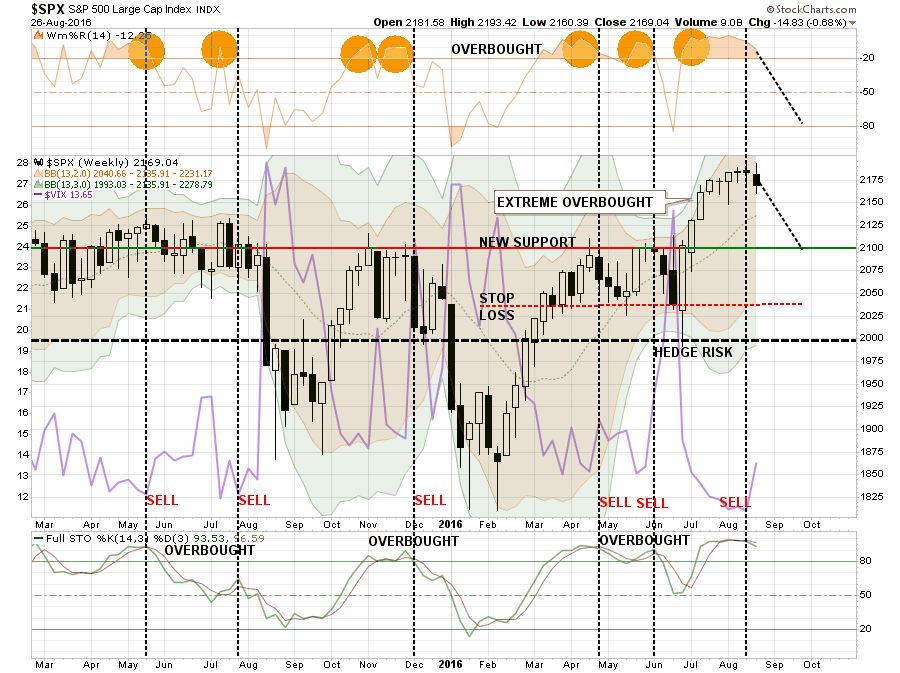
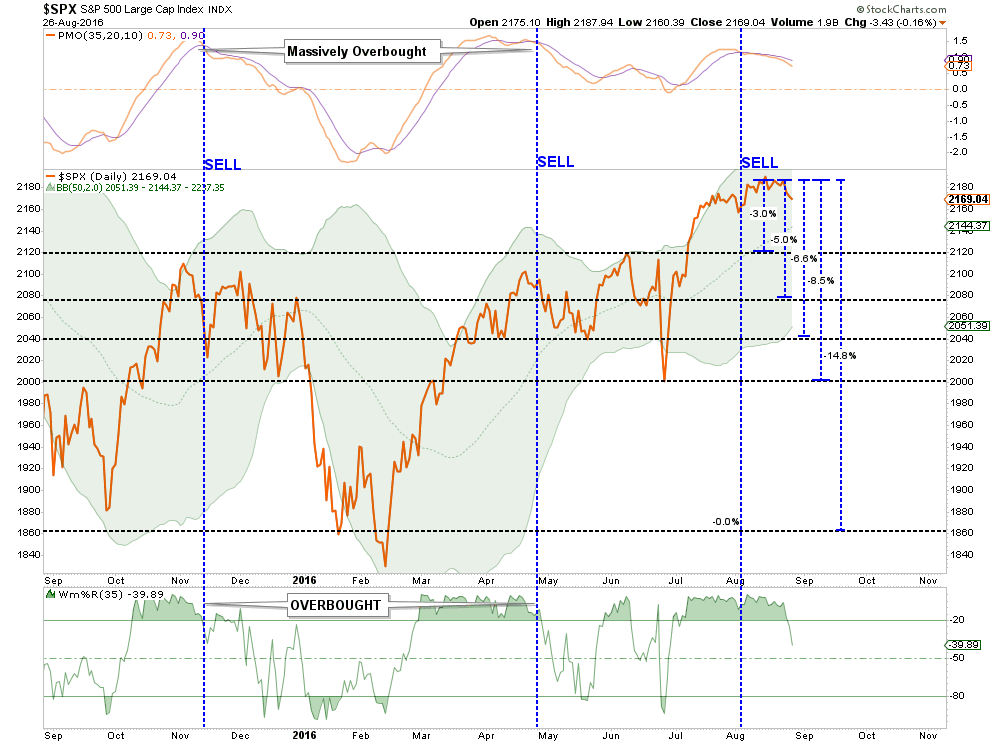
While the market has managed to remain in suspended animation over the last couple of weeks, the market, on a short-term basis, remains in extreme overbought territory. This needs to be relaxed somewhat before additional equity exposure is added to portfolios. As shown, a reversion to the current bullish trend line, which coincides with the market’s recent breakout levels, is a likely target in the short-term.
However, there is a more than reasonable chance, as I laid out two weeks ago, for a deeper correction in the next 30 days. The chart below shows the potential drawdowns from current levels.
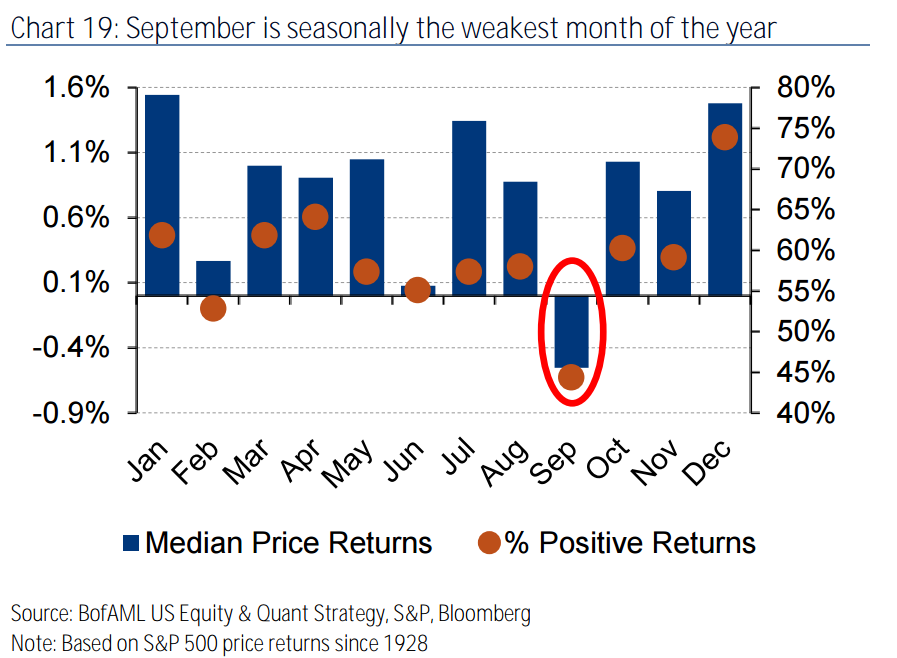
History is working against the market. September is typically the weakest month of the year; since 1928, the S&P 500 has dropped in September 56% of the time.
Here is the point. It would take a correction from current levels to break 2000, which is very important support for the markets currently, to even register a 10% correction.
Given the current bullish exuberance for the market, this is probably unlikely between now and the election. Therefore, even a “worst case” correction currently would likely be an 8.5% drawdown back to major support. Of course, for most individuals, even such a small correction would likely feel far more damaging.
The bottom line is there is a wicked setup being developed that could lead to a rapid destruction of capital if something “goes wrong” in the weeks ahead. With the risk/reward ratio very negative currently, caution remains advised.
Model Update
S.A.R.M. Sector Analysis & Weighting
Despite a bumpy ride this past week, the market actually declined by .57% last week. I know…SHOCKER…right?
As I have been repeatedly stating over the last few weeks, as boring as it has been, there has not been enough of a correction of the current overbought condition to justify increasing equity allocations in portfolios yet. This is despite the fact the model has been adjusted higher to represent the target levels of equity exposure we want to migrate toward.
While the portfolio equity risk weighting remains at 50% again this week, the odds of a further correction, as noted above, have increased this past week. The opportunity to increase equity allocations, given a sufficient setup where no violation of major support and the presence of an oversold condition occurs, has improved.
With all buy signals currently in place, and the bullish trend intact, this is not a market to bet heavily against…for now. However, it is also not a market to become extremely complacent in either.
Again, we must be given the right “set up” to increase equity allocations. Begin by “averaging up” in existing holdings to match model allocation and weights. When, and IF, the market confirms the continuation of the “bullish trend,” then begin adding new holdings to the model.
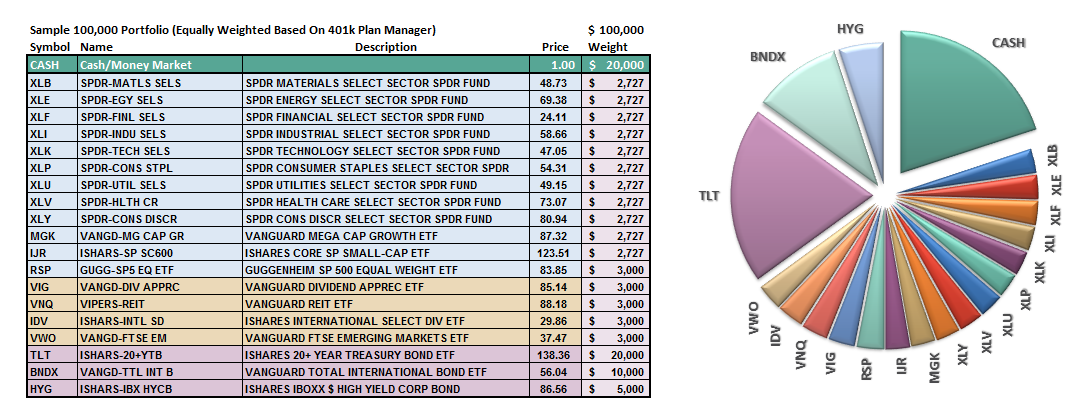
(Note: This is an equally weighted model example and may differ from discussions of overweighting/underweighting specific sectors or holdings.)
Relative performance of each sector of the model as compared to the S&P 500 is shown below. The table compares each position in the model relative to the benchmark over a 1, 4, 12, 24 and 52-week basis.
Historically speaking, sectors that are leading the markets higher continue to do so in the short-term and vice-versa. The relative improvement or weakness of each sector relative to index over time can show where money is flowing into and out of. Normally, these performance changes signal a change that last several weeks.
I noted last week:
“The fall in the US Dollar over the last could of weeks has boosted the performance of the energy, materials, and industrial sectors of the market. However, as stated above, we have likely gotten the majority of that advance already locked in so profit taking is likely wise.”
That was a prescient call and the dollar bounced off support as anticipated last week. The recent spike in interest rates has now reached the top of the long-term downtrend and suggests that staples, utilities, and bonds will continue to improve in performance over the next couple of weeks. Such improvement will most likely coincide with an ongoing market correction.
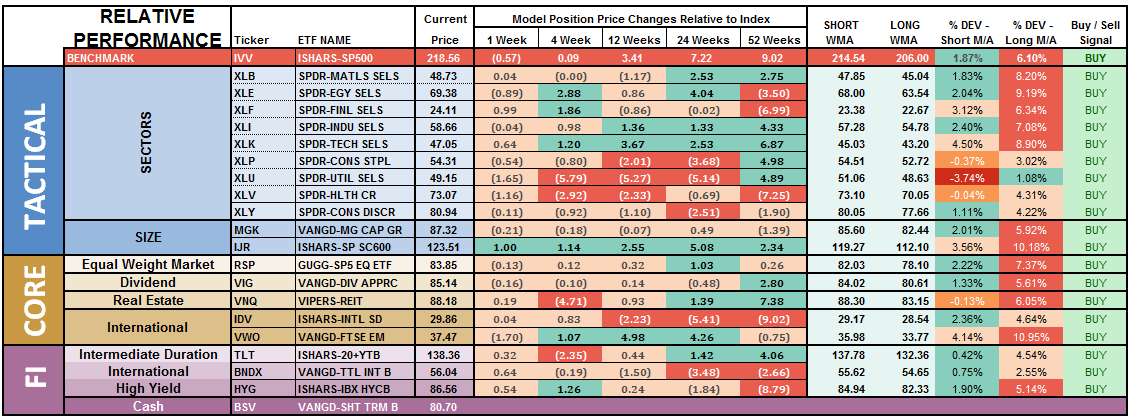
Notice in the next to last column to the right, the majority of all sectors and indices are pushing extreme levels of deviation from their long-term moving average. Such deviations can not, and do not, last long historically. A resolution of those deviations, which will occur during a corrective action, will provide the necessary risk/reward rebalancing to increase model allocations.
The two charts below graphically show the relationship of each position’s performance relative to the S&P 500 Index. If we are trying to “beat the index” over time, we want to overweight sectors/asset classes that are either improving in performance or outperforming the index, and underweight or exclude everything else.
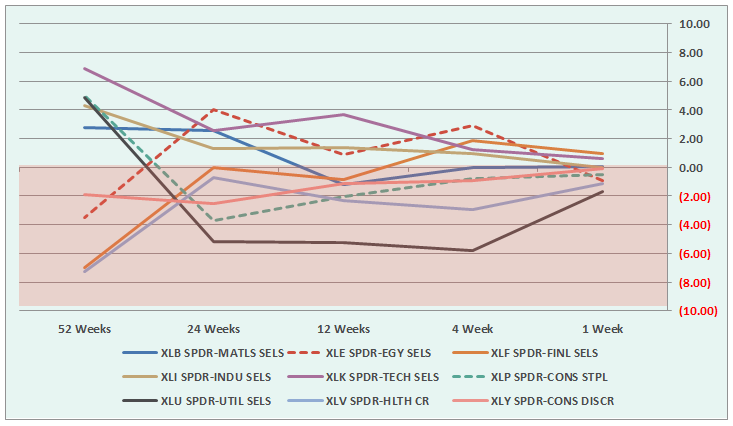
Sectors Currently Outperforming by >1%
- None
Sectors Currently Performing In Line <>1%
- Industrials
- Materials
- Energy
- Staples (improving)
- Technology
- Financial
- Discretionary (improving)
Sectors Currently Under Performing By >1%
- Utilities (improving)
- Healthcare (improving)
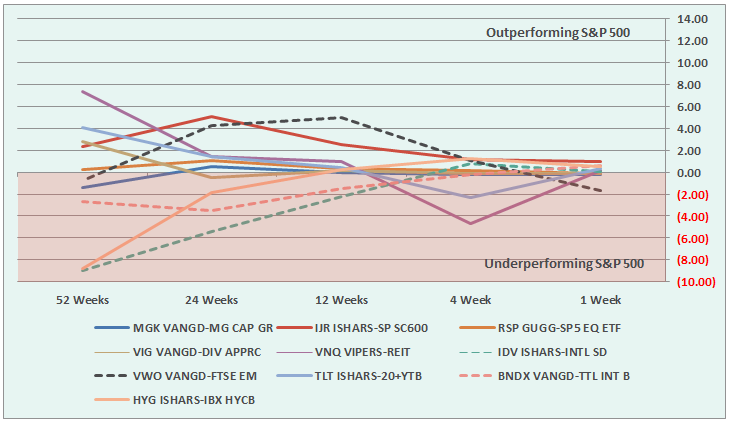
Index/Other Asset Classes Out Performing S&P 500 By >1%
- Small-Caps (weakening)
Index/Other Asset Classes Performing In-Line With S&P 500 <>1%
- Mid-Caps
- Equal-Weight S&P 500
- International Bonds
- High-Yield Bonds
- Dividend Stocks
- International Stocks
- REIT’s (improving)
Index/Other Asset Classes Under Performing S&P 500 By >1%
- Emerging Markets (weakening – recommended sell two weeks ago)
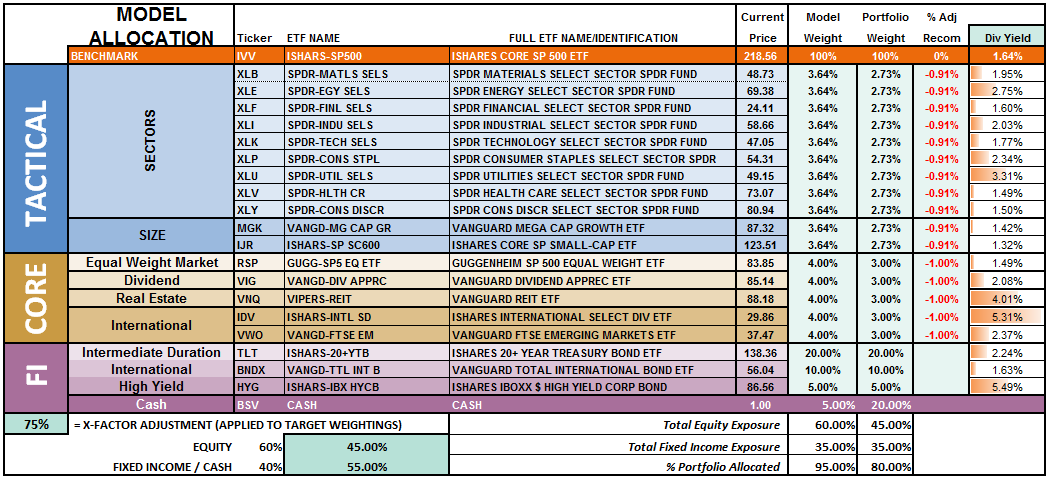
The risk-adjusted equally weighted model has been increased to 75%. However, as stated above, a pullback in the markets is needed before making any changes.
Such an increase will change model allocations to:
- 20% Cash
- 35% Bonds
- 45% in Equities.
As always, this is just a guide, not a recommendation. It is completely OKAY if your current allocation to cash is different based on your personal risk tolerance, time frames, and goals.
For longer-term investors, we still need to see improvement in the fundamental and economic backdrop to support the resumption of a long-term bullish trend. Currently, there is no evidence of that occurring.
THE REAL 401k PLAN MANAGER
The Real 401k Plan Manager – A Conservative Strategy For Long-Term Investors
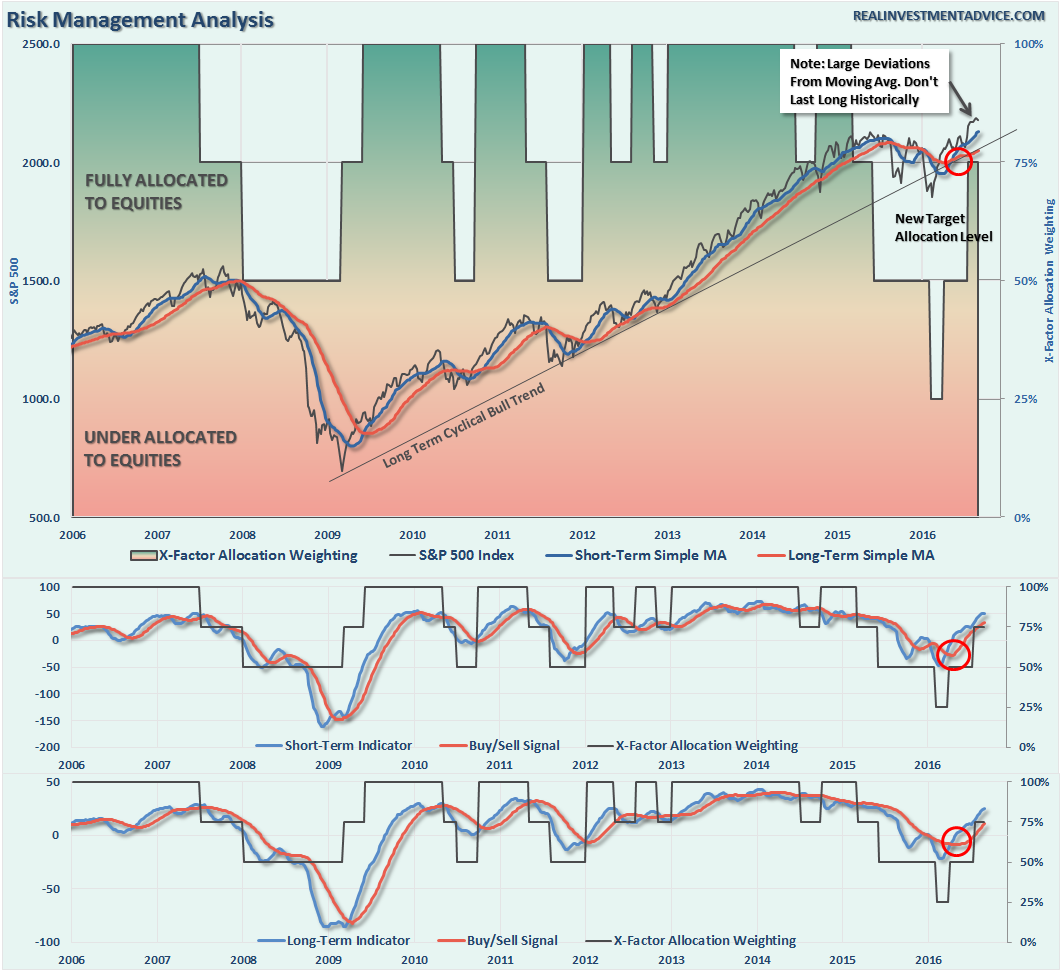
NOTE: I have redesigned the 401k plan manager to accurately reflect the changes in the allocation model over time. I have overlaid the actual model changes on top of the indicators to reflect the timing of the changes relative to the signals.
There are 4-steps to allocation changes based on 25% reduction increments. As noted in the chart above a 100% allocation level is equal to 60% stocks. I never advocate being 100% out of the market as it is far too difficult to reverse course when the market changes from a negative to a positive trend. Emotions keep us from taking the correct action.

Everything In Slow Motion
As I stated last week:
“It seems as of late that we have continued to wait on an event that seems as if it will never come. Such is the trial of money management and a disciplined approach to investing over the pull of emotional biases.
Sometimes, it seems, we get the “feeling” that we should do “something.” Yet, as I try and detail here in this missive often, sometimes the best way to do “something” is to actually do “nothing.” Such is the case now.”
I wish I had something new to report to you this week, but unfortunately, I don’t.
- The Fed came and went. The market barely noticed.
- Economic data continued to weaken. The market barely noticed.
- The dollar and interest rates rose. The market barely noticed.
This keeps us currently stuck with the risk of “doing something” greatly outweighed by the potential reward of “doing nothing.”
As discussed at length in the above missive, we certainly want to prepare ourselves to increase equity exposure in portfolios, however, we must patiently wait for the right conditions to apply those increases. Furthermore, while waiting for the relaxation of prices to make more prudent entries, it also enables investors to bypass potential “head fakes” of market actions.
Continue to do “something” by managing the inherent risk in your portfolio by:
- Reviewing the allocation model adjustments below
- Identifying the next course of actions in your 401k-plan
- Waiting to make adjustments until technical conditions improve.
- Changing allocations to target levels when conditions are right.
If you need help after reading the alert; don’t hesitate to contact me.
Current 401-k Allocation Model
The 401k plan allocation plan below follows the K.I.S.S. principal. By keeping the allocation extremely simplified it allows for better control of the allocation and a closer tracking to the benchmark objective over time. (If you want to make it more complicated you can, however, statistics show that simply adding more funds does not increase performance to any great degree.)

401k Choice Matching List
The list below shows sample 401k plan funds for each major category. In reality, the majority of funds all track their indices fairly closely. Therefore, if you don’t see your exact fund listed, look for a fund that is similar in nature.

Disclosure: The information contained in this article should not be construed as financial or investment advice on any subject matter. Streettalk Advisors, LLC expressly disclaims all liability in ...
more


thanks for sharing