
Tracking The Bear - Nov. 17
![]()
Last week, I discussed the potential year-end setup for a January correction. To wit:
“It is the turn of the calendar where I see the potential for a bigger correction. Come January, I think there is a high-likelihood of ‘tax selling’ by fund-managers to lock in gains, particularly if ‘tax reform’ legislation has passed, as taxes won’t be due for 21-months (assuming late filing.)
That selling, combined with concerns over the Fed’s rate hike in December and reduction of the balance sheet, could facilitate a deeper correction of 3-5%.”
Chart updated through Friday
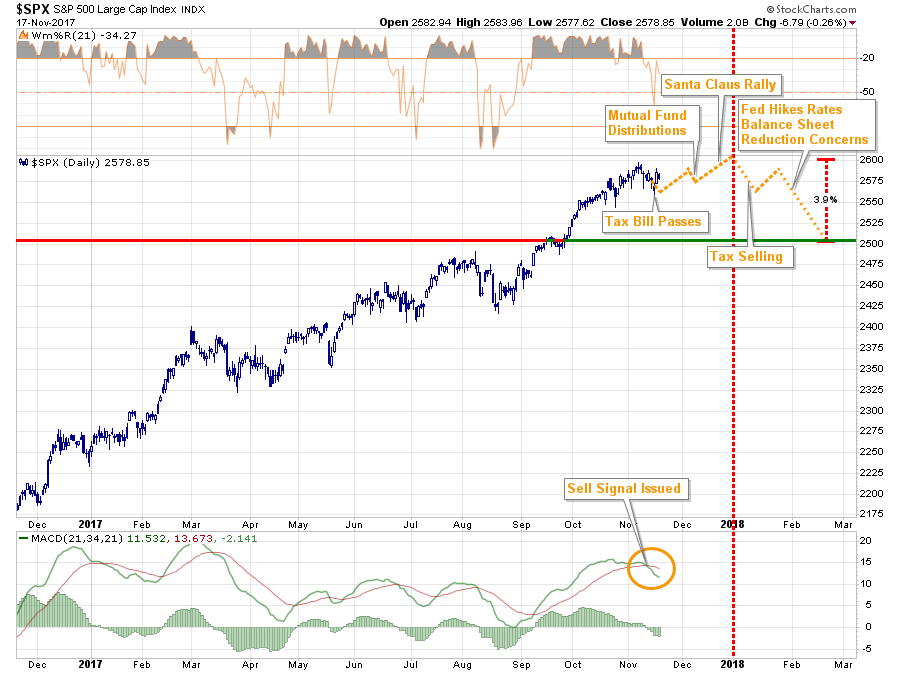
Two things occurred this past week:
- Last week, I stated the internal deterioration of the market suggested continuing weakness in this week. Even with the strong rally on Thursday heading into the passage of the “tax bill,” the markets still finished -0.13% lower for the week.
- Importantly, the continued weakness triggered a MACD “sell signal” as shown above. Such signals have often led to short-term corrections, or worse, in the past.
This coming week is Thanksgiving week which is traditionally an extremely “light” trading period where the “inmates are running the asylum.” With the market more overbought now than at any other period since 2011, a consolidation or further corrective action is entirely possible.
While some “caution” is advised, it is NOT advisable to act “emotionally” to swings next week due to the low volume trading that will be occurring.
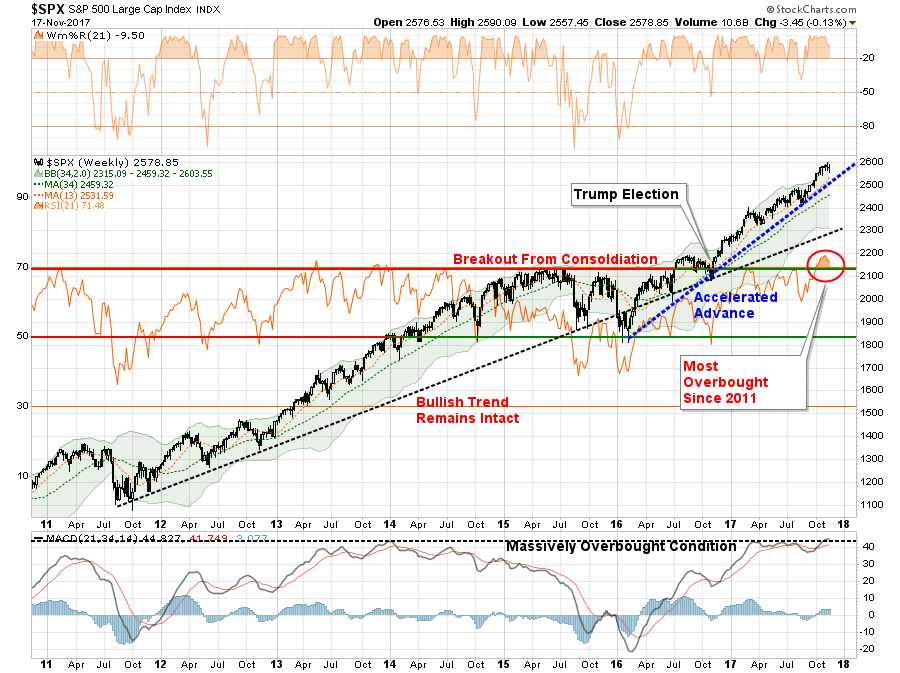
While the market is extremely overbought, the bullish trends remain intact. Furthermore, the last two months of the year are typically bullish for asset prices. Understanding this, these conditions keep portfolios allocated towards equity risk currently. But we do so with an eye on the risk.
Tracking The Bear
by Michael Lebowitz, CFA
In Bond Bears: Why Rates Won’t Rise Lance Roberts recently forecasted stable to lower bond yields in the months ahead. His argument is partially based upon a continuation of weak economic growth trends. To support the forecast he presented a graph of the 2s-10s yield curve, or the difference between 2-Year U.S. Treasury yields and 10-year U.S. Treasury yields.As shown below the yield curve tends to flatten and ultimately invert (10yr-yields become less than 2yr-yields thus the curve goes below zero) as economic activity wanes and recession becomes imminent.
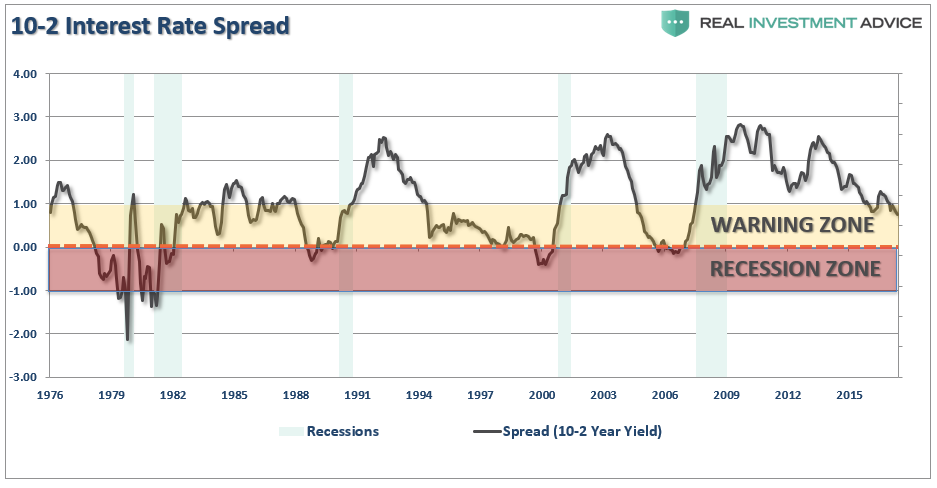
Currently, the 2s-10s curve sits in the “warning zone” and is at the lowest level since the financial crisis of 2008. This is possibly a sign that bond traders are concerned about future economic activity and if it continues to flatten, one that could spell trouble for the equity markets.
It is said stocks take the stairs up and the elevator down. That is a nice way of saying that when a market peaks it tends to fall much more impulsively than it rose. Prior to the last market correction (2008), the S&P 500 rose steadily for over five years. Those gains and more were erased in less than two years with the majority of losses coming between September and November 2008, when 41% of the index was wiped out.
Junk Debt
If we assume the next sell-off in stocks, like the previous few, will not be a gradual decline but a sharp drop lower, we must remain alert to signals that precede trend changes. The importance today is every bit as important as in 1999 and 2007, given that valuations stand at or near all-time highs and the risks of significant losses are potentially on par with loses in those periods. The yield curve is one such signal we should follow as recession tends to accompany lower stock prices.
Another such warning worth watching closely is the recent divergence between high yield debt and the S&P 500.
High yield debt, also known as junk bonds, are the publicly traded debt of companies rated as below investment grade (BB+/Ba1 or below). Simply, they have a higher level of default risk than investment grade bonds. It is because of this credit risk that some investors consider them a hybrid between equity and bonds. The higher yields offered by junk-rated companies and their tendency for greater price volatility makes their total returns more similar with equity returns than Investment-grade corporate debt and U.S. Treasuries. Investors of junk debt tend to do similar fundamental analysis as equity investors.
**Throughout this article the terms “junk” and “high yield” are used interchangeably. Both refer to below investment grade debt.
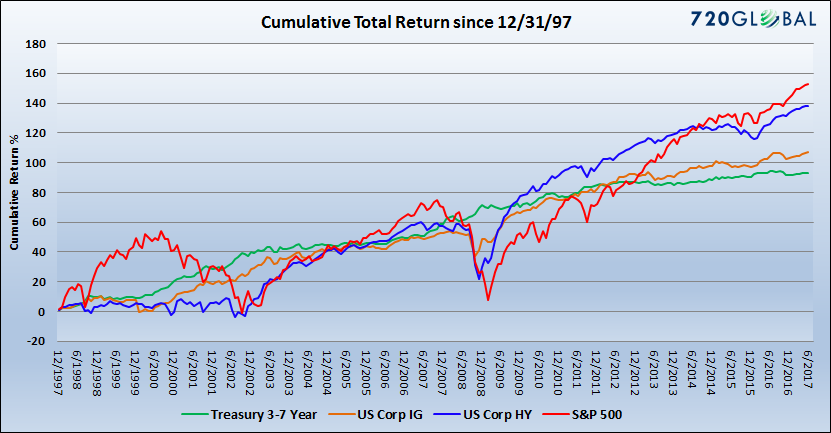
The graph below highlights the strong correlation between high yield bond and stock returns. Further explaining why investors think of high yield debt as having equity-like return traits. As shown the returns of high yield (blue) more closely resemble those of the equity market (red) than the returns of U.S. Treasury (green) or Investment grade corporate (orange) bonds.
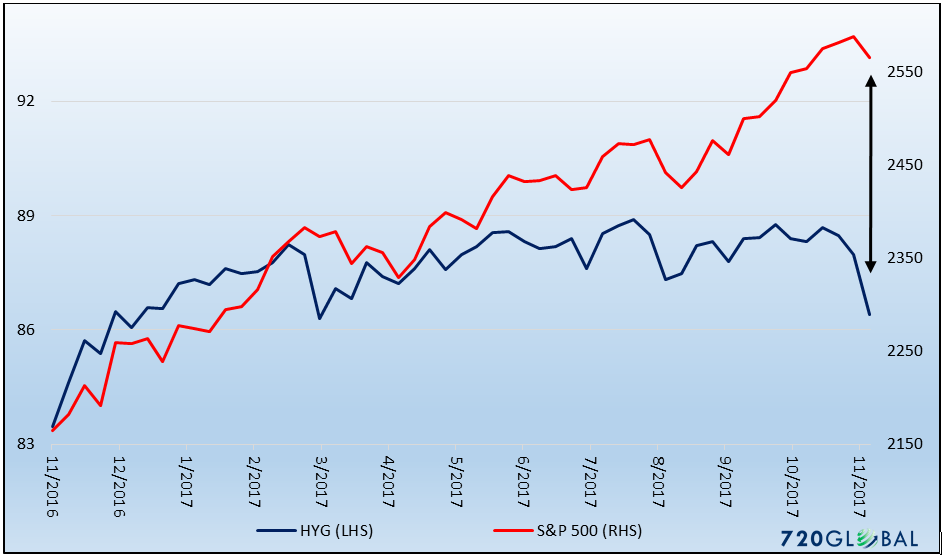
Divergence
Over the past year, there has been a growing divergence between the price of the two most popular high yield ETF’s (JNK and HYG) and the S&P 500. Since January of 2010, the price changes of JNK and HYG have been approximately 65% correlated to the price change of the S&P 500. Recently the relationship is fraying. Over the past six months, the correlation has dropped in half to 32%. The lack of correlation is not only evident in the graph below but also in year to date returns. Thus far in 2017, the S&P 500 is up over 13% while the two junk ETF’s are down slightly.
Recent poor performance of the high yield ETF’s is the result of spread widening between the Barclay Junk Index and the U.S. ten year Treasury note. When this spread widens, the yield on the junk index rises by more than the yield on the Treasury note. This occurs when investor concerns about economic weakness and ultimately credit risk elevate. The current spread of the Barclay Index to ten-year Treasury yields is 3.36% which is well within recent ranges and low on a longer-term basis. In fact, it is sitting on top of the year to date average spread. While a longer-term chart would not cause much alarm, it is worth noting that the spread has increased 40 basis points (or 0.40%) over the last four weeks.
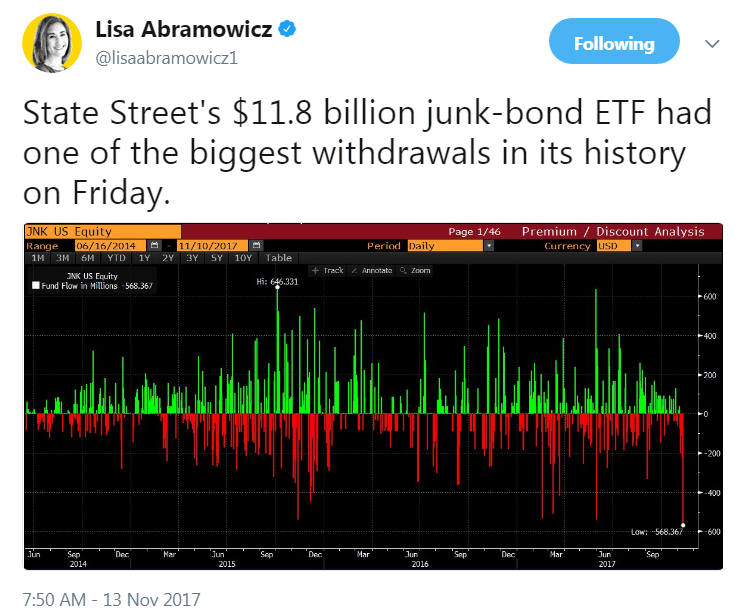
Of further concern is the following tweet and graph from Lisa Abramowicz of Bloomberg.
Summary
Historically bond traders have been more in tune with economic turning points than equity traders. It, therefore, goes without saying that equity investors should look for clues in the fixed income markets. Unless one thinks it is different this time, fixed income tends to lead equities.
The yield curve chart and relative weakness in the high yield sector are benign signals at the moment. While neither is flashing red, they certainly should be followed. We will continue to track these and many other fixed income and equity technical indicators for increased signs of a potential reversal in the equity markets. As they say “Stay Tuned.”
A Fiscal Disappointment – Tax Bill
I encourage you to take a few minutes to review my previous analysis of the effectiveness of tax cuts on the economy.
The Committee For A Responsible Budget penned after the passage of the tax bill:
“The House approved debt-financed tax cuts based on predictions of magical economic growth that defy history and all credible analyses.
Tax reform should grow the economy and not add to the debt. Unfortunately, lawmakers are assuming faster economic growth will pay for that debt increasewhen there is no evidence it will cover more than a fraction of the tax bill’s costs.
The last time Congress added 10-figures worth of tax cuts to the debt in 2001, it blew a hole in the budget and helped erase our surpluses — despite claims that economic growth would cover the cost.The growth fairy did not appear then, and it would be unwise to assume she will this time around.”
Read that again.
Despite claiming to be “fiscally conservative,” what is so amazing is that Republicans are considering doing this when debt is at the highest level in history and climbing.
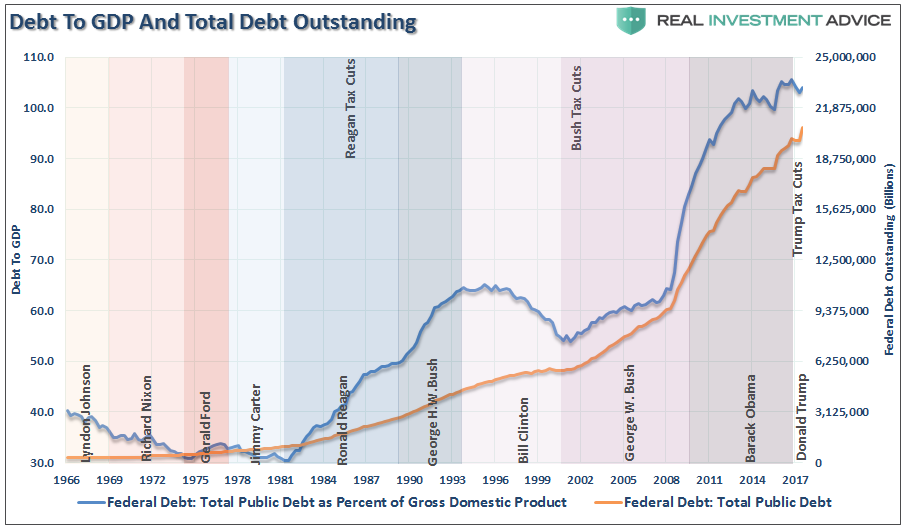
When the “Reagan” tax cuts of were passed, debt was less than 50% of GDP, inflation and interest rates were high and falling, and the economy was just recovering from back to back recessions. When the “Bush” tax cuts were passed, debt to GDP was only slightly higher than under Reagan but despite the tax cuts, the economy slid into a recession compounded by the “dot.com” bust.
Currently, debt is 104% of GDP — higher than any time in history, the economy has been in a 9-year expansion at the lowest rate of growth on record, and interest rates and inflation are low with the Fed hiking rates and reducing monetary support.
The situation currently is much more like Bush versus Reagan.
Lastly, despite the continuing “talking points” that “tax cuts” spur economic growth and will pay for themselves over time….there is no evidence to support that claim.
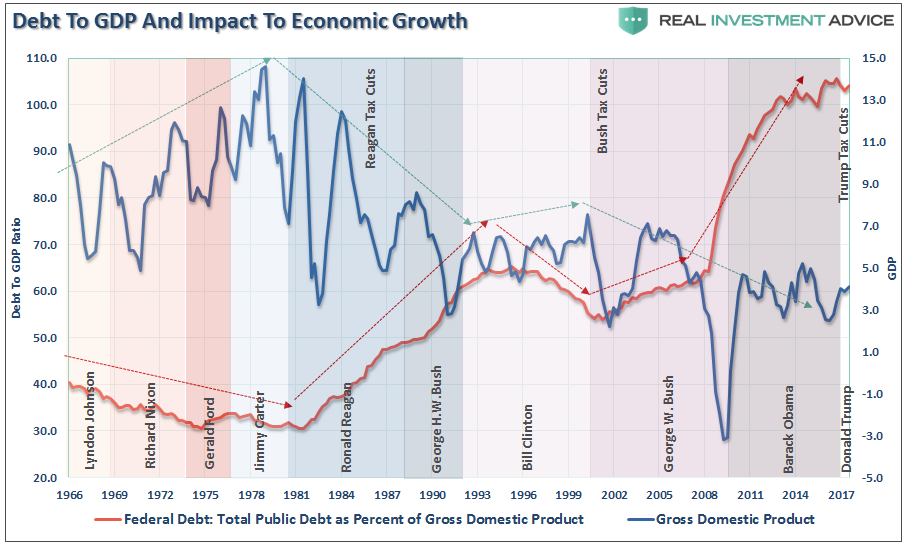
Given we are projected to borrow another $10 trillion over the coming decade. Republicans should be looking for “fiscally responsible” tax reform rather than piling another $2.2 trillion on top of it.
As the CRFB concludes:
“Instead of trickling down economic growth, the House plan will unleash a tidal wave of debt that will ultimately slow wage growth and hurt the economy.”
The market WILL figure this out eventually, and the consequences will not be good.
Market & Sector Analysis
Data Analysis Of The Market & Sectors For Traders
S&P 500 Tear Sheet
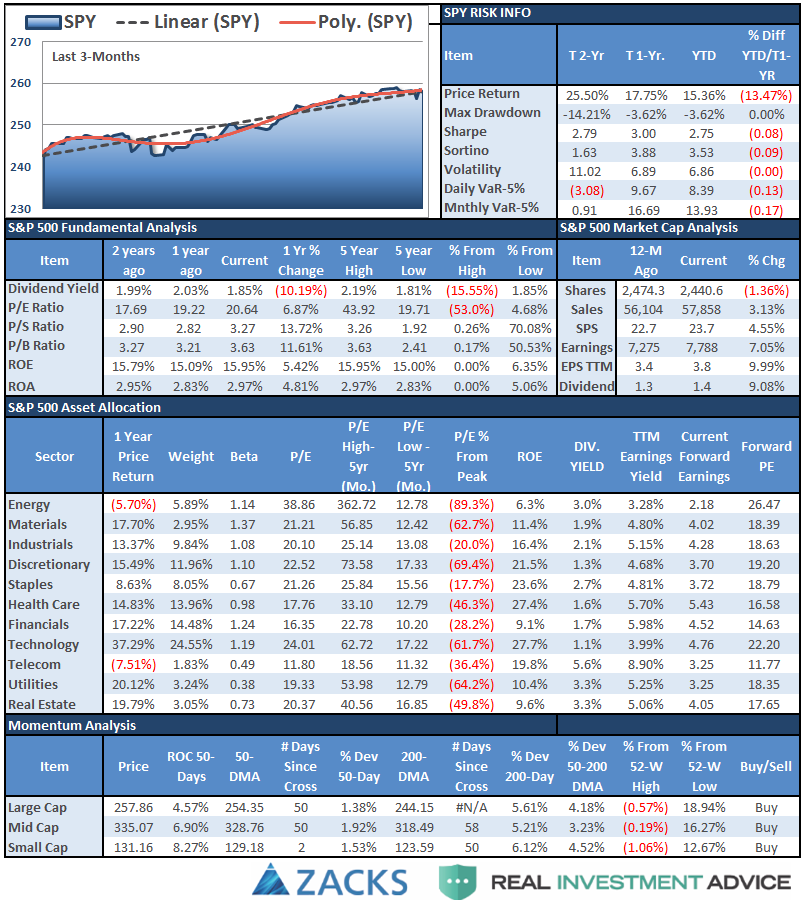
Performance Analysis
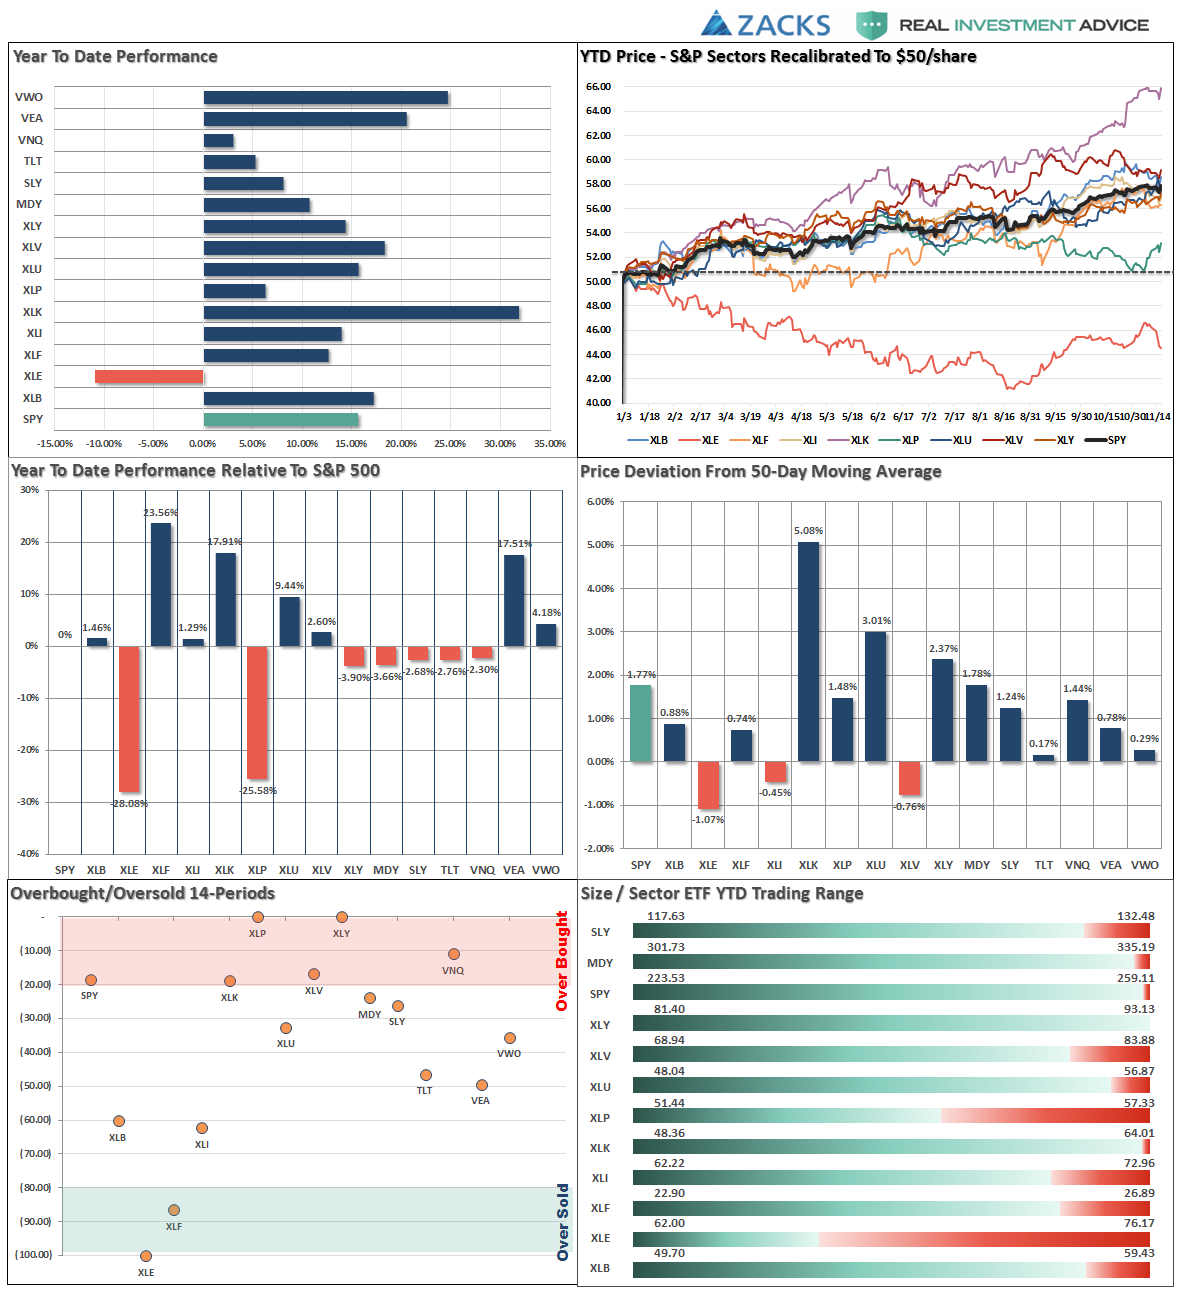
ETF Model Relative Performance Analysis
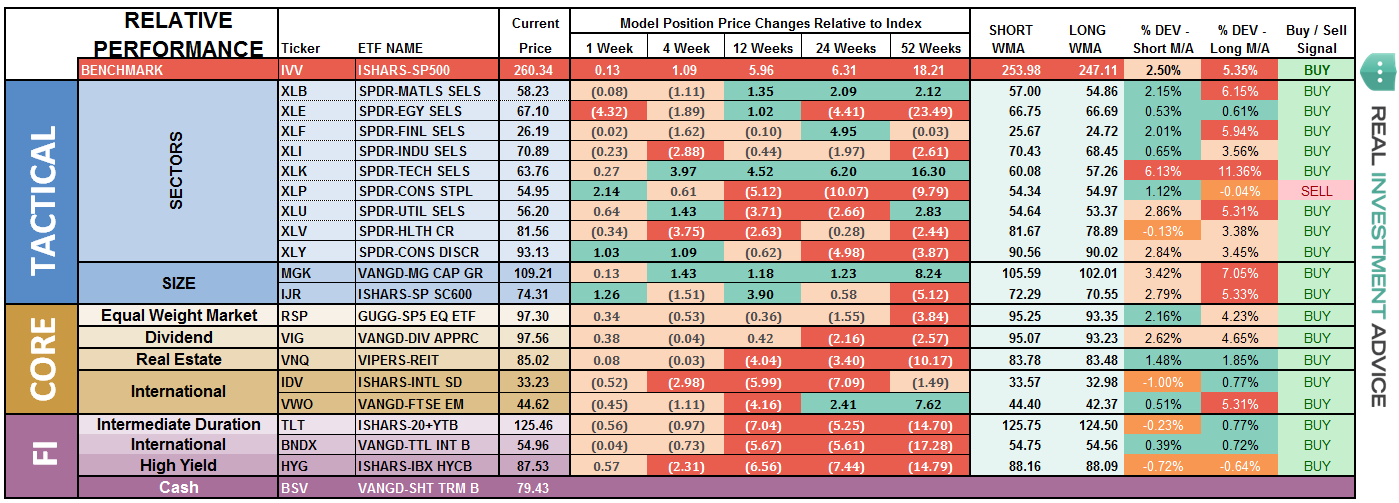
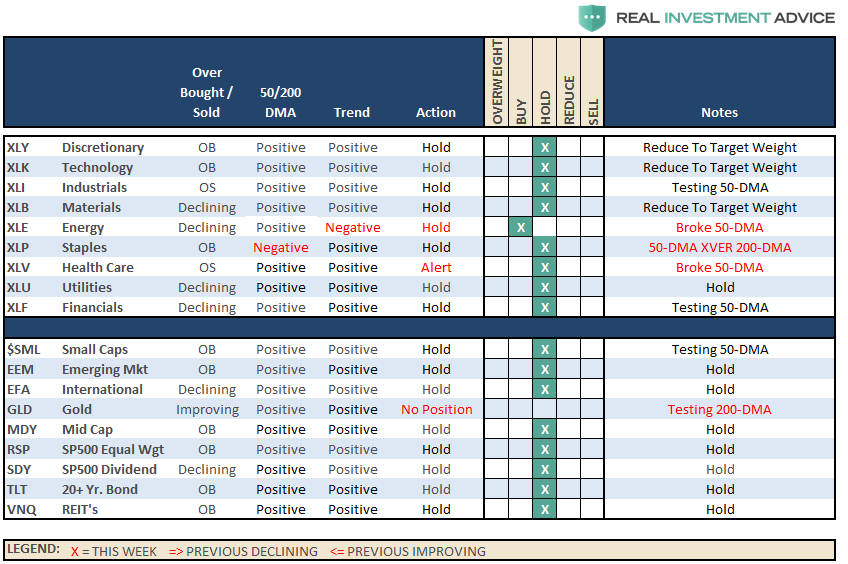
Weakness is showing up in “Risk” sectors and indices on a “relative performance basis” (compared to S&P 500) and shifting into more “Defensive” sectors such as Bonds, Real Estate, Staples, and Dividends.
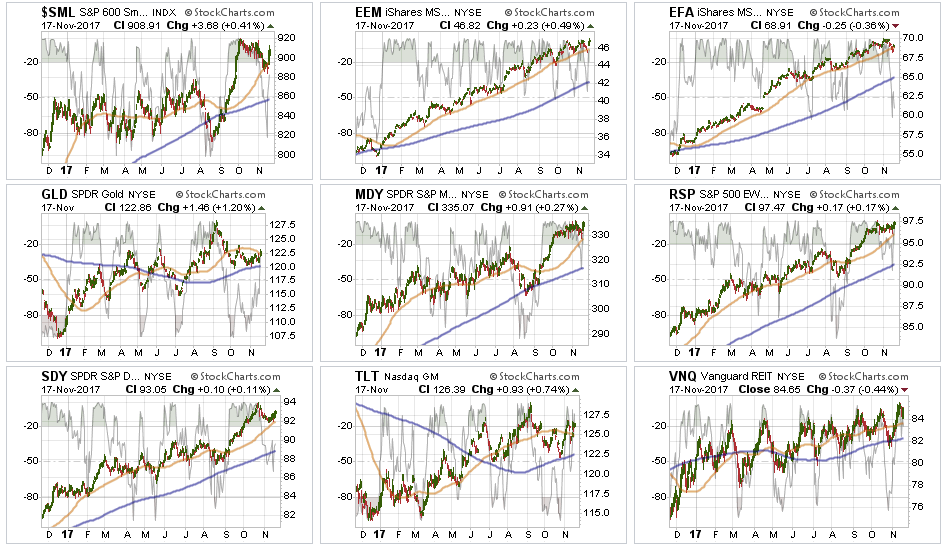
Sector & Market Analysis:
For a second week running, the market stumbled slightly. However, had it not been for the huge surge on Thursday with the passage of the GOP tax bill, the end result would have been worse. Nonetheless, there has been no change to the current trajectory of the market overall.

Discretionary, Staples were the best performing sectors this past week as money chased recent underperformance, and WMT’s earnings, to position for year-end shopping sprees. It is quite likely retailers will be disappointed, but we will wait and see.
Technology took a breather this past week but remains near highs. It appears Technology may have begun a consolidation or topping process. We will need to wait to see how the current price action resolves itself before taking action within the sector.
Basic Materials, Financials, and Industrials despite passage of the “tax bill” by the House, the sectors most related to the tax-reform based “Trump Trade” continue to underperform. Trends are still positive but there is a risk to these sectors currently. Last week we recommended taking profits and rebalance risks. That remains prudent current with stops moved up to recent lows in each sector.
Healthcare has slipped below its 50-day moving average and has struggled last week. While the trend remains positive, the violation of the support suggests profit taking and rebalancing is warranted to reduce risk. Move stops up to recent lows.
Energy – the recent bounce in Energy, as feared, turned out to be a “head-fake” with prices falling back below the 50-dma. However, prices are once again trapped between the 50 and 200-dma. The positive is the backdrop is much more positive with the 50-dma having crossed above the 200-dma, We are looking to add energy back into portfolios after having been out of the sector since 2014.
Utilities, we remain long the sector and have moved stops up to the 50-dma. Trends remain positive and interest rates have likely peaked for the current advance.
Small and Mid-Cap stocks rebounded sharply off supports last week after threating to break down. We did harvest some profits last week but remain long for now.
Emerging Markets and International Stocks have shown some weakness as of late in terms of momentum, but remain in a bullish trend overall. We remain long these markets for now but have moved up stops accordingly.
Gold – Gold broke above the 50-dma last week which was bullish, but remains confined in sideways trend. With the 50-dma starting to weaken, and the commodity very overbought currently, the risk is to the downside currently. We continue to watch the commodity currently, but remain on the sidelines for now.
NEW! S&P Equal Weight – In our “core portfolios” we carry an equal weighting of both the S&P 500 dividend index and the S&P 500 equal-weight index. This balance gives us historically better performance, lower volatility and a higher yield than just carrying the S&P 500 index. I have added this analysis permanently going forward. The equal-weighted index pushed higher last week and is now testing old highs. In a future report, I will cover our strategy in more detail.
S&P Dividend Stocks, after adding some additional exposure this summer, the index managed an extremely strong advance. I noted previously that we are holding our positions for now with stops moved up to $92 and that we did take some profits and rebalanced accordingly. The recent correction tested support and turned up confirming the bullish trend, we remain long.
Bonds and REIT’s – Despite“tax reform” being passed by the House, rates declined last week signaling that either a belief “tax reform” will become a reality is fading, or the nonsense that tax reform will create surging inflation, growth and interest rates is becoming more apparent. The bullish trend in Bonds and REIT’s continues so we will continue looking for pullbacks to add additional exposure.
Sector Recommendations:
The table below shows thoughts on specific actions related to the current market environment.
(These are not recommendations or solicitations to take any action. This is for informational purposes only related to market extremes and contrarian positioning within portfolios. Use at your own risk and peril.)
Portfolio Update:
Action: Trimmed holdings in Mid/Small Cap exposure on the rally.
While the market continued to hold its bullish trend this week, the internal deterioration continued to build. While we are heading into the seasonally strong period of the year, we remain cognizant of the underlying risk. As I stated last week:
“I am now looking to begin building ‘Short S&P 500 and Nasdaq’ positions into portfolios over the next few weeks as a hedge against a January decline as noted above. I will keep you advised as to changes in portfolios ahead if my expectations begin to come to fruition.”
That analysis continues.
As always, we remain invested but are becoming highly concerned about the underlying risk. Our main goal remains capital preservation.
THE REAL 401k PLAN MANAGER
The Real 401k Plan Manager – A Conservative Strategy For Long-Term Investors
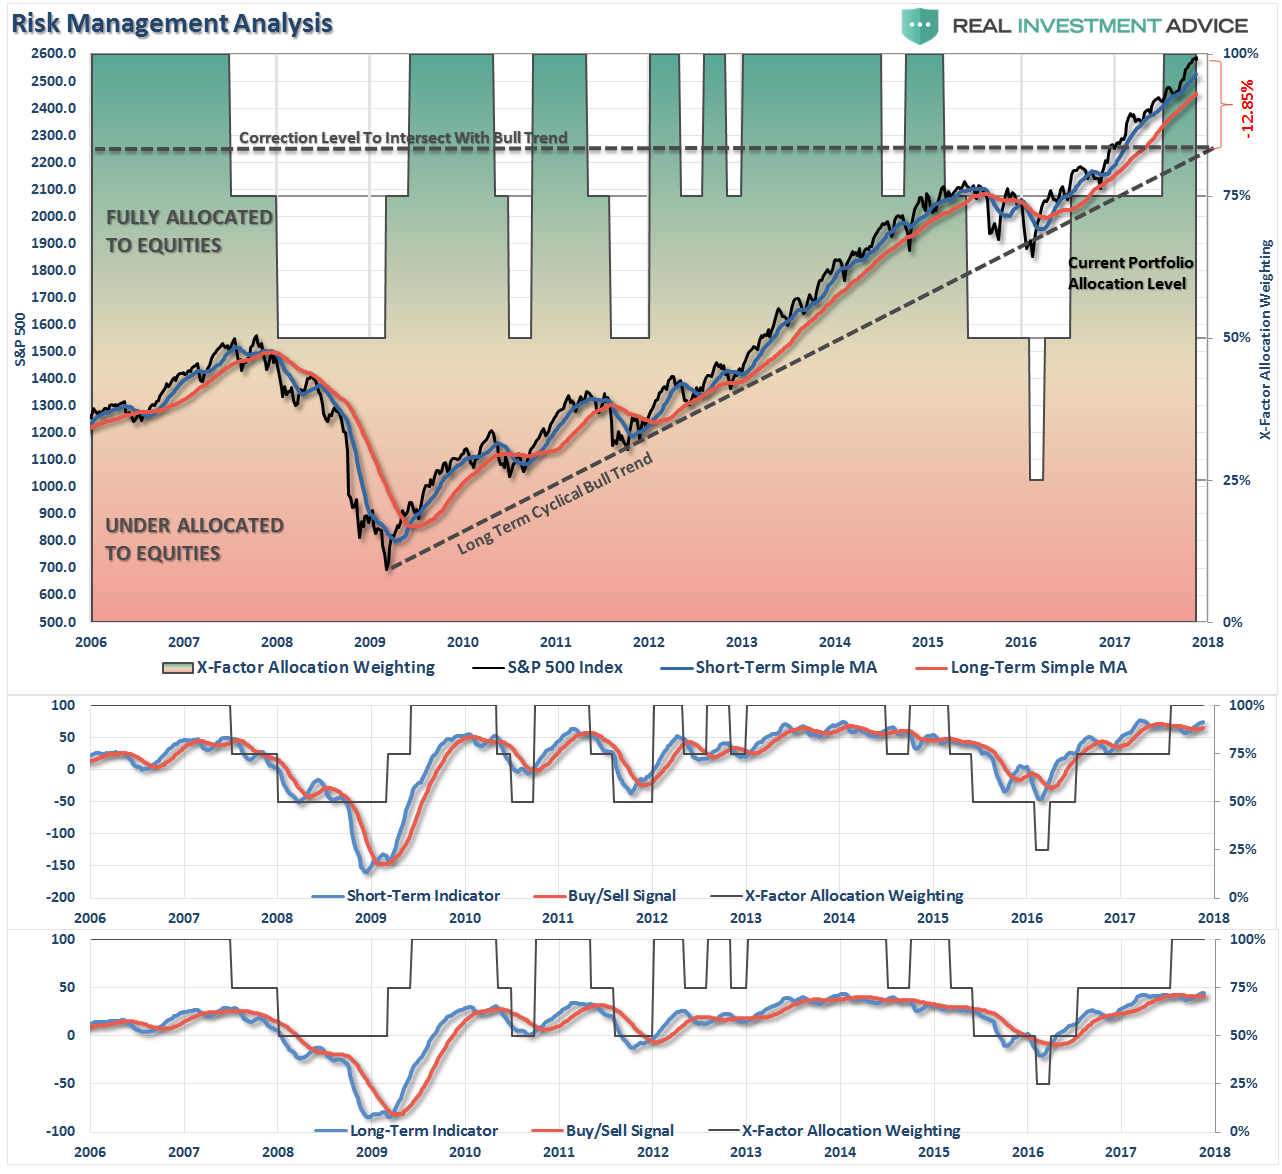
There are 4-steps to allocation changes based on 25% reduction increments. As noted in the chart above a 100% allocation level is equal to 60% stocks. I never advocate being 100% out of the market as it is far too difficult to reverse course when the market changes from a negative to a positive trend. Emotions keep us from taking the correct action.

Tax Reform Passes The House
Previously, I stated:
“Last week, markets tumbled a whopping 5-points. No, that wasn’t a correction. #Sarcasm”
I could restate that for this past week. However, without the huge surge on Thursday, the markets would have been significantly lower for the week. Nonetheless, the pop on Thursday keeps the “bulls in the driver’s seat” which keeps portfolio allocations at target levels for now.
Be aware we are heading into a very light, Thanksgiving, trading week. Volatility will likely pick up so if you are concerned about the risks in your portfolios, some rebalancing is advised. However, be cautious about “reacting” to market actions until we can better gauge market action AFTER the holiday period.
We previously recommended rebalancing risks in portfolios by trimming overweight equity exposure but adding to fixed income exposure. With those actions complete, there is nothing to do currently except wait for the next signal to take action.
All NEW contributions to plans should currently be adjusted to cash or cash equivalents like a stable value fund, short-duration bond fund or retirement reserves. We will use these funds opportunistically to add to weightings when corrections occur.
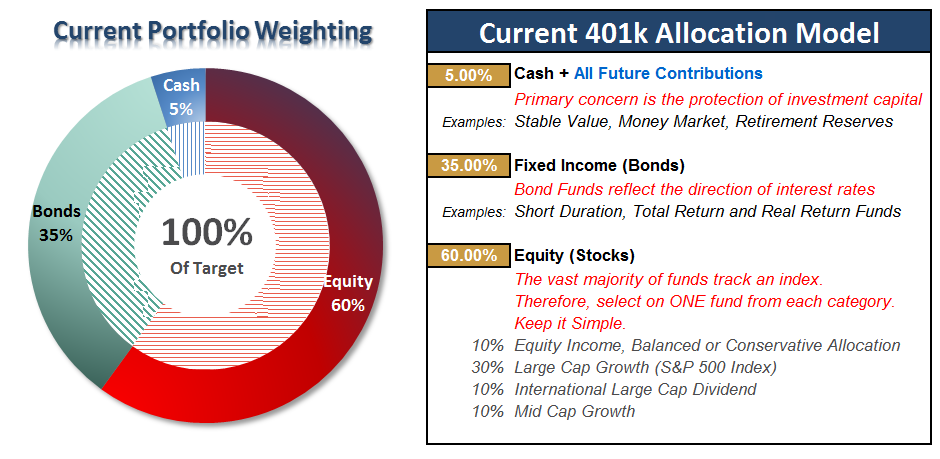
Current 401-k Allocation Model
The 401k plan allocation plan below follows the K.I.S.S. principle. By keeping the allocation extremely simplified it allows for better control of the allocation and a closer tracking to the benchmark objective over time. (If you want to make it more complicated you can, however, statistics show that simply adding more funds does not increase performance to any great degree.)
401k Choice Matching List
The list below shows sample 401k plan funds for each major category. In reality, the majority of funds all track their indices fairly closely. Therefore, if you don’t see your exact fund listed, look for a fund that is similar in nature.

Disclosure: The information contained in this article should not be construed as financial or investment advice on any subject matter. Streettalk Advisors, LLC expressly disclaims all liability in ...
more

