
The Fed Dots Vs. The Bond Market
In the two days since the Fed raised interest rates for the first time in nine years and the first time it moved to a tightening bias in eleven years, it has become apparent that many media figures and market strategists are misreading, or at least misinterpreting, the Fed dots, in my opinion. The most recent iteration of the Fed’s “dot plot” forecast indicate that, when FOMC member opinions are averaged, the consensus opinion calls for a 1.375% Fed Funds Rate. Based on journalistic commentary and investment strategy I have read, the average opinion is being misunderstood as a Fed target for the Fed Funds Rate. This is not the case. The Fed “dots” are merely personal opinions of various FOMC members. They are in no way “policy targets.” Not only are they not targets they are widely disparate.
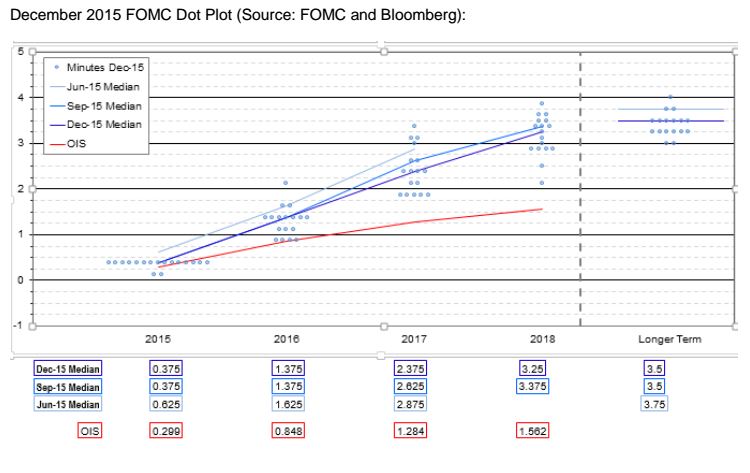
As can be seen, four FOMC members believe the Fed Funds Rate should be below 1.0% by the end of 2016. Three members believe that Fed Funds should be 1.0%. Seven members believe a 1.375% Fed Funds Rate might be appropriate, two believe a 1.75% Fed Funds Rate might be appropriate and one FOMC member believes a Fed Funds Rate of just over 2.0% might be appropriate. As you can see there is nothing “policy” about the Fed’s dots. Even so, why does the market have such little confidence that the Fed dots provide valuable guidance for future policy rates? A look at past Fed dots will explain why.
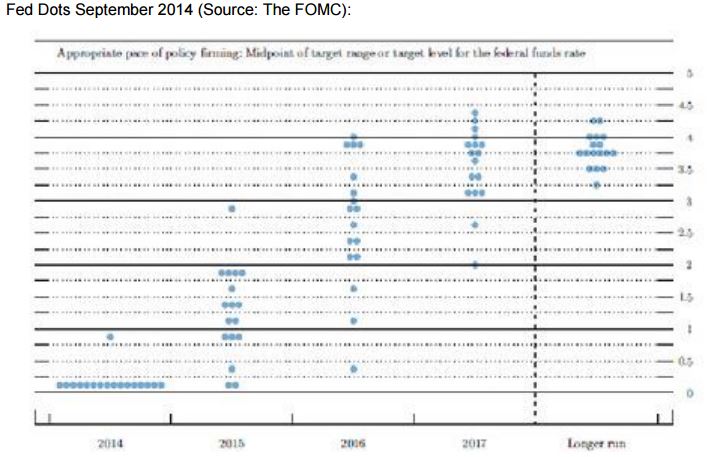
In September 2014, the Fed Dots indicated that, by now (the end of 2015) two members saw the Fed Funds Rate at 0.00% to 0.25%. One member saw it at about 0.375%. Three members saw the Fed Funds Rate at 0.75%. Two members saw Fed Funds at 1.00%. Three members saw the Fed Funds Rate at about 1.25%, one at 1.5% and four saw the Fed Funds Rate at 1.75%. This works out to an average of 0.95%. As we now know, the Fed “dots” were too high. The Fed dots widely missing expectations is not a recent phenomenon. Let’s look back to September 2013.
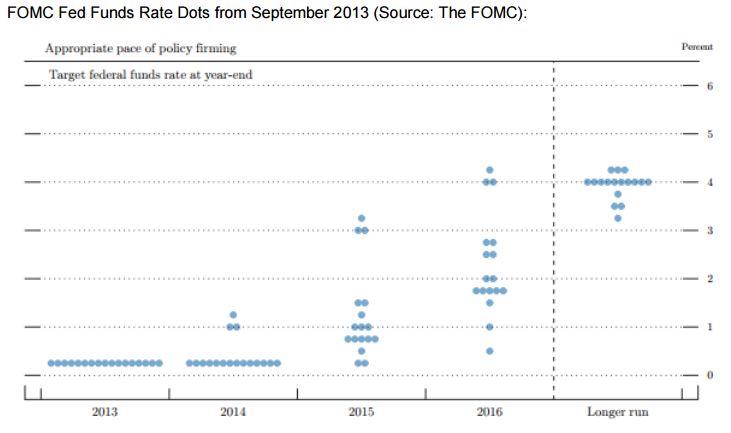
Doing some quick math indicates that the consensus forecast for Fed Funds at the end of 2015 (now) was about 1.25%. Again, the Fed was overly optimistic. What was behind the Fed dots misses? It was the Fed’s inflation forecast. In both the September 2013 and September 2014, the Fed forecast a Core PCE inflation rate of 2.0% by the end of 2015. At the present time, Core PCE is running at 1.3%. Remember, this is the inflation rate backing out oil prices.
It is inflation which is at the center of the bond market’s disagreement with the Fed’s dots. The bond market does not see inflation heating up in the coming year. A strong dollar, a global slowdown, narrowing corporate profit margins and commodities prices which are likely to remain on the low side (even if they rise somewhat) all augur for modest inflation pressures. Thus, unless one is a slave to the Taylor Rule (which has not worked in decades) and expects wage growth to translate into inflation (if we even see wage growth beyond the mid-2.0%s), it is difficult to envision inflation forcing the Fed’s hand to tighten at a pace which would result in a Fed Funds Rate north of 1.0% by the end of 2016.
Notice I said that the bond market disagrees with the Fed dots. The bond market is not in disagreement with neither the FOMC statement nor Fed Chair Yellen’s press conference comments. This is not surprising because, in the past several years, Fed officials have told market participants to pay more attention to the Fed’s statements rather than the dots. That is precisely what the bond market is doing.
It is important to mention that recent research conducted by Fed staffers (economists, analysts, etc.) point to likely conditions better resembling what the bond market is pricing in than what for what the dots suggest.
Last Wednesday, the FOMC and Fed Chair Yellen told the markets that the pace of tightening would be “gradual” and would be neither “mechanical” nor “evenly spaced.” Ms. Yellen also made it clear that the course of tightening is subject to change, based on incoming economic data. Thus, when the bond market looks at global economic conditions and takes the Fed at its word (rather than its dots), it prices in a gradual and shallow path for Fed tightening.
As such, the bond market is probably not as “wrong” as some dot followers opine. It is the following of dots which would have led investors, advisors and portfolio managers down the wrong path during the past several years. Doing the same will probably deliver similar results in the near future. If the dots have been inaccurate (certainly less so than the FOMC language), why do so many strategists follow the dots? I believe it is that the dot plot can be plugged into models more easily than can Fed comments.
During a CNBC interview last Thursday, former Dallas Fed President, Richard Fisher, quoted former Chinese statesman, Deng Xiaoping who stated: “To cross a river, you must feel each stone with the soles of your feet.”
There is much wisdom in this statement and it applies well to monetary policy setting and investment strategy.
Rules and models can help, but one must take into account what is actually happening at the time. Ignoring the slippery rocks can drown you. Thus, focusing on the dots, rather than what the Fed is actually saying is probably not the best strategy.
Judging by the bond market’s behavior since the FOMC meeting, it appears much more focused on the economic data to which the Fed is likely to react. There is an old axiom which states: “Don’t fight the Fed.” It might be that following the dots rather than the Fed’s statement is actually fighting the Fed. I prefer this axiom: “Don’t fight the bond market.” Over the years, investors, central bankers and elected officials have tried to fight the bond market, often with less than positive results.


