
The Divergence Of Volatility
This week has been extremely interesting. On one hand, price volatility surged while measures of market volatility actually declined. Take a look at the chart below:
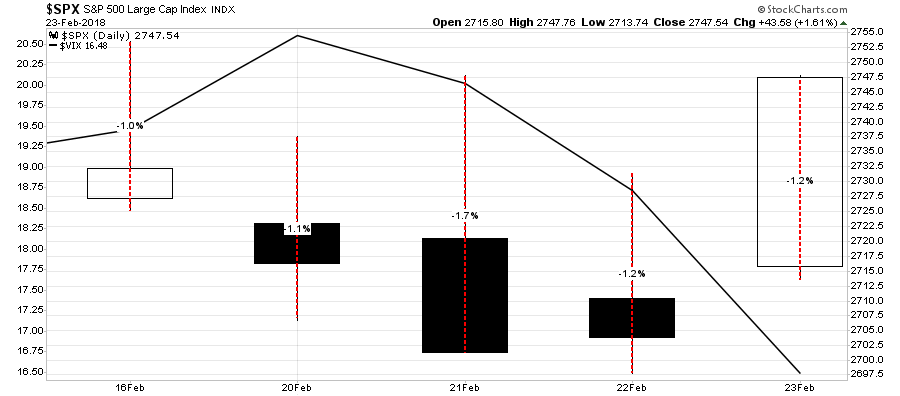
While the market did rise 0.55% last week, prices swung wildly in excess of 1% daily.
For me, that is volatile.
However, despite the wild swings in the market, the market “fear gauge,” as measured by the VIX plunged from its recent highs back towards its lows.
Investors have been quick to dismiss the recent “rout” as another “buy the dip”opportunity and have jumped back onto the “short-volatility” trade that blew up spectacularly just two weeks ago.
Memories are indeed short in a “bull market.”
On Tuesday I updated our market analysis as follows:
“This morning, the market opened back below the 50-dma. While this is concerning, and keeps our short-hedge in place for now, it is where we finish this trading week that will determine out next positioning changes.”
We use WEEKLY data to strip out the daily price volatility, like that shown above, which can lead to emotionally driven investing mistakes. Weekly data slows things down so that we can more accurately assess the message the market is trying to deliver. Therefore, we have to wait until the end of the trading week to make important allocation decisions and changes.
I have questioned over the last couple of weeks exactly how much volatility the Fed would allow before stepping into the fray to keep the markets stable.
We now know it is roughly a 10% decline.
Unsurprisingly, after two days of failed rally attempts, it was time to unleash both Bill “Say Anything” Dudley and Fred “The Pumper” Rosengren Friday morning to tell the markets what they have longed to hear.
Specifically were the comments about QE being “useful to have in the toolkit for those times when the short-term interest rate tool may not be available,” adding that the Fed is “quite likely” to require large-scale asset purchases again because real rates will remain low due to slow productivity and labor-force growth. They also added that “if LSAPs are indeed not effective, then the Fed may need to take other measures.” (Zerohedge has the complete article.)
In other words, despite the rhetoric to the contrary, the Fed isn’t going away…ever!
Of course, as stated, that was all the market needed to hurl higher into the close on Friday closing solidly above the 50-dma.

As stated on Tuesday:
“In order for us to fully remove hedges, the market must close above the 50-dma on Friday.”
It did, and we closed out the last of our short-market hedges and are now back to being fully long-biased in portfolios.
With the market still in the seasonally strong time of the year, there is a high probability the market will make an attempt at the recent highs and potentially even go to new highs. As we noted two weeks ago, despite the “sell-off,” the markets did not “do” anything wrong. No critical trend lines, or supports, were violated and the bullish trend remains intact.
However,it also doesn’t mean we are completely “out of the woods” just yet either. There is a risk the market could reverse next week keeping prices confined within the bullish trend channel. A failure at the trend line, which would coincide with a break below the 50-dma, would likely lead to a retracement back to the 200-dma which is currently running along the bottom of the bullish-trend channel.
Here is what we are looking for:
Bullish
- If the market can break above current resistance, equity exposure can be added to portfolios for a push back towards previous highs.
- That push back to previous highs will also be a breakout of the already accelerated bullish trend. While bullish in the short-term, such a rally will likely be limited in its rise as overbought conditions are already returning very quickly.
- The target for a rally from current levels puts the market in the 3200 range.
Bearish
- On the bearish side, a failure at current resistance levels would likely lead to aretracement to the 200-dma. Such a correction would also trigger the MACD sell-signal which is already at historically high levels. That “sell signal” will put additional downward pressure on the market.
- As long as the market holds at the rising bullish trend and 200-dma, the bullish backdrop remains intact keeping portfolios weighted towards equity exposure.
- However, if the market breaks below those “critical support” levels, as noted above, the risk of a deeper correction rises. Such a break will lead to increased hedging and a reduction of equity risk in our portfolio models.
- A break of that critical support will likely lead to a retest of the longer-term bullish trend around 2250 which would be a 22% decline from recent highs and an “official bear market.”
- A break below 2250 will likely coincide with the onset of the next recession and is an entirely different portfolio management strategy.
While the “Great Bear Market Of 2018” may indeed be behind us, for now, it did NOT resolve the longer-term overbought, overvalued and overly bullish conditions for investors.
The recent rally has quickly relieved the pervasive “panic” of the media which existed just two weeks ago, and the “perma-bulls” have emerged back out of their bunkers. However, the risks of a larger correction are still present. We still highly recommend investors rethink levels of risk exposure in portfolios and take some actions.
I am reprinting the guidelines from last week.
Step 1) Clean Up Your Portfolio
- Tighten up stop-loss levels to current support levels for each position.
- Take profits in positions that have been big winners
- Sell laggards and losers
- Raise cash and rebalance portfolios to target weightings.
Step 2) Compare Your Portfolio Allocation To Your Model Allocation.
- Determine areas requiring new or increased exposure.
- Determine how many shares need to be purchased to fill allocation requirements.
- Determine cash requirements to make purchases.
- Re-examine portfolio to rebalance and raise sufficient cash for requirements.
- Determine entry price levels for each new position.
- Determine “stop loss” levels for each position.
- Determine “sell/profit taking” levels for each position.
(Note: the primary rule of investing that should NEVER be broken is: “Never invest money without knowing where you are going to sell if you are wrong, and if you are right.”)
Step 3) Have positions ready to execute accordingly given the proper market set up.
A Bond Short-Squeeze Coming
by Jesse Colombo
Rising U.S. interest rates have been the main topic of discussion among financial market participants over the past several months. The mainstream narrative goes like this: “the economy is doing quite well, unemployment is low and job growth is steady, the housing market is improving, and interest rates will continue to rise to reflect this new reality.” Traders and investors have been buying this narrative hook, line, and sinker and have been dumping Treasury bonds, which has sent yields higher.
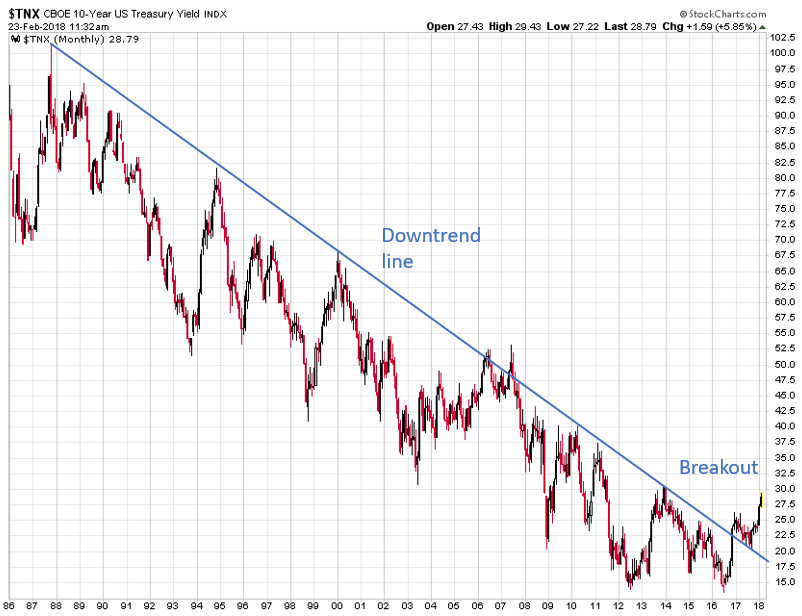
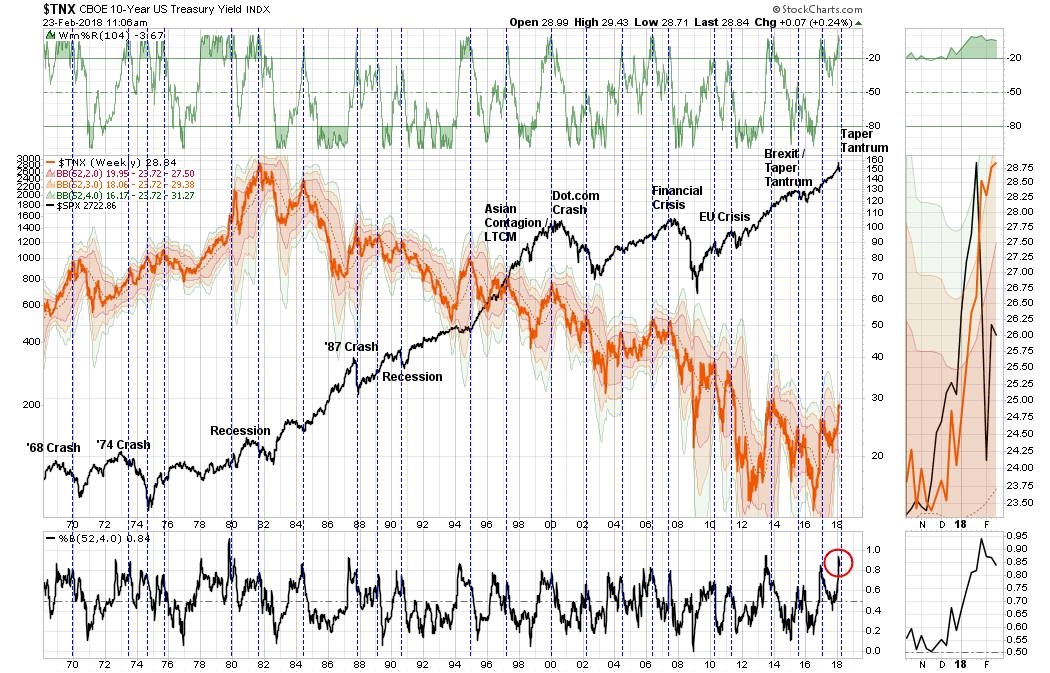
As the chart below shows, the U.S. 10 Year Treasury yield has broken above a downtrend line that goes all the way back to 1987. Many investors and traders are viewing this as more evidence of higher future interest rates and brighter days for the economy. While this breakout should be watched closely, there are some caveats to keep in mind: a breakout from a downtrend line doesn’t usually signal the imminent start of a bull market, but rather a change from a downtrend to a sideways trend. In addition, investors should be aware of the risk of a “head-fake” or false breakout, which is what happened in 2006 and 2007. Back then, investors believed that the economic boom was sustainable and that higher rates were inevitable, but those higher rates put an end to the U.S. housing and credit bubble, which led to a bear market in equities and a continuation of the bull market in U.S. Treasury bonds.
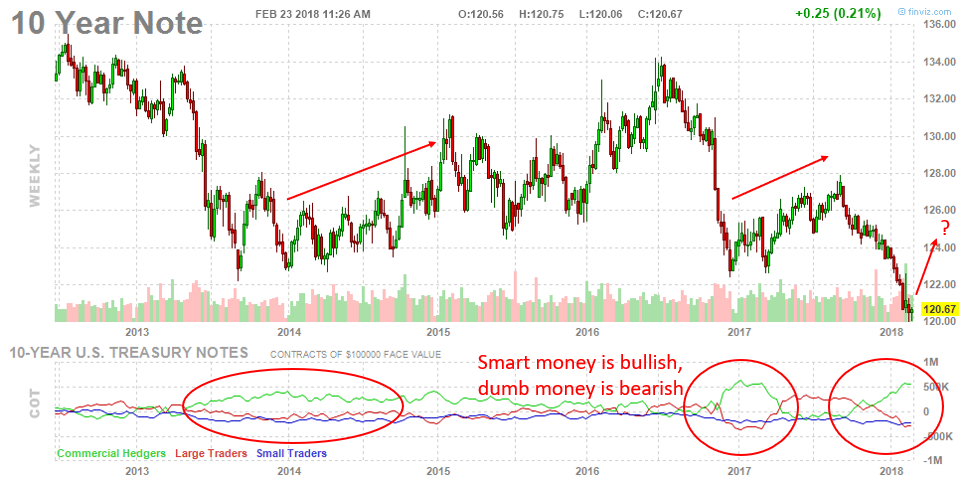
Interestingly, the market participants who are driving the current surge in interest rates (and falling bond prices) are considered to be the “dumb money.” The chart of 10-year Treasury note futures shows that “dumb money” (large & small traders) are bearish on bonds and bullish on yields, while the “smart money” (commercial hedgers) are quite bullish on bonds and bearish on yields. The last two times these groups positioned themselves in a similar manner, bonds rebounded and yields fell.
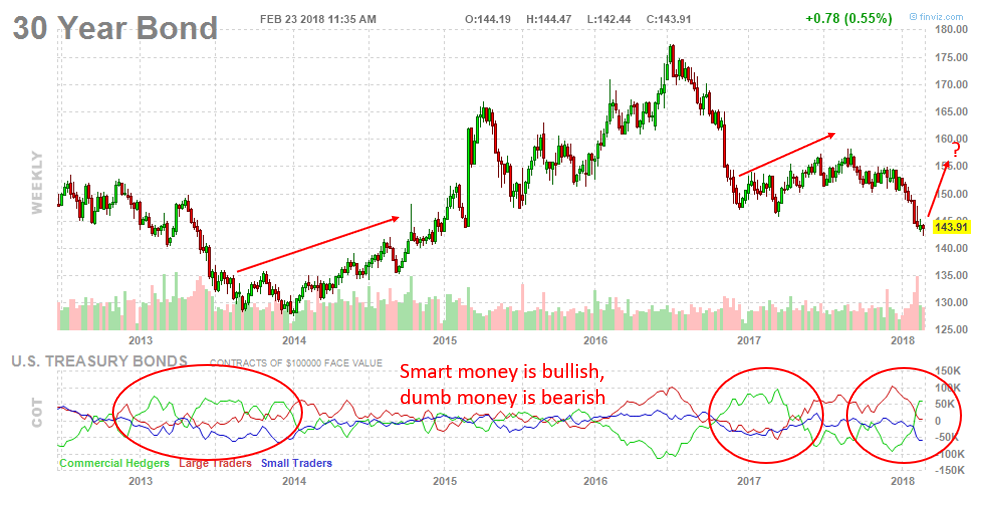
It’s not just the 10 Year note: the smart money is bullish on 30 Year Bonds (and bearish on yields), while the dumb money is bearish on 30 Year Bonds (and bullish on yields).
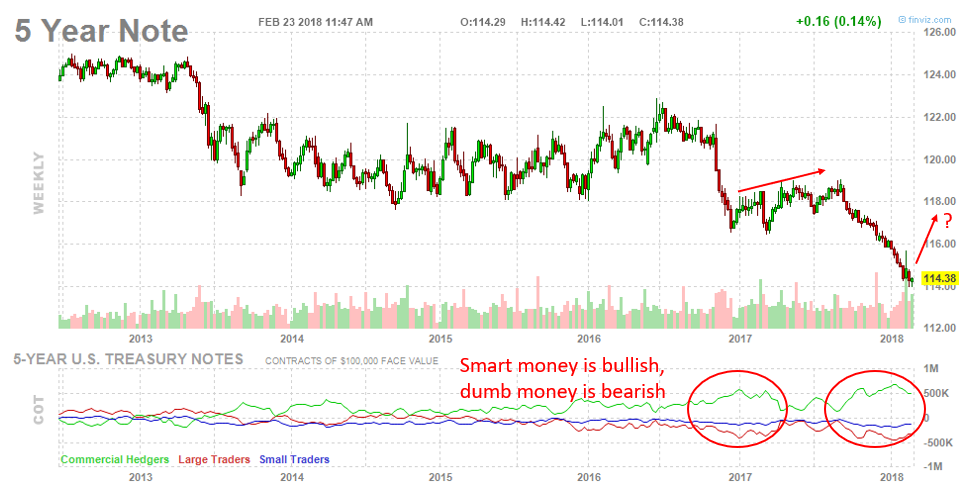
The smart money is also bullish on 5 Year notes (and bearish on yields), while the dumb money is bearish on 5 Year notes (and bullish on yields).
In addition, as Lance has shown, every time U.S. 10-year Treasury yields became technically overbought in the last couple decades, it heralded a downward move:
While I’m not recommending to fight the trend, I believe investors should be aware of whether they’re trading like the “dumb money” (or “the crowd”) or “smart money.”Right now, “the crowd” believes that much higher rates are inevitable because they’re ignoring the fact that our economic recovery is not as healthy as it seems and that stocks are incredibly overvalued. “The crowd” will soon experience a rude awakening that this economic boom is not what it appears to be, which will likely cause them to seek the relative safety of Treasuries once again.
The Retirement Apocalypse
by John Coumarianos
Financial Advisor Larry Swedroe recently wrote an essay called “The Four Horsemen of the Retirement Apocalypse” that should be required reading for anyone embarking on retirement and all advisors helping retirees. Basically, retirees, whether they and their advisors realize it or not, are staring four problems squarely in the face: historically high stock valuations, low bond yields, increased longevity, and increasingly expensive health care.
Low prospective returns, big prospective expenses
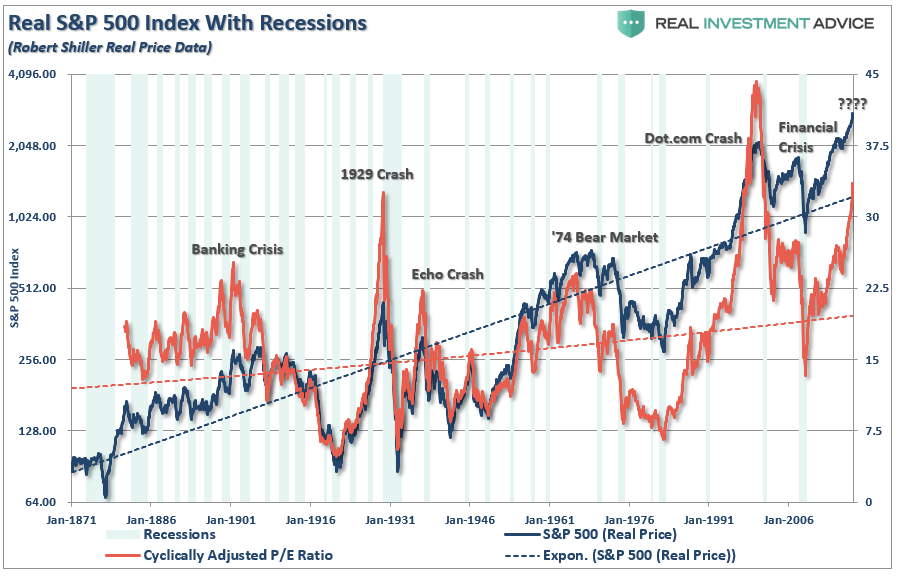
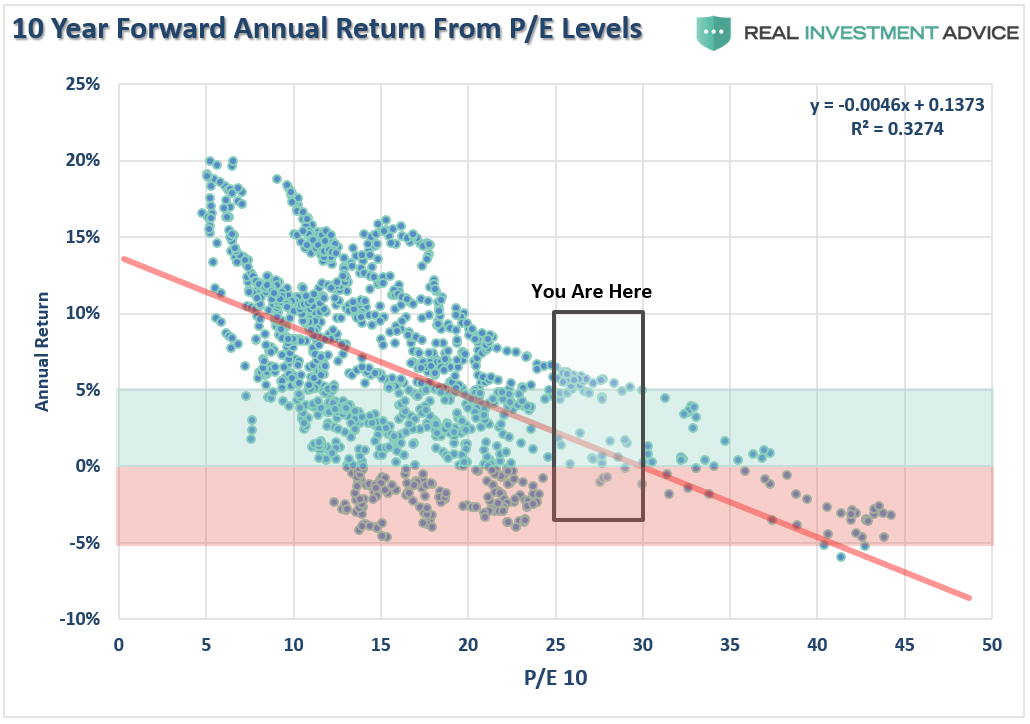
First stock valuations are high. The best gauge of the stock market’s valuation is the Shiller PE – current price relative to the past decade’s worth of real, average earnings. This is also called the “CAPE” or cyclically adjusted PE since it relies on a full decade’s, or what should be an economic cycle’s, worth of earnings. Its long-term average is under 17, and it’s currently over 30.
It has admittedly been over 20 for most of the past quarter-century, which means the average may be creeping up. After all, the today’s economy is different from the one in, say, the late 1920’s when electric utilities were the hot technology stocks. But, if there is a new normal, it’s likely not over 20.
A low-30s CAPE means a likely future real return of around 3% or a nominal return of around 5% from U.S. stocks. That’s decidedly subpar, or below, the 10% many advisors quote to their clients. Stocks have returned 10% or so over the last century, but they have endured periods of low returns such as from the mid-1960s to the early 1980s. Given the current valuation, it’s difficult to envision a stellar period for stock returns.
Let’s move from Swedroe to Jack Bogle for a moment. Bogle has another way of looking at stocks. Take the current dividend yield – around 2% — and add historical earnings-per-share growth – 4%-5%. That gets you to 6% or 7%. But then Bogle demands a speculative component to the valuation, which consists of estimating the future P/E ratio. Bogle thinks it’s wiser for investors to assume it will be meaningfully lower than it is today. All of this means stocks will likely produce a 4% real return, according to Bogle – only slightly higher than Swedroe’s 3% estimate.
Any way you look at stocks, it’s difficult to get anywhere near their long-term historical 6%-7% real return or 10% nominal return for the next decade. Only heroic growth and/or valuation assumptions get you there. Stocks can stay at a Shiller PE of above 30; anything is possible. But nobody should be baking that into their retirement assumptions.
Finally, foreign stocks are priced for better returns – but not much. Basically, stock investors don’t have anywhere to turn for the returns they’ve come to expect.
Let’s return to Swedroe and bonds. The 10-year U.S. Treasury is yielding a little less than 2.9% as I write. And Swedroe clearly takes the current yield-to-maturity of bonds to be a good approximation of their return. The iShares Investment Grade Corporate Bond ETF LQD is yielding 3.67%. Investors can’t get to 4% from here. Neither can they with foreign bonds.
Junk bonds are yielding a little more than 5%, but when historical loss rates (defaults and recoveries) are baked in, investors will be lucky to make more than they would on a 10-Year U.S. Treasury on them. And that means junk bonds are likely the worst bet in the bond world right now. Advisors pushing them on clients are arguably committing a kind of malpractice. (That’s my opinion, not Swedroe’s more diplomatic one, though he clearly also doesn’t think junk’s reward is worth its risk.)
Similarly, advisors baking in 7%-8% returns on a balanced portfolio are giving their clients faulty retirement plans. A financial planner who can’t make adjustments to 100-year return figures to fit the current moment, isn’t really a planner.
Next, Swedroe moves to longevity. Our current situation is much different than it was decades ago when people often used to collect social security for only a few years before dying. Now, as Swedroe says, “for a healthy couple, both 65, there is a 50% chance one spouse will live beyond 92 and a 25% chance one spouse will live beyond 97.” Here Swedroe praises deferred income annuities or what he calls “longevity annuities,” though it’s true that someone buying them now locks in a low rate of return.
The fourth horseman of the retirement apocalypse is increasing healthcare costs, especially those associated with dementia, the likelihood of which doubles every five years after 65. According to Swedroe, “the average out-of-pocket medical expenses a 65-year-old couple can expect to incur during retirement is estimated to be in the mid-$200,000 range to somewhere in the mid-$400,000 range. And that’s the average. Obviously, some will incur far greater expenses.”
Stop extrapolating historical returns, and consider some alternatives
After a statement about a possible fifth apocalypse – the viability of Social Security and Medicare – Swedroe gives some advice to financial planners. First, don’t extrapolate century-long historical returns. Instead, understand where valuations and yields are now on securities. Second, get some foreign stock exposure. When considering how much, start from the observation that the U.S. stock market is about 50% of the global stock market. Third, consider a deferred annuity. .Fourth, explore long-term care insurance, and make sure you’re taking proper account of longevity risk. Last, Swedroe recommends an alternative bond portfolio consisting of four funds in strategies previously available only to institutional investors to boost yield for those investors who simply need the extra yield. He thinks they are superior to junk bonds, and we’re inclined to agree that almost anything is.
We’ll be examining these funds in future posts. For now, investors and advisors should consider Swedroe’s remarks about low returns and high expenses in retirement carefully.
Market & Sector Analysis
Data Analysis Of The Market & Sectors For Traders
S&P 500 Tear Sheet
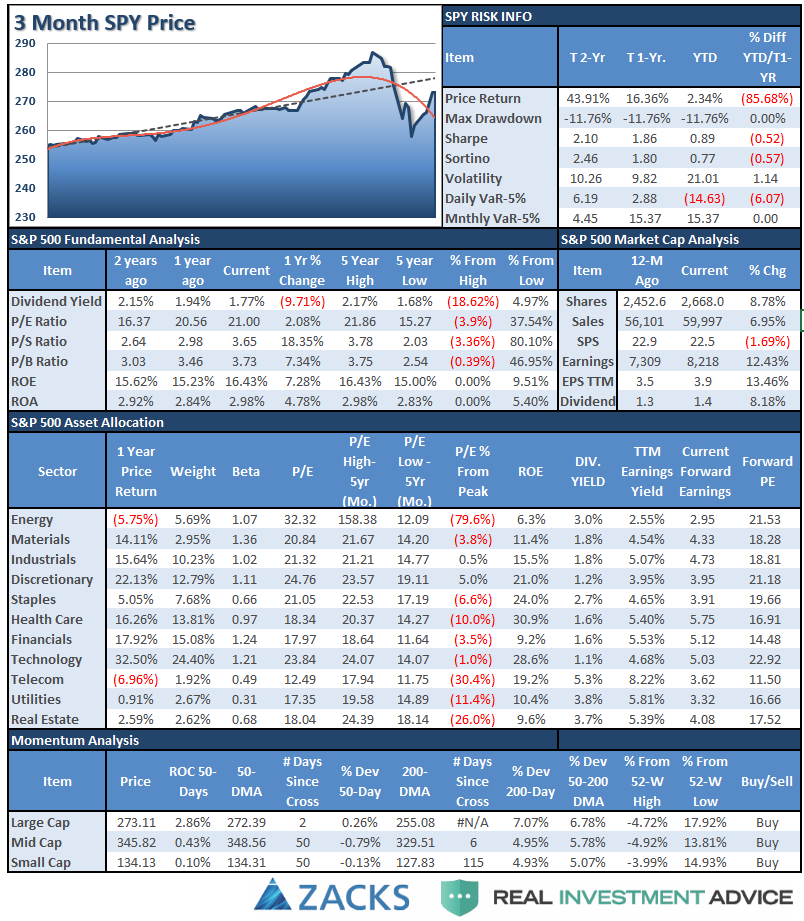
Performance Analysis
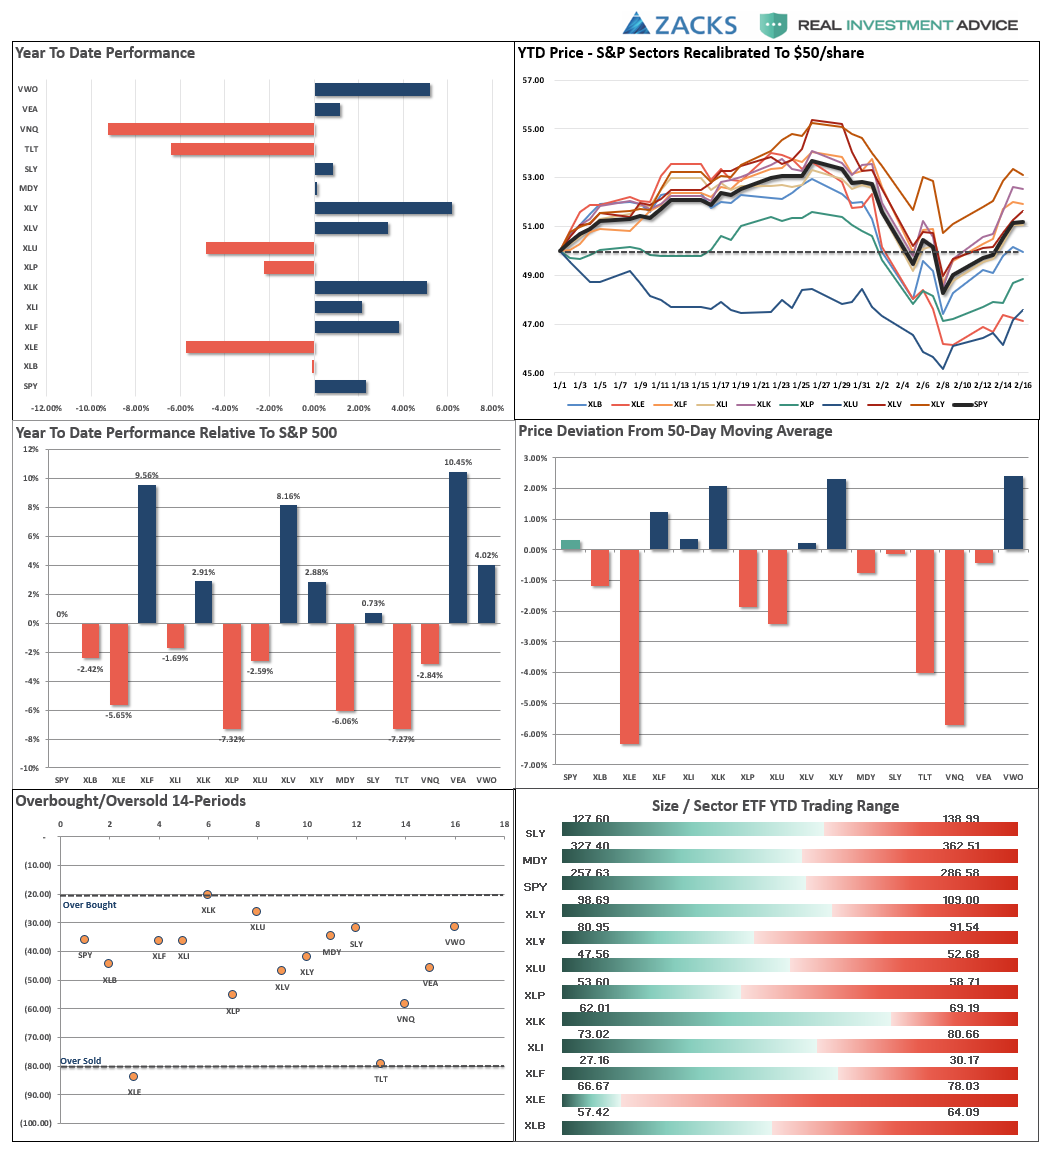
ETF Model Relative Performance Analysis

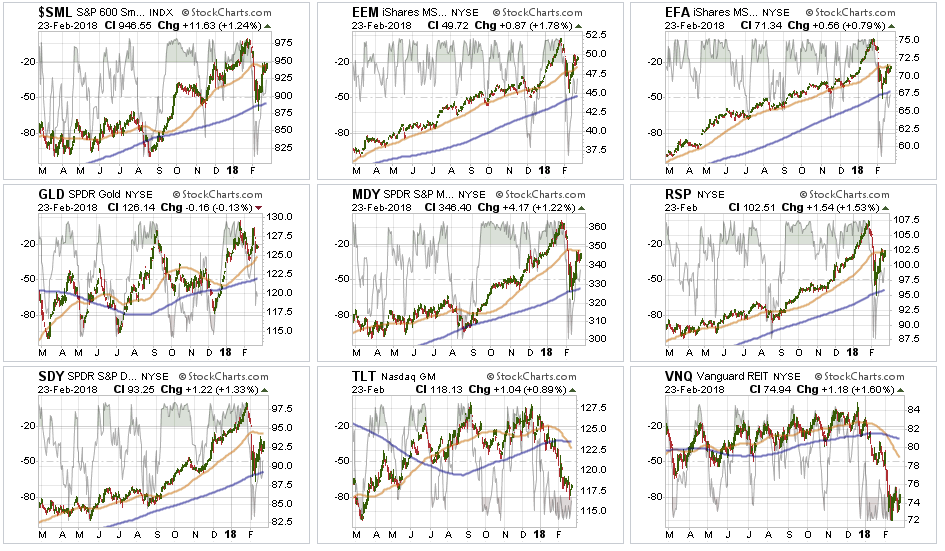
Sector & Market Analysis:
As expected, the markets did indeed bounce last week. But the bounce was not uniform across all sectors and markets, so let’s take a closer look.

Discretionary, Technology, Industrials, Materials, and Financials each regained their respective 50-dma which sets these sectors up for a retest of their old highs. While these sectors have the most bullish setup at the moment, rebalancing portfolio weights is still advisable.
Health Care is currently testing resistance at the 50-dma and while the sector did hold its 200-dma, which maintains its bullish trend, it underperformed on the recent market rally. This lag may be temporary, but it will be worth watching closely. Rebalance overweight positions for now.
Energy, Staples, and Utilities performed substantially worse during the decline and rebound in the markets which raises concerns over their positioning. While we suspect a “rising tide will lift all boats,” we will be for an opportunity to reduce holdings in these sectors and underweight them in portfolios for the time being.
Small Cap, Mid Cap, International, Equal Weight, and Dividend indices are all wrestling with their 50-dma. While the S&P 500 was able to clear that resistance last week, as noted above, that recovery has been focused in the heavy weighting of Technology. It will be important for the rest of the market to catch up with the S&P over the next few days if the broader bull market is going to continue.
Emerging Markets and Gold are both above their 50-dma and are near recent highs. We remain long emerging markets in portfolios. We currently do not have exposure to gold, but if you are already long the metal, the backdrop is bullish and improving.
Bonds and REITs showed some signs of life last week as the Fed made it clear they are going to be fully ready with additional QE in the future. This removed the “fear” of a lack of a buyer for bonds, and interest rate sensitive sectors bounced. We will underweight holdings on any failed rally to resistance.
Sector Recommendations:
The table below shows thoughts on specific actions related to the current market environment.
(These are not recommendations or solicitations to take any action. This is for informational purposes only related to market extremes and contrarian positioning within portfolios. Use at your own risk and peril.)

Portfolio Update:
On Friday, we closed out the last of our “short market hedge.” The position was not a“bearish bet” on the market, but rather a “volatility reduction” of our portfolio longs. With the market back above the 50-dma we are going to allow our long-positions to run unconstrained for the time being but remain highly vigilant over the macro risks which remain.
Next week, we will look to rebalance positions to target weights, based on allocation models, if the market can hold above the 50-dma.
Despite the more bullish underpinnings in the short-term, the market still has a lot of work to do over the coming week. Furthermore, the risk of a continuing corrective process remains which keeps us vigilant. Currently, everything remains within our longer-term tolerance bands for risk controls. While corrections certainly do not“feel” good, it is important we don’t let short-term pickups in volatility derail longer-term investment strategies.
The market rally over the last two weeks quickly relieved a lot of the pressure on positions which gives us time to logically think about our next set of actions. As stated above, we are highly concerned about remaining market risk and remain focused on capital controls.
THE REAL 401k PLAN MANAGER
The Real 401k Plan Manager – A Conservative Strategy For Long-Term Investors
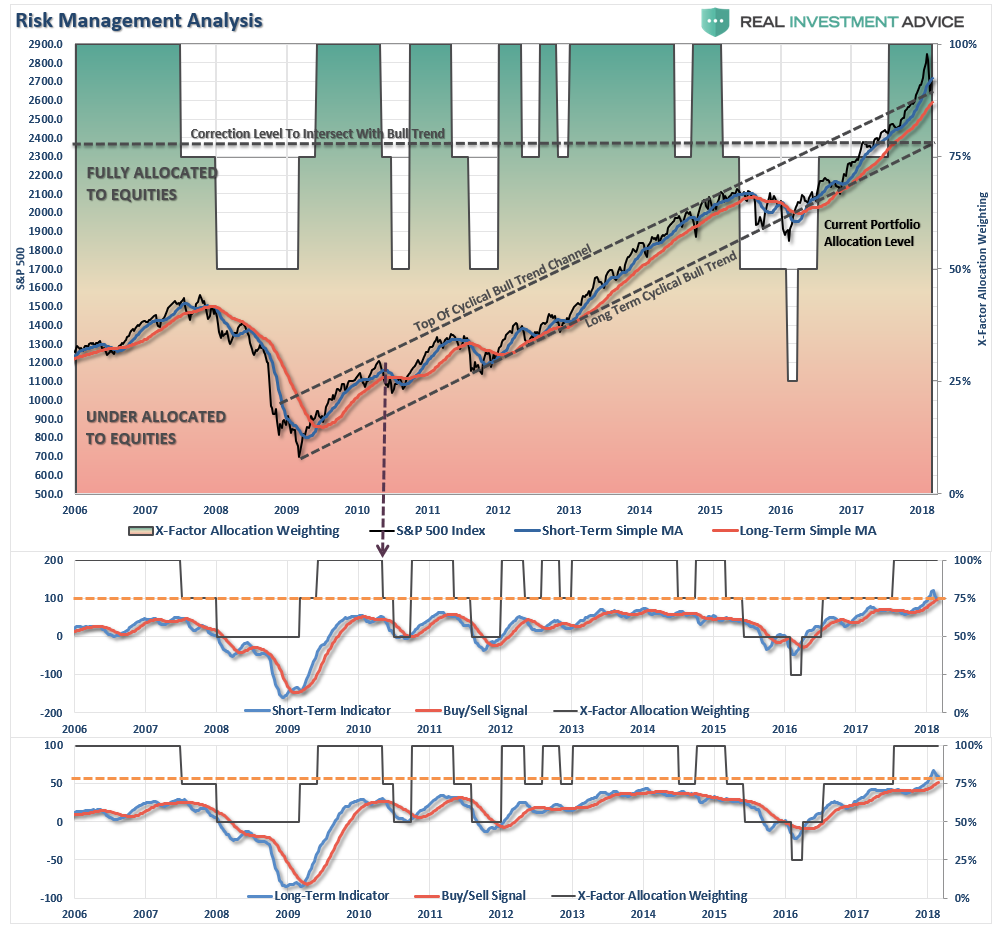
There are 4-steps to allocation changes based on 25% reduction increments. As noted in the chart above a 100% allocation level is equal to 60% stocks. I never advocate being 100% out of the market as it is far too difficult to reverse course when the market changes from a negative to a positive trend. Emotions keep us from taking the correct action.

Patience Pays
As we discussed over the last two weeks, keeping perspective is always important. The current correction has only retraced to the top of the longer-term upper bullish trend line. As I have discussed previously, the massive extension above the longer-term trends HAD to be corrected. Furthermore, BOTH of the lower indicators remain firmly on “buy” signals which keeps allocations weighted to the long-side.
While the recent correction could have been, and potentially still could be, the beginning of a larger corrective process, so far it hasn’t been the case. As I laid out in the main body above, we are removing hedges and allowing portfolios to run unconstrained for now. How the market performs over the next week, or two, will determine our next major course of action.
For now, remaining patient paid off, BUT it is still too early to begin layering on additional risk until we have confirmation the recent correction is over.
Rebalance bond holdings back to target allocations but continue adding All NEW contributions to cash or cash equivalents. We will use these funds opportunistically to rebalance equity weightings when the “dust” settles from the recent correction.
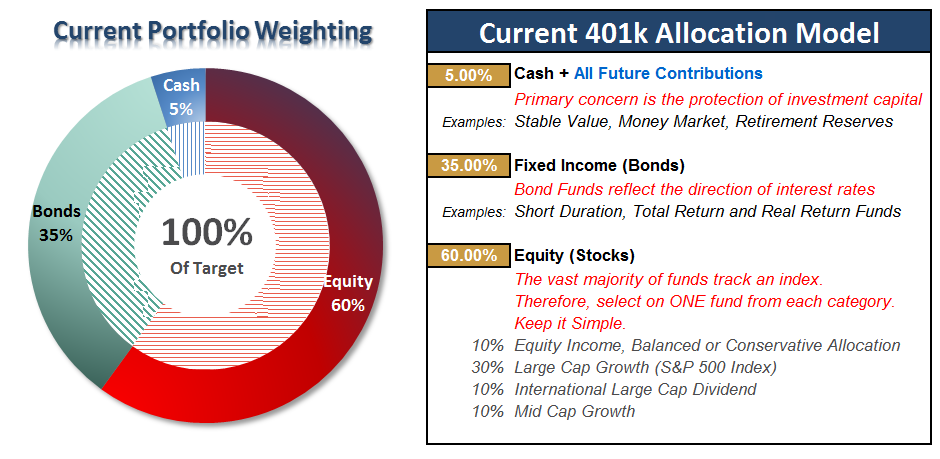
Current 401-k Allocation Model
The 401k plan allocation plan below follows the K.I.S.S. principle. By keeping the allocation extremely simplified it allows for better control of the allocation and a closer tracking to the benchmark objective over time. (If you want to make it more complicated you can, however, statistics show that simply adding more funds does not increase performance to any great degree.)
401k Choice Matching List
The list below shows sample 401k plan funds for each major category. In reality, the majority of funds all track their indices fairly closely. Therefore, if you don’t see your exact fund listed, look for a fund that is similar in nature.

Disclosure: The information contained in this article should not be construed as financial or investment advice on any subject matter. Real Investment Advice is expressly disclaims all liability in ...
more

