
R.I.P. Bond Bull!!!!!
I had to add all the !!!!! because as in the mainstream media, nftrh.com wants to get your attention and get you all riled up.Here’s the headline (from Bloomberg, which I actually like a lot more than the average financial media backwash)...
[edit] Just yesterday we highlighted the same MSM entity publishing some very sound words by Barry Ritholtz on a related topic.
R.I.P. Bond Bull Market as Charts Say Last Gasps Have Been Taken
So the charts say the last gasps have been taken, do they?Oooh, the charts…
Well, I am a chart nerd and I tell you for the 1000th time, beware impressive sounding men and women bearing charts and lingo.When their forecasts fail to prove out, they have long-since vanished into the ether and moved on, not held to account.Not to unduly pick on Louise Yamada, but she is a financial media rock star (like Druck, Gross, etc.) and hence, very publicly open to criticism.As for her charts, she is among a legion of paint-by-numbers TA’s trotted out by the media as well.She may well be a skilled TA, but this article does not show that in the least.
For Louise Yamada, who has been advising clients on how to invest based on what she sees in historical price patterns for almost four decades, the answer is crystal clear.
“The bull run is definitely over” after 10-year yields pierced 2.5 percent, said Yamada, who heads her namesake technical research firm in New York and is a chartered market technician. “There will be a very slow multi-year incremental increase in interest rates.”
How do you get a gig advising clients for almost 40 years by drawing a line on a long-term chart and coming up with definiteness, anyway?How do you get a big, fat alarmist Bloomberg headline assigned to your work?By drawing a line from 1981 to present day.That’s how.Presto… you too can be a market seer, with easy to follow instructions included.She notes that a trend line has been broken; period.
“Prices of bonds are going to go down and you are going to lose your capital,” said Yamada, who began her technical forecasting career at Smith Barney under mentor Alan Shaw.
She then goes on to allow fundamental cross-talk to get into the mix with her TA, noting China bond selling and Trumponomic bearishness.
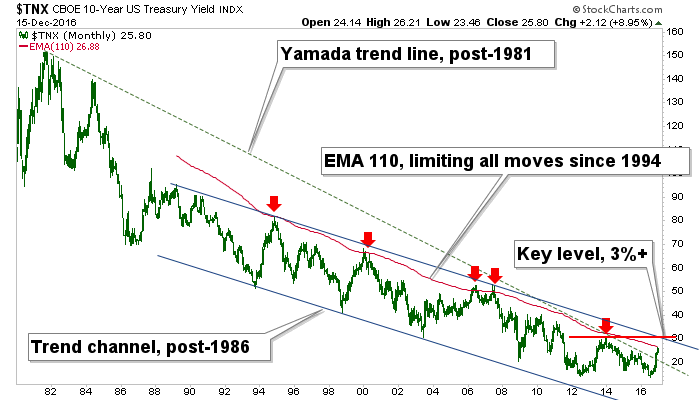
For the sake of doing real TA, why don’t we add a few more data points and tone down the “R.I.P.” and “the bull run is definitely over” stuff?Similar to the 30 year yield ‘Continuum’ I hit you over the head with probably too often, we have a long-term limiting moving average.In the case of the 10 year I’ve used the monthly EMA 110, which halted every spike in yields since 1994.
But let’s take it further and draw a different trend line than Yamada’s; let’s make a post-1986 trend line and then add a parallel lower line to form a trend channel.Taking another step further, let’s note that the high set on the late 2013 GREAT ROTATION!!! (out of bonds and into stocks) hype in the financial media exactly 3 years ago is the decision point on a new trend, and that happens to more or less coincide with the upper channel line.
But first things first, TNX has not even broken the moving average yet (it is 2.69% vs. a current yield of 2.58%).
So, if I take my chart guy hat off and you ask me ‘hey Gaah, do you think the T bond bull is over?’ I’ll tell you that I think there is a pretty decent chance that it is.Much of that is due to the bullish momentum that pulled every bit of dumb money on the planet into Treasuries during another recent media promotion; that would be the global NIRP!!! (negative interest rates) hysterics of last summer.That kind of sentiment thrust could well have set an exclamation point on the great, multi-decade bond bull.
But in the meantime, the Commercial Hedgers, who well anticipated that NIRP was a canard for the public to suck on, are now back to net long positioning similar to 3 years ago, when the financial media were running the ‘Great Rotation’ promo.T bonds then rose for about 2.5 years.

So yes, I think there is a decent chance that the bond bull is over, but the charts most assuredly do not indicate any such thing, yet.And so, the above linked article can only be viewed as media promotion at a time of year when so many people like to make big calls and predictions.
Disclosure: Subscribe to more


