
I started trading in 2009. I don't know if there has been any chart that makes me think, 'The market is in trouble!'....until the last year or so.
Case in point this measure of the Stock to Bond Ratio:
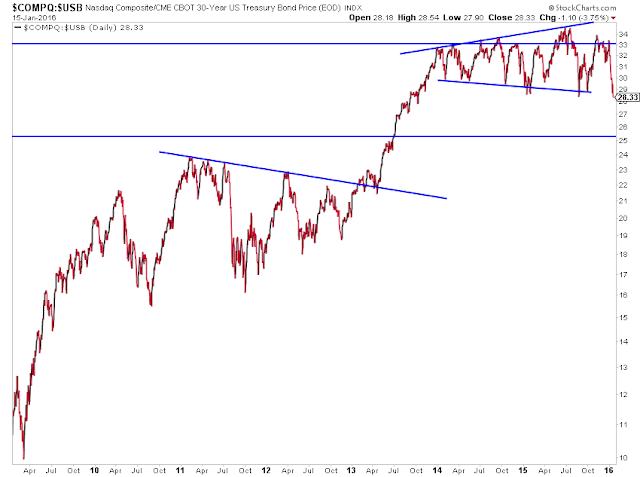
This two year broadening top in the NASDAQ to Long Term US Treasury Bonds ratio HORRIFIES me. For the first time in two years, the ratio failed to make a new high on a bounce. That failure is typically a sign a broadening pattern may actually be a top (or bottom in the opposite case).
This support area is pretty huge and obvious. With such drastic oversold readings, why can't we get some sort of short term bounce here? I don't know, but this chart (combined with many other factors) has me VERY negative in my stock outlook this year 2016. Time will tell how this plays out!
We are on the edge of a rush in asset allocation that may just suggest a crash in equities. Let's face it, the markets are unstable and the relentless selling pressure has not abated. You never know if that's going to happen, but I'd rather be positioned for that in the coming weeks (yes even with just a small chance of happening) than against that.


Comments
Log in or sign up to join the conversation.