
Now What?
It seems like it was just last week, that I discussed the risk of a bigger corrective action in the market.
Because it was.
“This past week, the market tripped ‘over its own feet’ after prices had created a massive extension above the 50-dma as shown below. As I have previously warned, since that extension was so large, a correction just back to the moving average at this point will require nearly a -6% decline.”
“But more importantly, as I have repeatedly written over the last year:
‘The problem is that it has been so long since investors have even seen a 2-3% correction, a correction of 5%, or more, will ‘feel’ much worse than it actually is which will lead to ’emotionally driven’ mistakes.’
The question now, of course, is do you ‘buy the dip’ or ‘run for the hills?’
Don’t do either one, yet.”
I know, it “feels” like we should be doing something…anything. Right?
Here is the issue.
The markets have not done anything WRONG…just yet.
Yes, corrections do not “feel” good. But they are part of a “healthy” market cycle. In more normal, healthy, correction to bullish trends should be used as buying opportunities to increase exposure to equity risk in portfolios. As shown in the chart below, that may be what is occurring now.
Currently, we do not know whether the current corrective action is JUST a normal, healthy correction, or the beginning of something bigger.
BUT – this is the expected correction we have been discussing over the last several weeks. It is also something we had planned for by reducing overweight positions and adding a short-hedge to portfolios.
With the markets on a short-term sell signal (noted by black vertical dashed lines in the chart above,) the current correctional process is underway. But, with the market now oversold on a VERY short-term basis a counter-trend rally over the next week, or two, should be expected.
Furthermore, as noted above, and below, the market held support at the 200-dma and the bullish trend line which goes back to the beginning of 2016.
In other words, the market has not violated any important trend lines that would suggest the current sell-off is anything more than just an ordinary “garden variety”correction.
It is what happens NEXT that will be most important.
The larger concern currently, is the “sell signal” which has been triggered at abnormally high levels and remains in extremely overbought territory. Such suggests there remains “fuel” for either a “deeper correction” or a “consolidation” of the markets in the weeks ahead to “work off” that “overbought” condition. Historically, markets don’t resolve such conditions by trading “sideways.”
That is the longer-term risk at the moment and something we will discuss more in a moment.
In the VERY short-term the market did attempt to rally mid-week and failed at the 50-dma where we added to our existing short-hedge. The breakdown on Friday led to a successful test of the 200-dma, where we reduced some of our short-hedge, as the market rebounded above the previous lows.
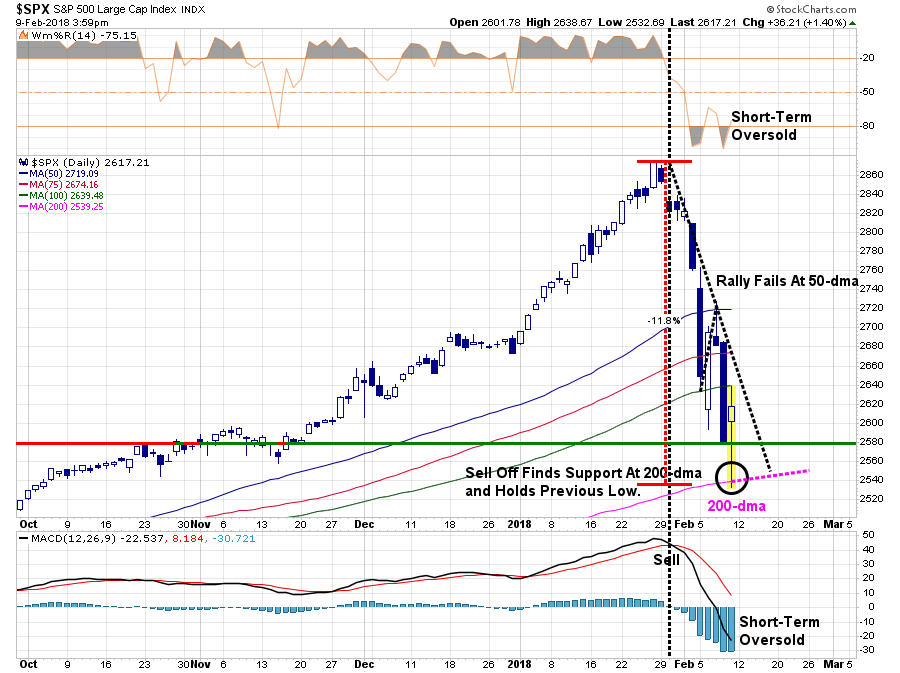
Technically speaking, this is not a good sign and suggests the market could be in for more selling to test the 200-dma as stated.
As stated, with the market very oversold on a short-term basis, the most probable outcome following a test of the 200-dma is a fairly strong counter-trend rally. But should you buy it?
It depends.
- If you are a fairly adept trader, and can enter and exit trades easily, there is a decent setup here for a “trading opportunity.”
- If you are longer-term investor, like us, just be patient and wait for a confirmation the market has regained its “bullish bias.”
If you like us, then “YES” you will “miss” the bottom of the market, if this is indeed “THE” bottom. However, without waiting for a confirmation the bullish trend remains intact, you risk buying into the potential start of a deeper correction which puts more capital at “risk.”
The Rate “Bang” Point
The mystery has been solved.
We now know the point where interest rates implode the market – 2.9%
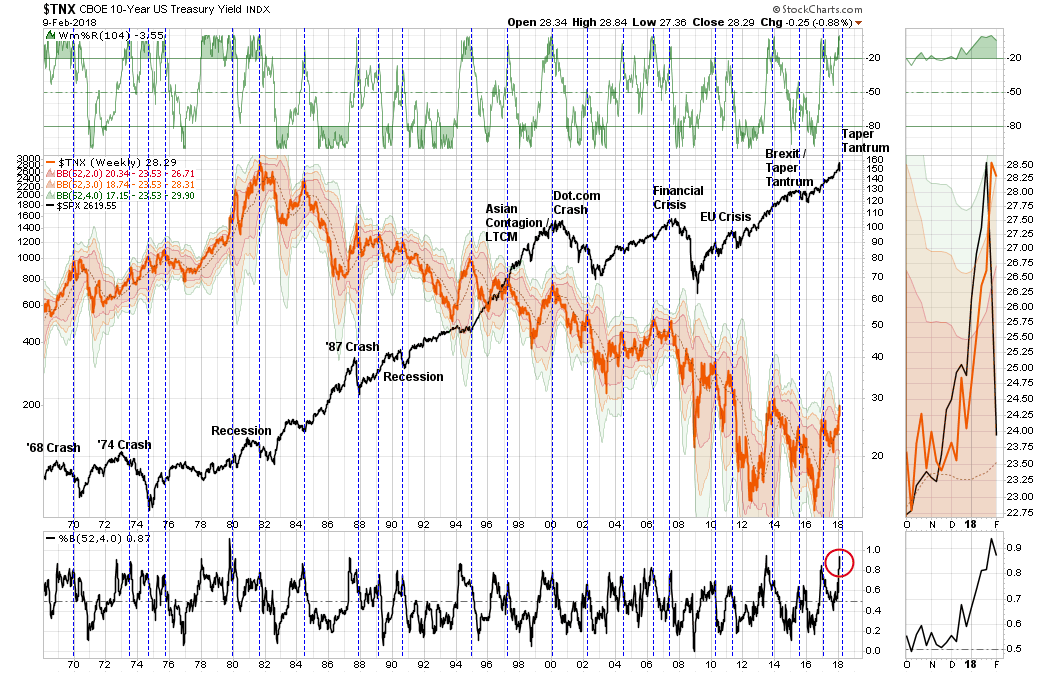
With interest rates now 4-standard deviations above the 1-year moving average there are several things which likely happen in relatively short order:
- The Fed will quickly back off from hiking rates
- The Fed will likely slow or curtail their balance sheet reduction program.
- Economic growth will slow.
- Earnings will come under pressure
- Treasuries are likely to become a “safe haven” of choice is the current “market correction” continues in the weeks ahead.
This will be particularly the case as the recent spate of economic growth from 3-hurricanes, 2-massive wildfires, a surge in oil prices and an extremely cold winter which boosted economic activity temporarily begins to fade. In fact, over the next three quarters we are likely going to see lower inflationary numbers, weaker economic growth and weaker than expected earnings.
If I am right, you are looking at substantially lower interest rates and higher Treasury bond prices.
As I stated last week, the next bull market will most likely be in bonds, not stocks.
We remain long-biased to bonds.
Has The Oil Bust Began?
Back in September, I asked the question whether the run-up in oil prices was sustainable. Given that oil prices have been a huge contributor to both earnings and economic growth in recent quarters, and the expectation that inflation was surging back, this has been a crucial commodity to pay close attention to.
RIA analyst, Jesse Colombo, recently updated his analysis on this topic and the continued imbalance of non-commercial traders which suggests the correction in oil prices has now started.
As noted above, if our analysis proves correct, and oil prices do decline further, the negative impact to economic growth combined with fading support from natural disasters will push inflation and interest rates lower.
What Next?
The most important words for any investor to learn is “I don’t know.”
Currently, “I don’t know” what will happen next with any degree of certainty.
Nor does anyone else.
The “odds” favor the “bulls” currently because:
- Bull markets last longer than bear markets
- Bull markets are hard to break
- Bull markets can defy logic longer than most anticipate
But bulls, like bears, are only right half the time.
Unfortunately, when the “bulls” are wrong – they are “really wrong,” and the long-term damage to capital is irreparable.
This is why we maintain a focus on the “trend” of the market for maintaining portfolio allocations. When markets begin to break down, or change trend, and the risk of loss outweighs the potential for reward, we become aggressively defensive.
Currently, such is NOT the case, as the bullish trend remains intact.
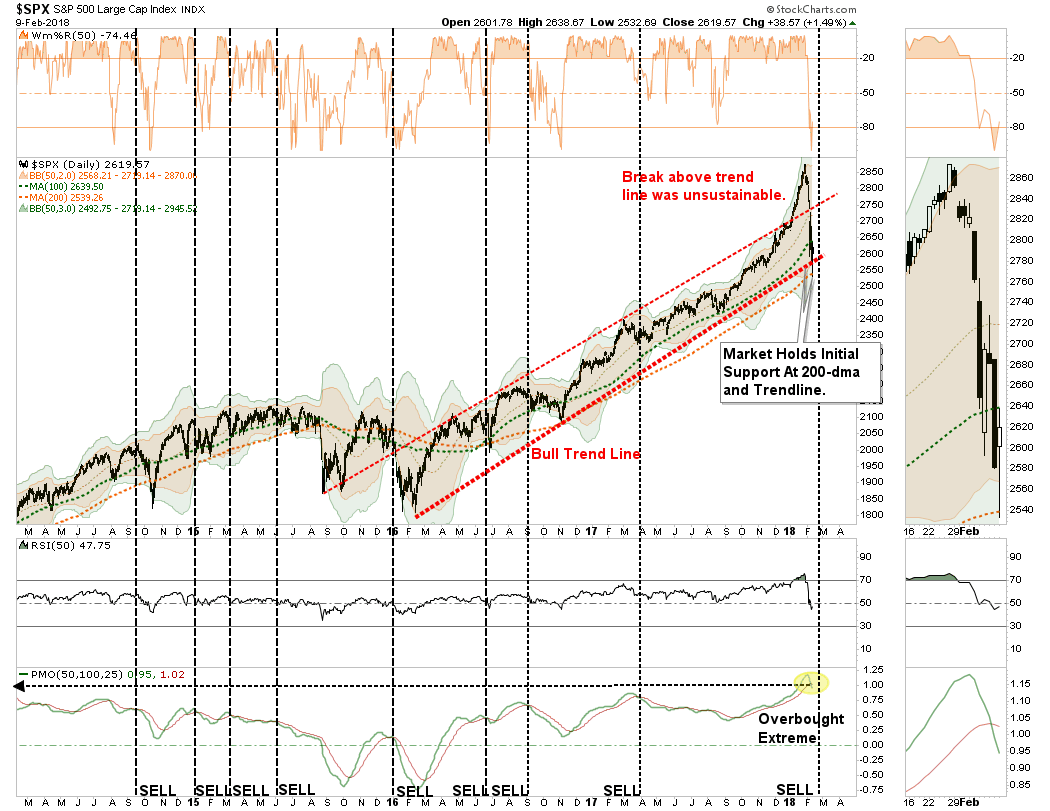
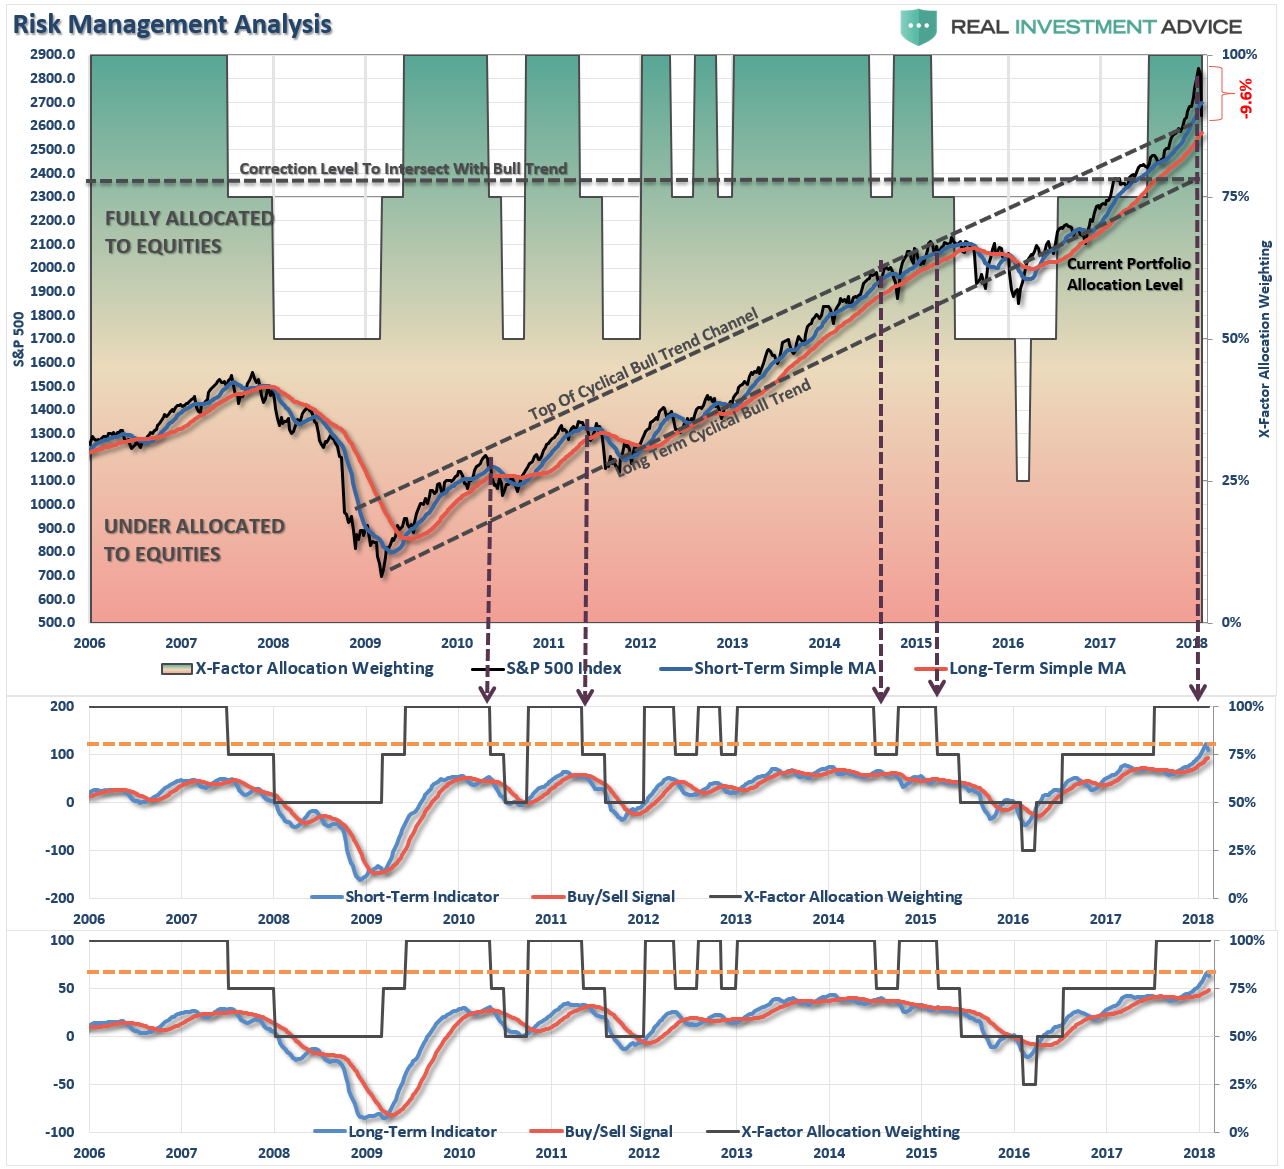
The chart below shows the weekly view of the S&P 500 index going back to 2014.

Don’t get wrapped up in the technical specifics of the indicators, but instead focus on what they indicate.
The market has clearly remained in a bullish trend since the lows in 2009. The vertical black lines mark the points where the lower two indicators BOTH registered a sell signal.
- The first of the two is simply an “ALERT” signal which suggests investors should “pay attention” to their risk related allocations and rebalance those risks accordingly.
- When both lower signals are triggered, a confirming signal, such has generally been a good indication to more proactively reduce allocations, raise SOME cash, and further reduce risk related exposure.
Notice – I did not say “sell everything” and bury your cash in the backyard.
Currently, the market has not violated the accelerated bullish trend nor the bullish trend support levels from the pre-2016 correction advance. It doesn’t mean it won’t happen. It just hasn’t happened yet.
We are not trying to “guess” at what the market “will do,” we are simply “reacting” to what it “does do.“
So, while we have taken profits in some positions and added short-market hedges, there is no reason at the moment to become extremely risk averse.
The trend is still bullish. For now.
That could change, and, as indicated by the green boxes, if it does we will act accordingly reducing risk, raising cash and hedging further as we have done previously during those specific periods.
We are certainly on high alert as there are many reasons to be cautious from internal deterioration, to rising rates and liquidity concerns.
But up to this point, this has currently been nothing more than a correction within a very extended bullish trend.
Just be patient.
We will know in a few days rather we need to sell more, or start buying.
Market & Sector Analysis
Data Analysis Of The Market & Sectors For Traders
S&P 500 Tear Sheet
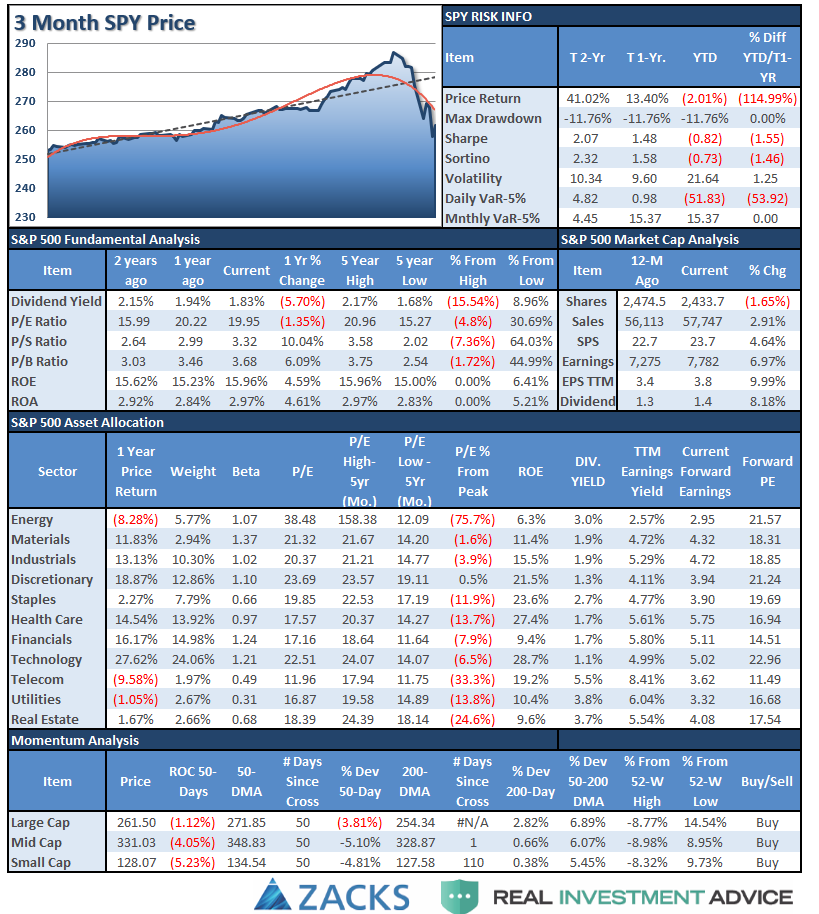
Performance Analysis
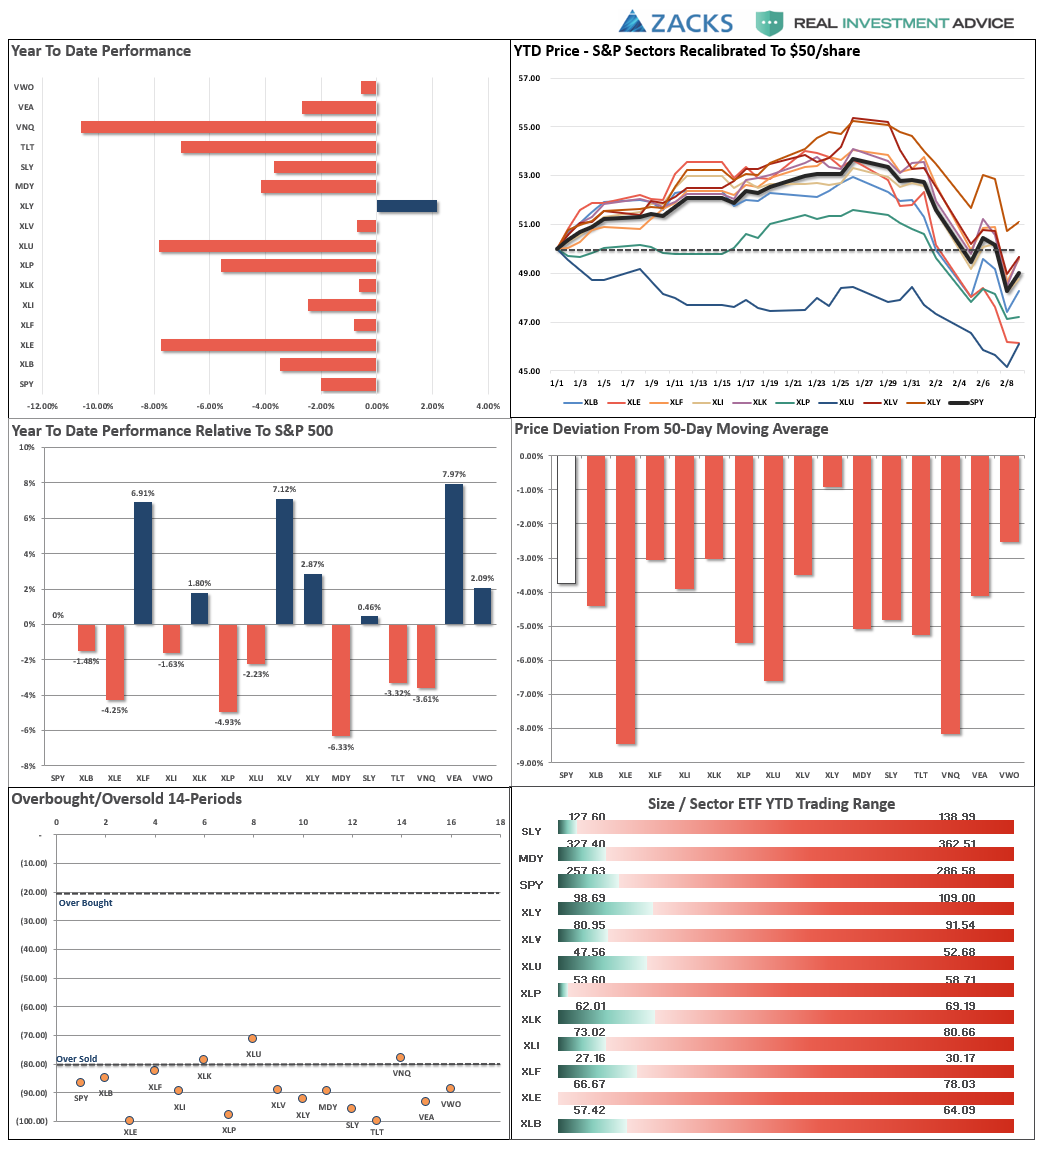
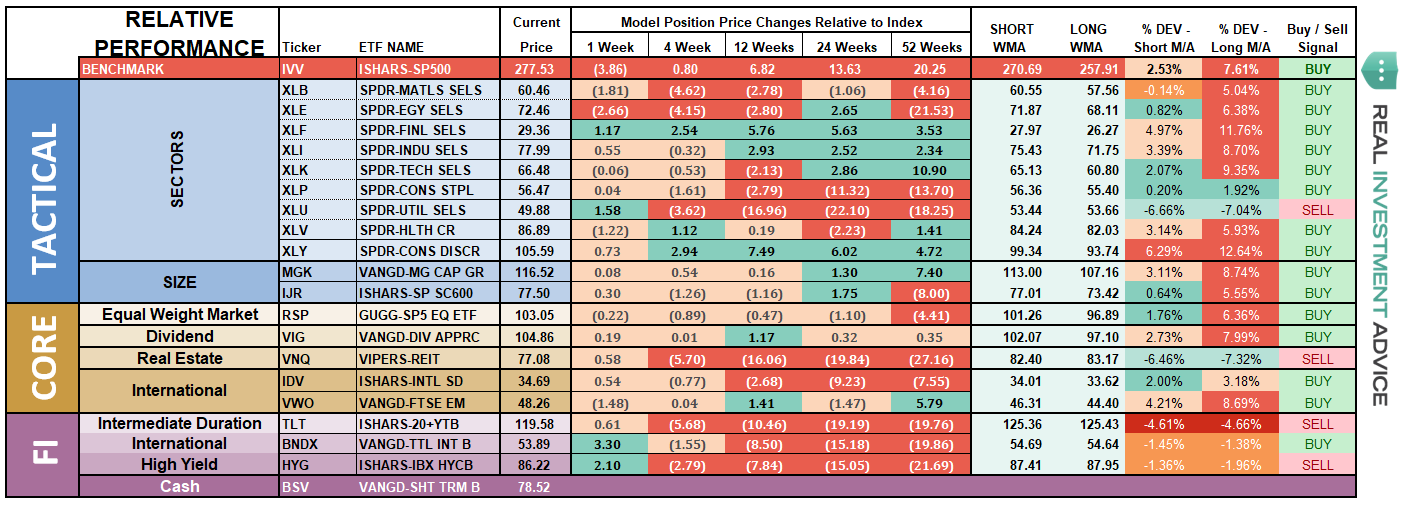
ETF Model Relative Performance Analysis
Sector & Market Analysis:
The bloodbath continued this week which is interesting as just two weeks ago I penned:
“This is just getting a bit TOO extreme. Take a look at the sectors below. Every sector is pushing 2- and 3-standard deviations of longer-term moving averages.
This isn’t normal.”
The reversal came hard.

Every sector remained in sell-off mode last week, in particular on Friday, as money left the markets entirely. Every sector has now broken their 50-dma, while Energy, Staples, Financials, and Utilities have broken their 200-dma.
We will be looking to reduce equity weight on a “failed” counter-trend rally next week.
Let me be clear, there is a VERY high probability that recent lows will be tested, or broken, in the weeks ahead. Do not take unnecessary investment risk at the current time.
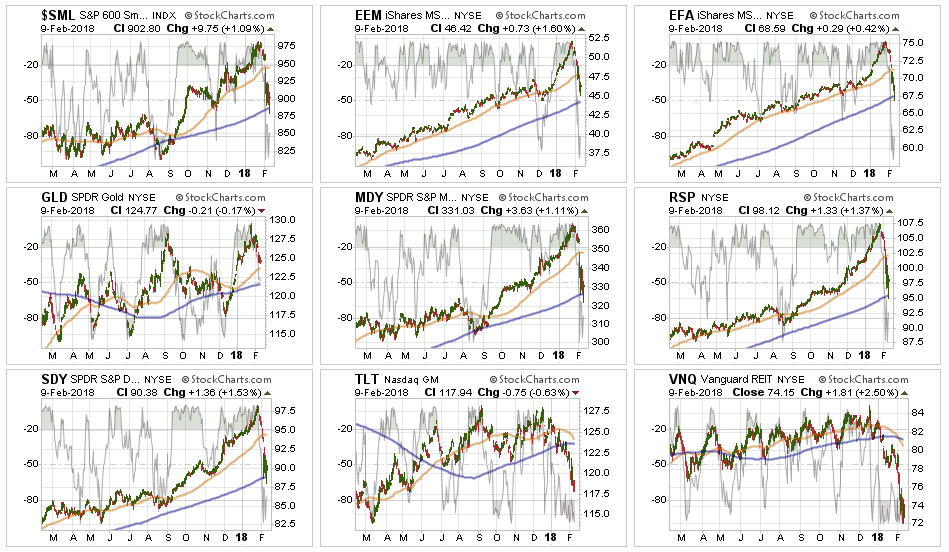
The same advice with sectors also applies to major markets. Whether it is small cap to mid cap to international or emerging markets – there have been no “safe spaces” for investors.
Again, as with the sectors above, we will be looking to rebalance portfolio risks on a failed rally over the next couple of weeks.
Again, recent lows will most likely be retested, or broken, which will be the key in determining whether or not this is just a “correction” or the start of something more.
Sector Recommendations:
The table below shows thoughts on specific actions related to the current market environment.
(These are not recommendations or solicitations to take any action. This is for informational purposes only related to market extremes and contrarian positioning within portfolios. Use at your own risk and peril.)
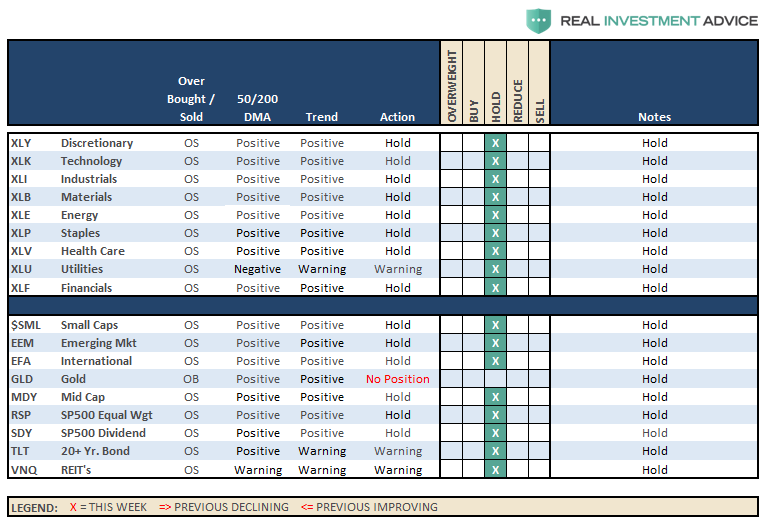
Currently, HOLD, all positions until we get a better understanding of the current correction as noted above. I will update strategy and actions on Tuesday.
Portfolio Update:
As far as portfolios go, we continue to maintain our current positions.
- We have taken profits in some of our positions that were most grossly extended.
- We added to our short S&P 500 position at the failure of the 50-dma earlier this week but sold it as the market successfully tested support at the 200-dma. We still hold our original position and will add to it on a failed rally.
- Interest rates, in the very short-term, are not cooperating with our interest rates sensitive exposure and we are monitoring those positions very closely for our next actions. These are small relative to our overall positioning, but are weighing on performance currently.
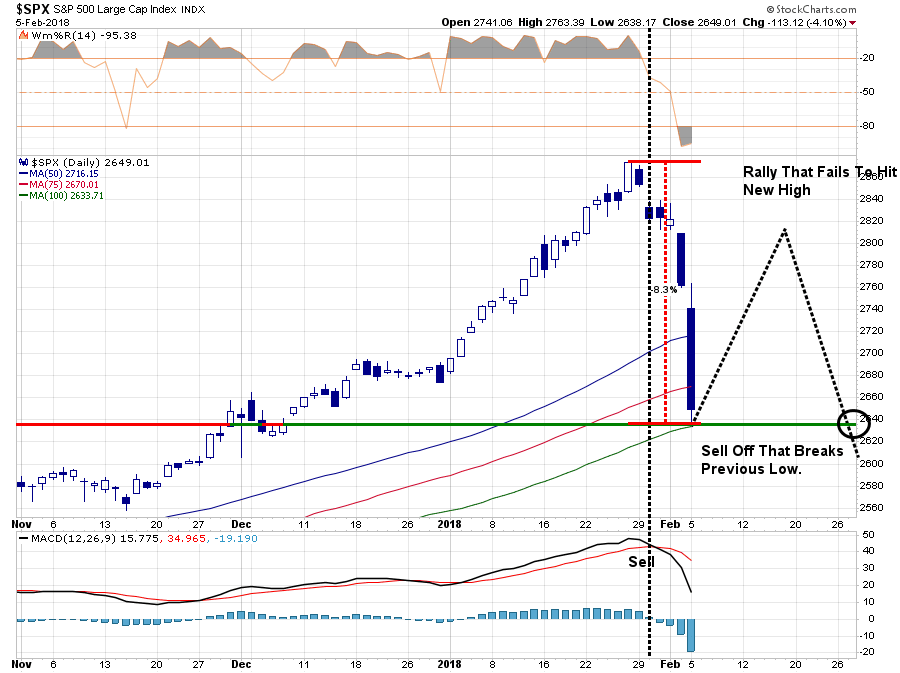
As we stated last week, this is what we are looking for to drive our next set of portfolio actions:
- If the market rallies back and sets a new closing high, the bullish trend will be confirmed and equity allocations will remain at target levels and hedges removed.
- If the market rallies back BUT FAILS to set a new high, a series of actions will take place.
- At the point of rally failure, portfolio hedges will be modestly increased.
- If the subsequent decline breaks the previous low, the hedges will be further increased and tactical trading long positions will be reduced.
Currently, everything remains within our longer-term tolerance bands for risk controls. While corrections certainly do not “feel” good, it is important we don’t let short-term pickups in volatility derail longer-term investment strategies.
While positions are certainly under-pressure currently, we are monitoring them closely. We do not recommend making wholesale changes to investments based on a market correction which remains well confined to a long-term bullish trend. We are highly concerned about the underlying risk and remain focused on capital controls.
THE REAL 401k PLAN MANAGER
The Real 401k Plan Manager – A Conservative Strategy For Long-Term Investors
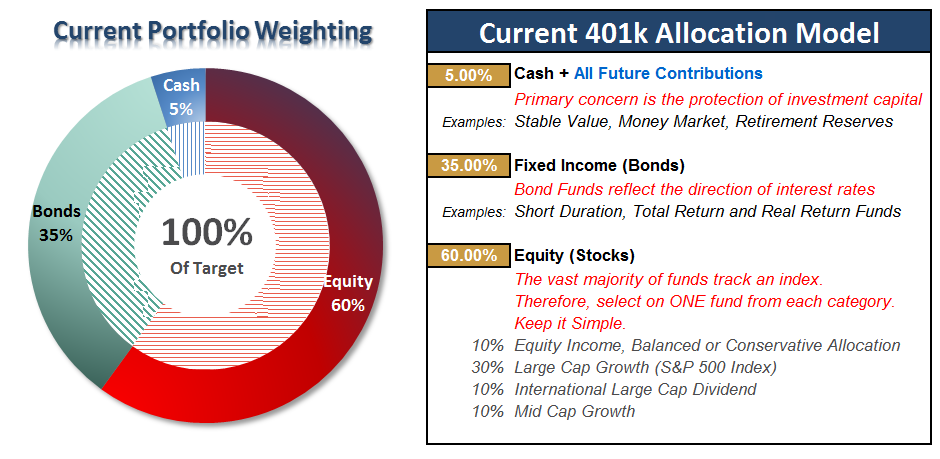
There are 4-steps to allocation changes based on 25% reduction increments. As noted in the chart above a 100% allocation level is equal to 60% stocks. I never advocate being 100% out of the market as it is far too difficult to reverse course when the market changes from a negative to a positive trend. Emotions keep us from taking the correct action.

No…Not Time To Panic
As I penned last week:
“Well, it happened.
And yes, it certainly did not “feel” good.
But as noted repeatedly throughout this weekend’s missive, it is important NOT to mistake a short-term correction for a full-blown reversion.”
Keeping perspective is always important. The current correction has only retraced to the top of the longer-term upper bullish trend line. As I have discussed previously, the massive extension above the longer-term trends HAD to be corrected.
Furthermore, BOTH of the lower indicators remain firmly on “buy” signals which keeps allocations weighted to the long-side.
While this COULD be the beginning of a larger corrective process that will require further action, it is simply WAY to early to know for sure. As I laid out in the main body above, the actions of the market over the next week, or two, will determine our next major course of action.
We have been hedging for this event for the last two months by repeatedly suggesting rebalancing portfolio allocations and reducing risk.
Continue adding All NEW contributions to cash or cash equivalents like a stable value fund, short-duration bond fund or retirement reserves. We will use these funds opportunistically to add to weightings when the market decides where it is headed next.
Current 401-k Allocation Model
The 401k plan allocation plan below follows the K.I.S.S. principle. By keeping the allocation extremely simplified it allows for better control of the allocation and a closer tracking to the benchmark objective over time. (If you want to make it more complicated you can, however, statistics show that simply adding more funds does not increase performance to any great degree.)
401k Choice Matching List
The list below shows sample 401k plan funds for each major category. In reality, the majority of funds all track their indices fairly closely. Therefore, if you don’t see your exact fund listed, look for a fund that is similar in nature.

Disclosure: The information contained in this article should not be construed as financial or investment advice on any subject matter. Real Investment Advice is expressly disclaims all liability in ...
more


Any updates? What do you think now?