
Market Weakness Leads To Unwinding - Real Investment Report
As I was out on vacation recently, I want to start this week’s missive by picking up where I left off previously:
“As shown in the bottom part of the chart above, on a very short-term basis the market currently remains on a ‘buy signal,’ however, the weakness of the market over the last couple of days has led to some deterioration. Furthermore, the market is struggling with recent resistance levels as the overbought condition continues to limit the advance.
We remain cautious, however, on the type of ‘risks’ we take on in portfolios. Capital preservation always remains our priority over chasing returns.”
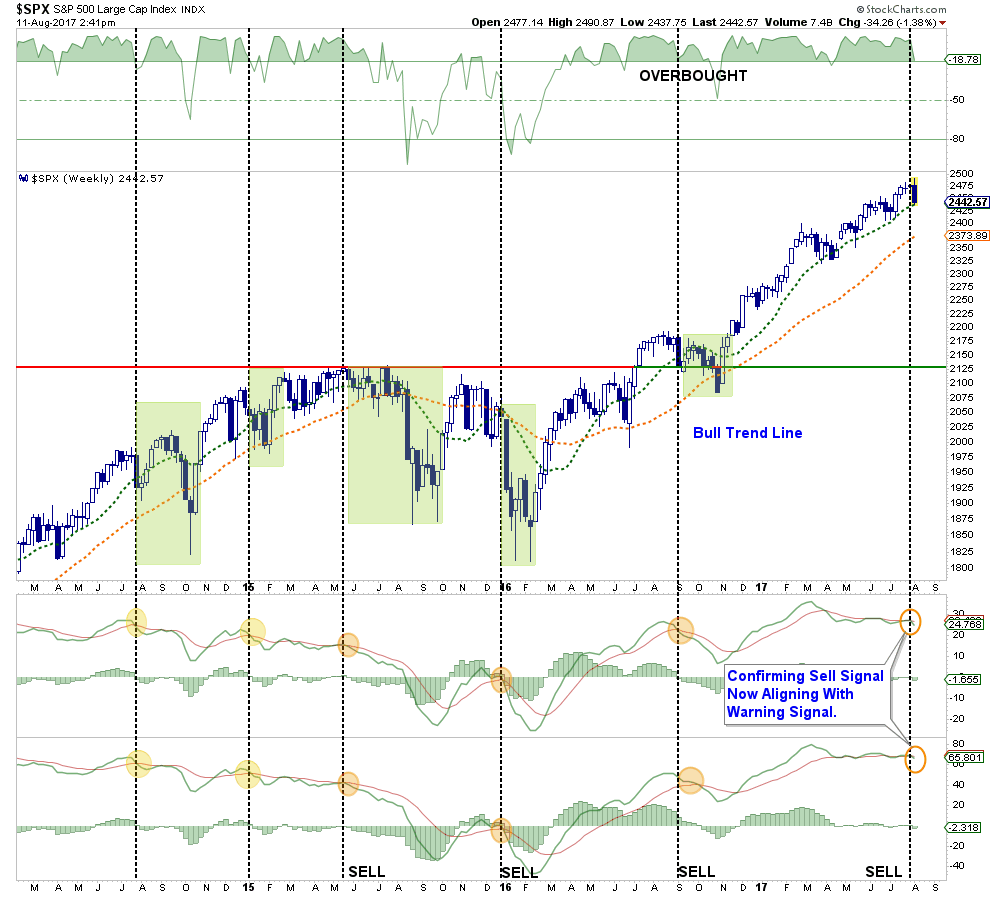
I have updated the chart below from two weeks ago. The weakness in the market previously, combined with the threats between the U.S. and North Korea, led to a fairly sharp unwinding in equities on Thursday which in turn triggered a short-term sell signal.
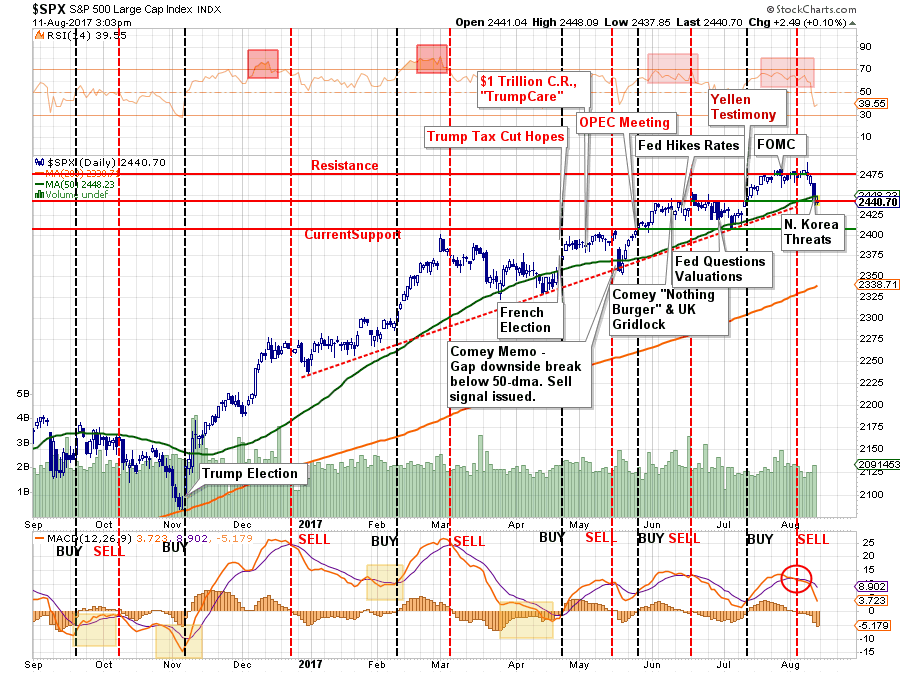
That sell-off has remained confined to the current bullish trendline but has threatened to violate the 50-dma. If the market is unable to regain the 50-dma on Monday, and remain above it for the balance of the coming week, the most likely move in the markets will be lower.
This was a “risk” I addressed this past Tuesday:
“This divergence will likely not last much longer, the only question is whether the internals will ‘catch up,’ as the ‘bulls’ currently hope?
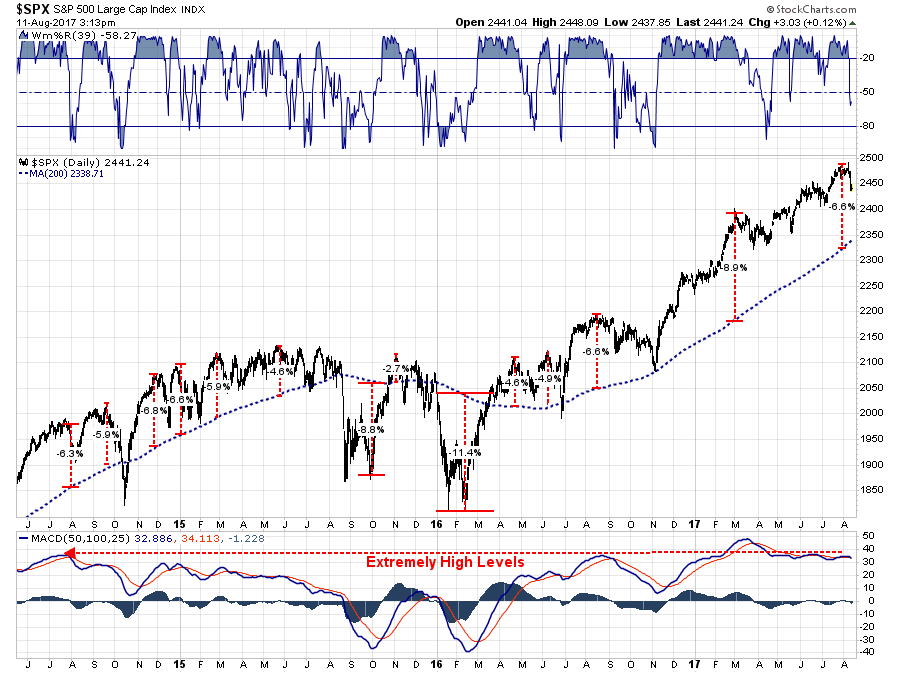
Deviations from both intermediate and long-term moving averages have also reached levels that become problematic for further advances without a correction first. The first chart is the percentage deviation from the 200-day moving average. At almost 7%, it is one of the larger deviations over the last 3-years and, as shown,has always resulted in at least a short-term correction.”
Chart updated through Friday:
So…Should I “Buy The F*$(@!# NOKO?”
My best guess currently is – probably. But not yet.
The reason I say that is for two reasons:
- Bull markets don’t typically end when the mainstream media is “peeing down both legs” over the 1.5% drop on Thursday.
- The bullish uptrend remains intact and “fear” gauges remain confined to a downtrend.
The chart below goes back to the beginning of the bull market advance following the 2012 correction. Notice that while the market remained in the QE backed bullish advance, volatility remained confined to a downtrend with the brief exception the “taper tantrum” in October 2014.
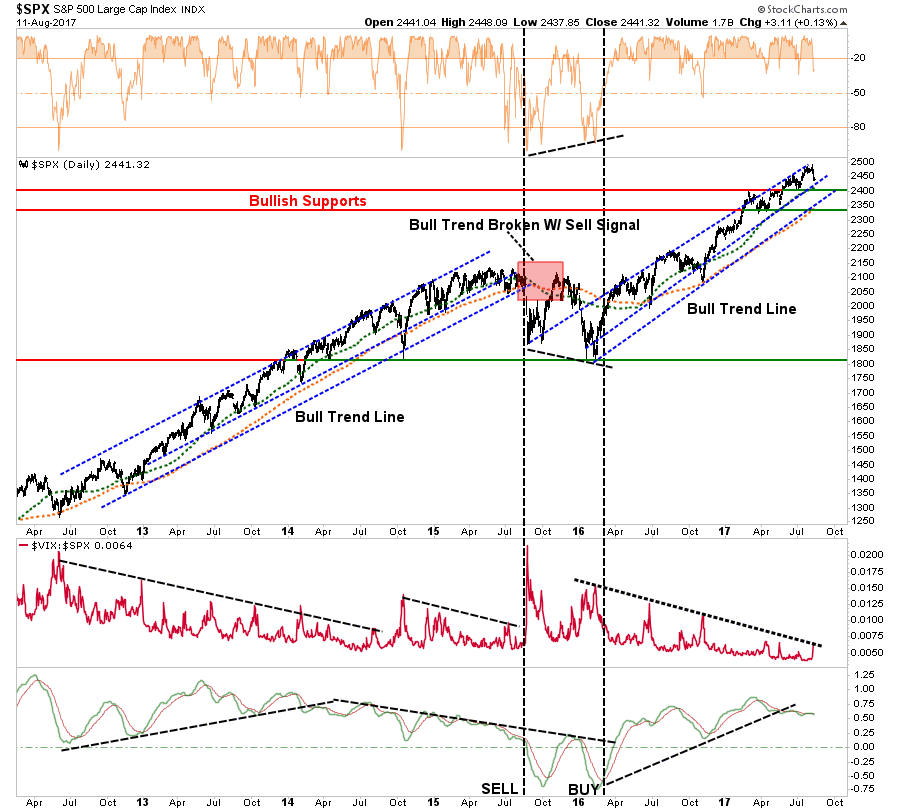
However, notice the bottom part of the chart. As the bull trend remained intact, the general trend of prices was rising. However, beginning in 2014, that trend became negative as the“momentum” of the advance began to stall. Eventually, that deterioration in price momentum led to a bigger correction and a break of the “bullish trend” in late 2015 and early 2016.
Currently, we are seeing the same “deterioration” in price momentum. However, the market remains confined within its overall bullish trend while volatility remains confined to downtrend. Given this backdrop, I would suspect that current weakness will result in an internal rotation of sector participation as “bulls” continue to ignore the mounting risk of deteriorating of reported EPS growth, weak revenue growth, slowing economic growth and fading realities of positive legislative agenda coming to fruition.
In our portfolios, we will wait for confirmation the current sell-off has abated before adding additional risk exposure to portfolios. In recent years, such market tantrums have been very short-lived and have provided opportunistic entry points for increasing equity related exposure. However, EVERY TIME is DIFFERENT, so it is always important to NEVER ASSUME the outcome will be the same as the last. That is how you wind up losing a lot of money.
As shown in the chart above, with the market on a very short-term sell signal, and still very overbought, it will likely prove prudent to remain patient and see if the markets can regain more solid footing next week.
I will update this analysis on Tuesday for any potential changes.
So, IF we get an opportunity to put “dry powder” to work in the SHORT TERM, where might we find some opportunities. That is where we will spend the rest of today’s missive.
Sector & Market Review & Analysis
ENERGY
As shown below, there is an unsurprisingly high correlation between oil and energy prices. As such, it is worth paying attention to the underlying dynamics of oil prices from a technical perspective to determine the “path of least resistance” for energy-related companies.
Following the surge in oil prices in 2016 as hopes rose for a deal with OPEC to cut production, the outcome of that oil production cut has been less than beneficial. The rush to increase drilling in the Permian Basin by domestic suppliers have more than offset the cuts in production by the OPEC nations. Currently, oil prices remain in a downtrend and the recent failure at the downtrend resistance put’s the mid-$40 level back in focus in the near term.
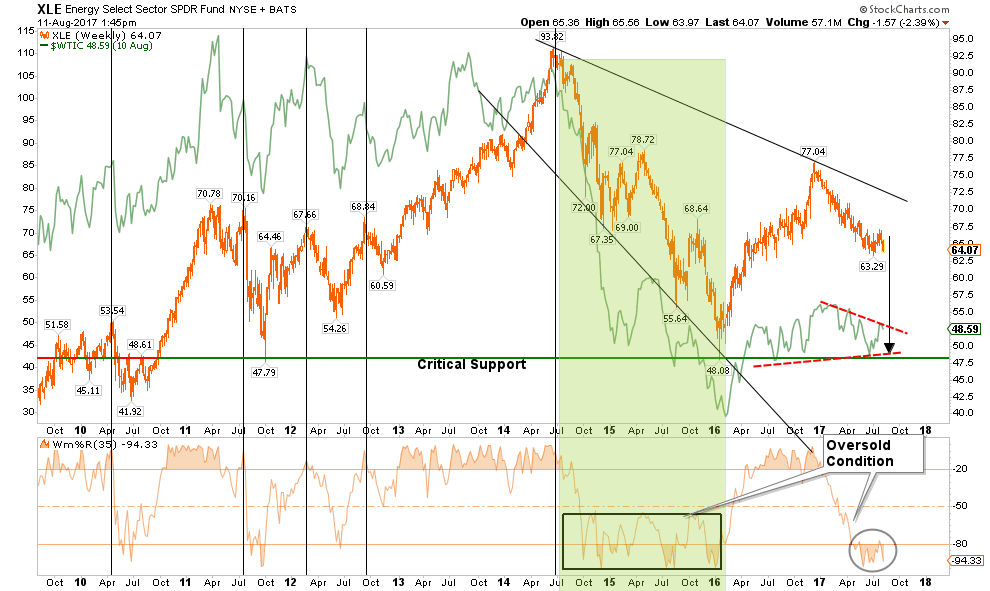
Furthermore, the recent boost to energy stocks from earnings season has been very short-lived as the bullish breakout of the downtrend from the 2016 highs failed with a break back below the moving average. While energy stocks are oversold, once again, we have continued to recommend being OUT of this sector until the fundamental and technical dynamics improve. There is little evidence of that currently.
Stops should be placed at recent lows.

HEALTH CARE
The health care sector moved from laggard to leader, as anticipated last December, as the raging debate over the repeal/replacement of the Affordable Care Act failed. (Also, as anticipated.) With the future of the ACA now in limbo, it was not surprising to see some profit taking in the sector. However, given that government sponsored support of insurance companies is here to stay, the sector remains a “hold” for now.
Current holdings should be reduced to market-weight for now as there is not a good stop-loss setup currently available. A correction to $75-76 would provide an entry point while maintaining a stop at $73.

FINANCIALS
After a large surge following the election of President Trump, financials have weakened as of late in terms of relative performance. The sector is currently working off the extremely overbought condition and a correction back to support at $23 could provide for an entry point with a stop at $22.50.
There is a tremendous amount of exuberance in the sector at a time that loan delinquencies are rising and loan demand is falling. Caution is advised.

INDUSTRIALS
Industrials, like Financials, relative performance has begun to lag as of late. However, the “Make America Great Again” infrastructure trade is still on. Importantly, this sector is directly affected by the broader economic cycle which continues to remain weak so the risk of disappointment is very high if “hope” doesn’t become reality soon.
While the sector has receded from recent highs, the sector has not reached a deep enough oversold level to warrant an entry. I would reduce holdings back to portfolio weight and take in some of the gains while maintaining a stop below the post-election bullish trendline at $66.

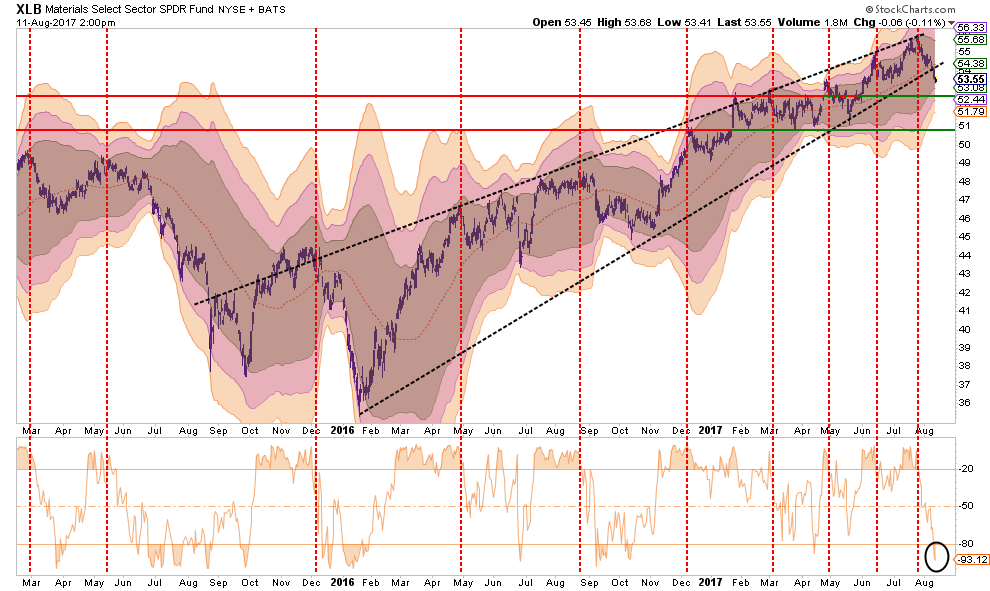
MATERIALS
Basic Materials, also a beneficiary of the dividend / “Make America Great Again” chase is showing a fairly sharp pickup in weakness following a rather lackluster earnings season for the sector. Currently, the very oversold condition of the sector suggests a short-term rally couple present itself to allow for a rebalancing back to portfolio weight. Stops should be set at the recent support of $52.50.
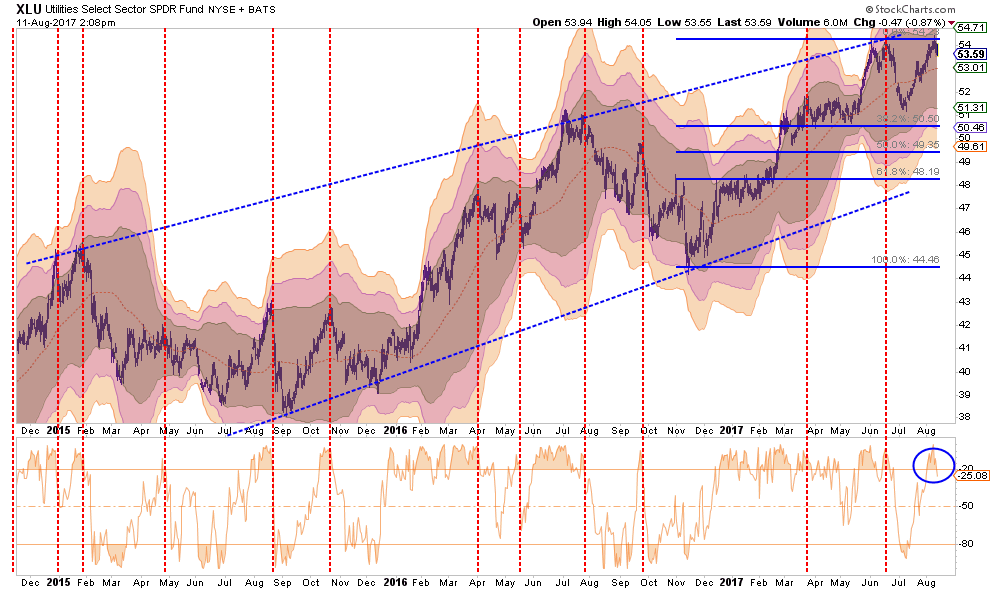
UTILITIES
Back in January, I discussed the “rotation” trade into Utilities and Staples. That performance shift has played out nicely and the sector is now extremely overbought. Utilities have continued to receive the benefit of weaker economic data, and since the sector is interest rate sensitive, have participated with the relative decline in interest rates.
As stated, the sector is now overbought along with interest rates, so reducing the position back to portfolio weight seems prudent. Maintain a stop at $51.00.
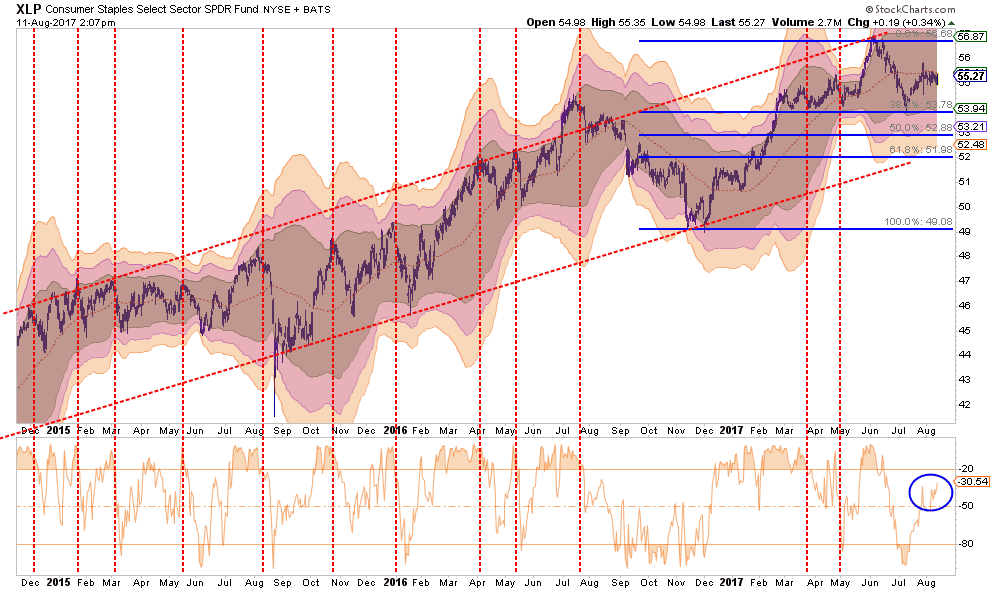
STAPLES
Like Financials, Staples, have been holding support around $54 since March. Currently, the sector is trapped below its short-term moving average but above important support. Reduce overweight exposure until the technical backdrop improves.
Set stops at $53.50.
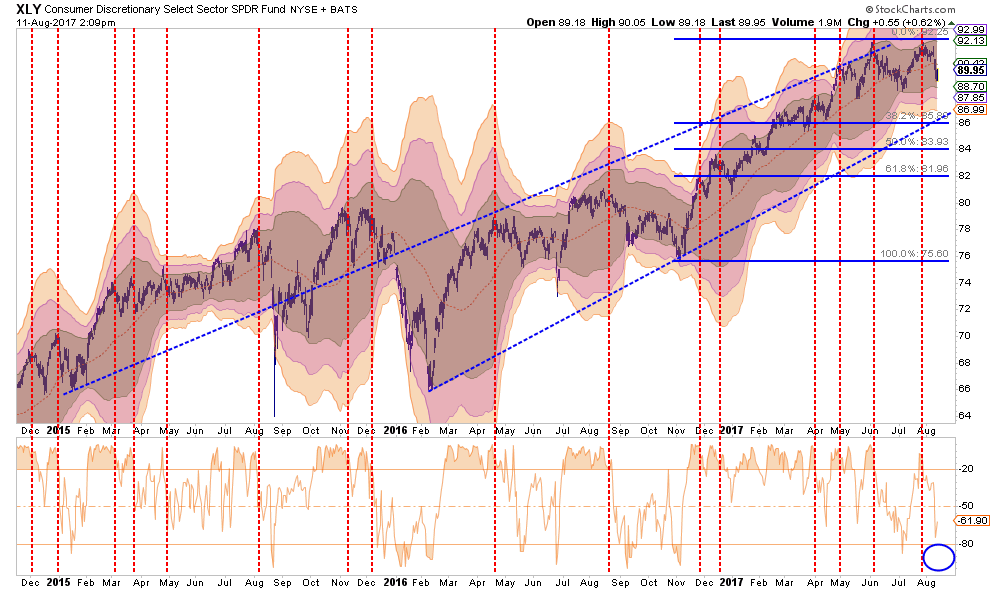
DISCRETIONARY
Discretionary has been running up in hopes the pick-up in consumer confidence will translate into more sales. There is little evidence of that occurring currently, BUT with discretionary stocks near recent highs, profits should be harvested on a rally that fails at the short-term moving average at $90.
Set stops set at $88.50. With many signs the consumer is weakening, caution is advised and stops should be closely monitored and honored.
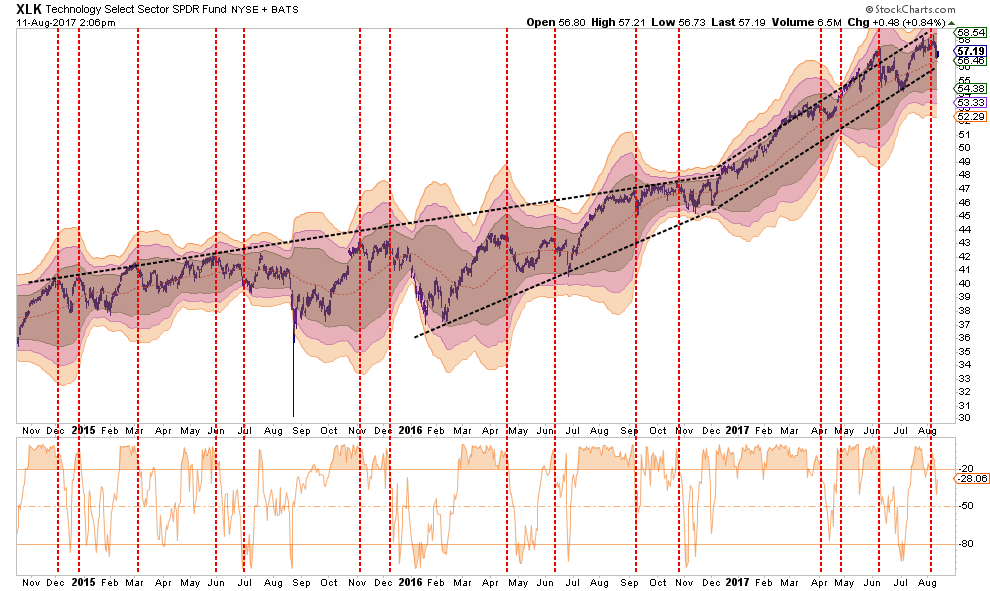
TECHNOLOGY
The Technology sector has been the “obfuscatory” sector since the beginning of 2016. Due to the large weightings of Apple, Google, Facebook, and Amazon, the sector kept the S&P index from turning in a worse performance than should have been expected prior to the election and are now elevating it post election.
The so-called FANG stocks (FB, AMZN, AAPL, NFLX, GOOG), for the most part, have continued to support the overall indices due to their large weightings. Watch for weakness in these stocks as a key to the broader market as well.
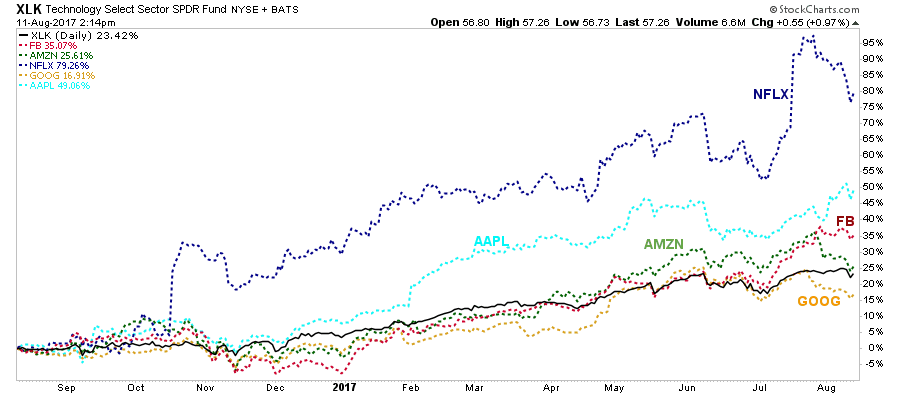
The sector is overbought and recent weakness could continue. Stops should be moved up to $56 where the bullish trend line currently resides. Weightings should be trimmed back to portfolio weight.
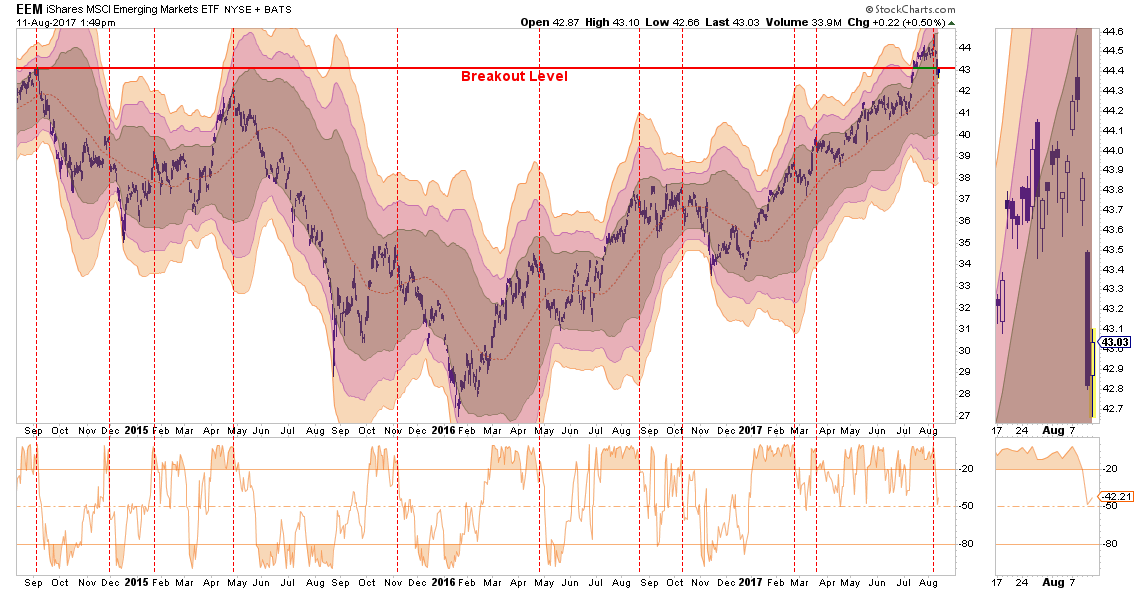
EMERGING MARKETS
Emerging markets have had a very strong performance and recently broke out to all-time highs. This has been helped by the weakening of the US Dollar which has likely neared its end.
Furthermore, the rhetoric that “valuations are cheap” relative to the U.S. is a “false flag.” There have been 6-historical emerging market bubbles in history and they have all failed miserably. The reason is simple. Their economies are DEPENDENT upon the good-will of their neighbors to buy their exports. If the major industrialized countries catch a cold, emerging market economies get the “Flu.” With a recession in the not so distant future, being extremely long emerging markets will likely not play out well.
With the sector beginning to correct an extremely overbought condition, the majority of the gains in the sector have likely been achieved. Profits should be harvested and the sector moved back to normal portfolio weights. There is no reasonable stop level, so a break of $41 can be used for now.
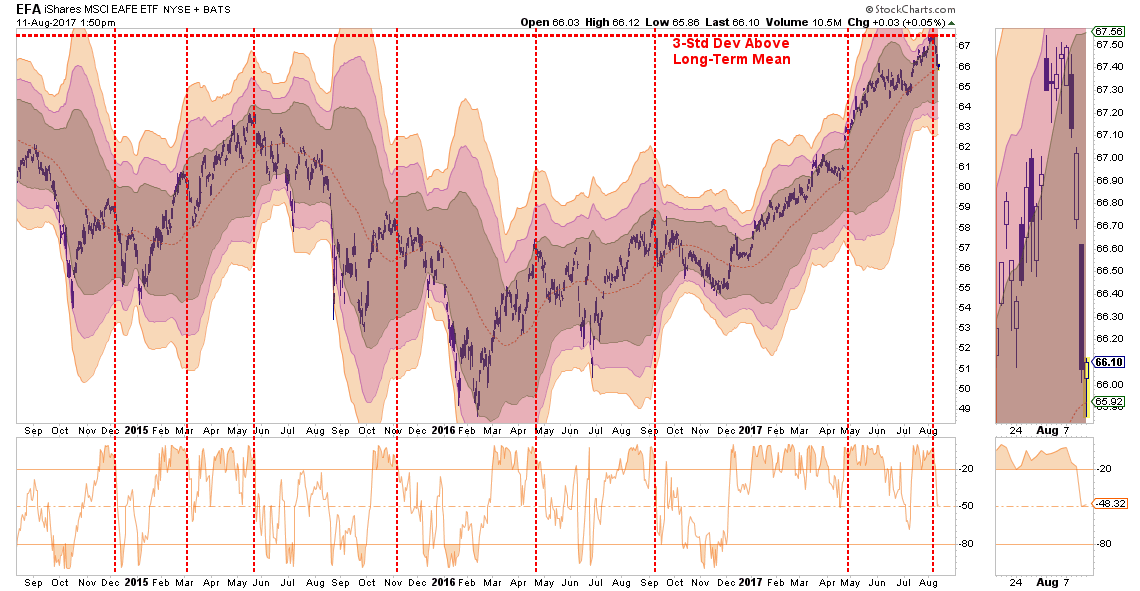
INTERNATIONAL MARKETS
As with Emerging Markets, International sectors are also correcting an extremely overbought condition. Reduce weighting back to portfolio weights by harvesting some profits, and set stops at 64.50.
DOMESTIC MARKETS
As stated above, the Technology sector, which is heavily weighted in the S&P 500 index on a market-capitalization weighted basis, has obfuscated much of the weakness in the other sectors of the index. As shown below, the difference in performance since March between the market-cap and equally weighted indices has been significant.
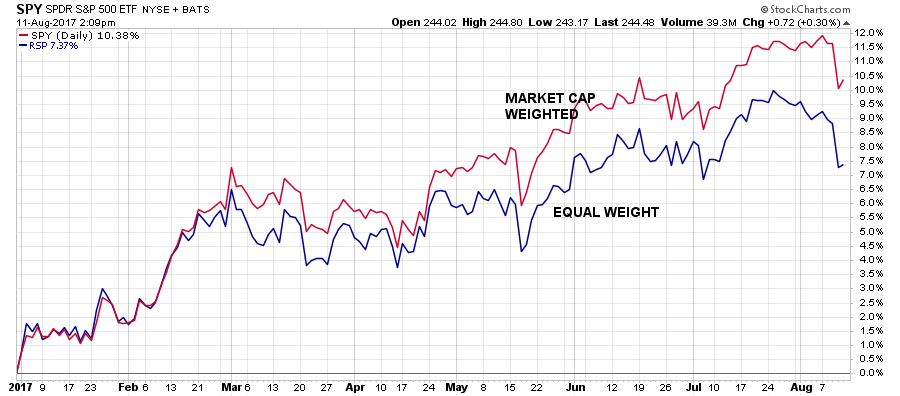
Currently, the S&P 500 remains extremely overbought, overextended, over valued, and overly exuberant. Furthermore, the recent weakness in the market, and sell-off on Thursday, have triggered an initial “sell signal.” Furthermore, a sell signal registered from such a high level has previously coincided with bigger corrections.
Caution is advised for now.
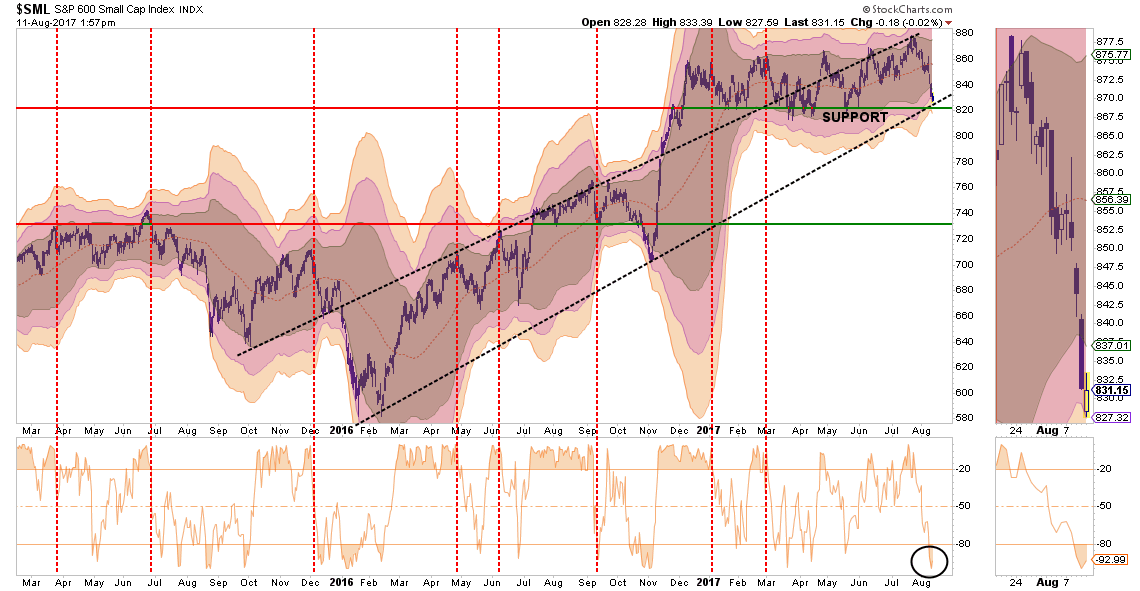
SMALL CAP
Small cap stocks went from underperforming the broader market to exploding following the Trump election. However, as of late, that performance has stalled and the sector has now threatening to violate the bullish trend line and support levels going back to 2016.
Importantly, small capitalization stocks are THE most susceptible to weakening economic underpinnings which are being reflected in the indices rapidly declining earnings outlook. This deterioration should not be dismissed as it tends to be a “canary in the coal mine.”
Currently, small caps are back to an oversold condition which suggests the current corrective process is likely near completion. However, a failed rally attempt and a break below $820 would suggest a much deeper reversion is in process. Reduce exposure back to portfolio weight for now and carry a stop at $820.
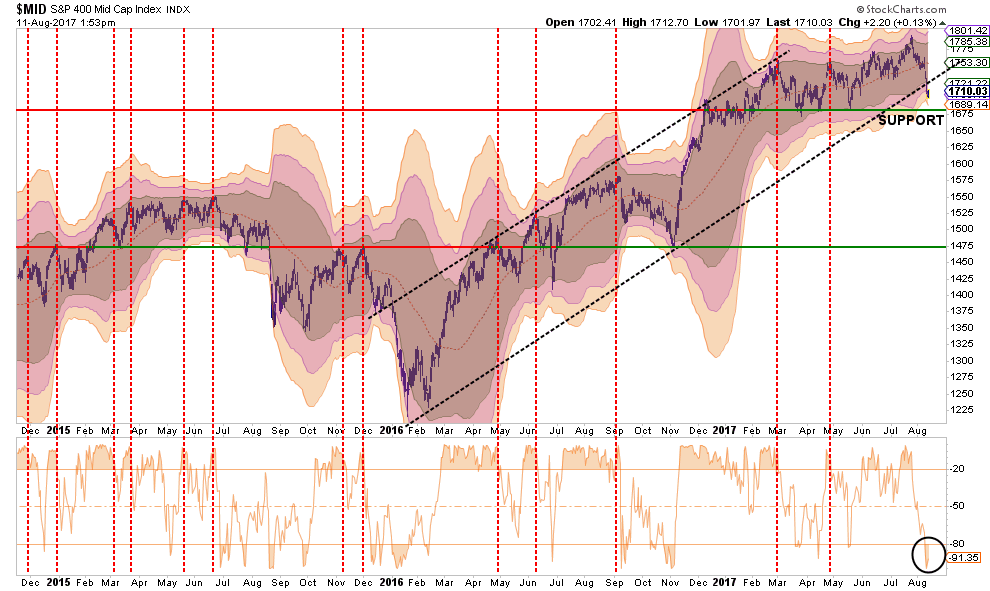
MID-CAP
As with small cap stocks above, mid-capitalization companies had a rush of exuberance following the election. Mid-caps are currently also oversold on a short-term basis, have broken the bullish trend and are threatening lower support levels.
Like small-caps, there may be a short-term investment opportunity forthcoming, but risk is elevated. A rally above $1730 is required to reverse the bearish setup currently. Continue to carry a stop at $1675.
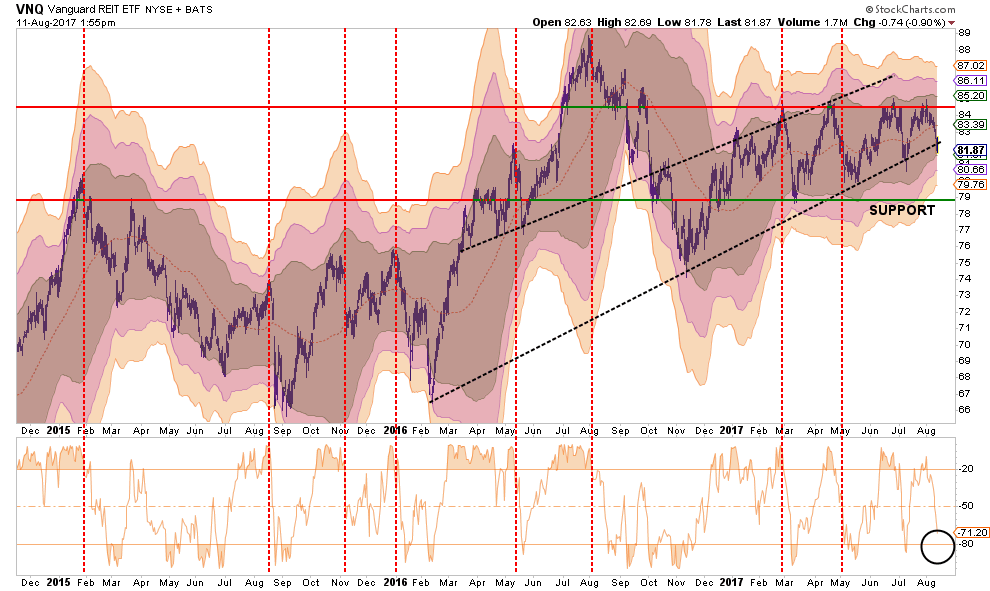
REIT’s
REIT’s have been under pressure and are currently wrestling with their bullish trendlines. However, the sector is now approaching oversold and near support. Hold current positions with a stop set at $80.
TLT – BONDS
Like Utilities, bonds are now overbought and pushing up towards resistance. I wrote previously:
“With the massive ‘short interest’ position currently outstanding on bonds, a retracement of the previous decline to anywhere between $126 and $132 is very possible.”
That call was very contrarian to mainstream analysts who were calling for a bond “bear market” at the time. With bonds back to extreme overbought conditions, take some profits and reduce holdings back to portfolio weights.
Stops should currently be set at $122.

IMPORTANT NOTE:
If you go back through all the charts and note the vertical RED-DASHED lines, you will discover that each time previously these lines denoted the peak of the current advance. Overall, in the majority of cases above, the risk/reward of the market is NOT favorable.
If, and when, the market corrects some of the short-term overbought conditions which currently exist, equity risk related exposure can be more aggressively added to portfolios.
Just be cautious for the moment.
It is much harder to make up losses than simply adding preserved cash back into portfolios.
See you week after next.
Market & Sector Analysis
Data Analysis Of The Market & Sectors For Traders
S&P 500 Tear Sheet
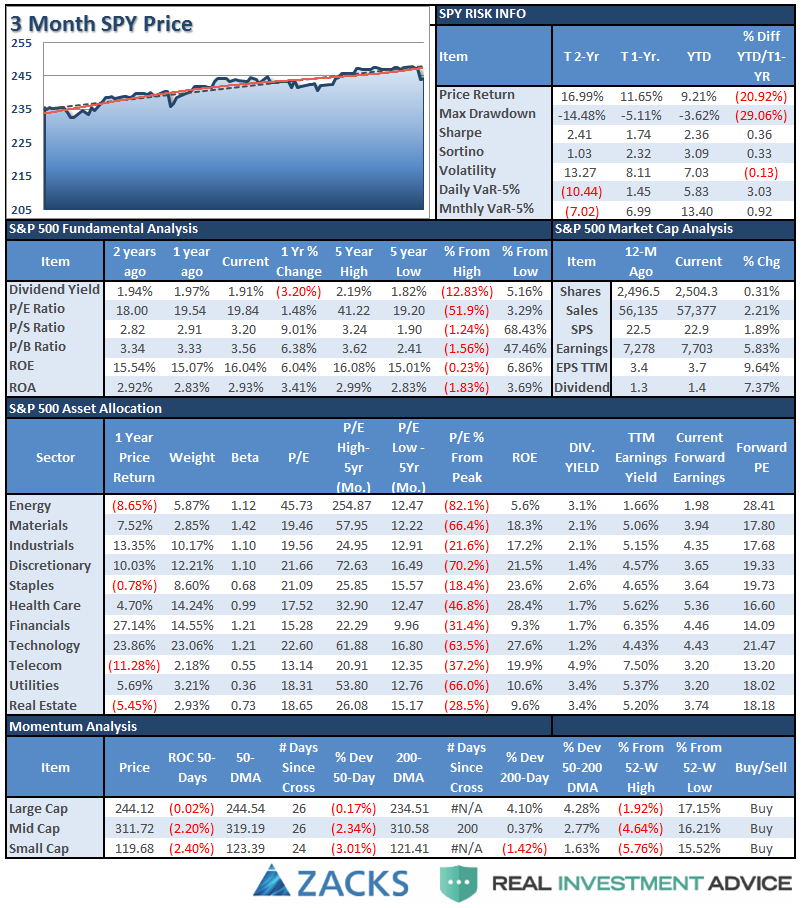
Performance Analysis
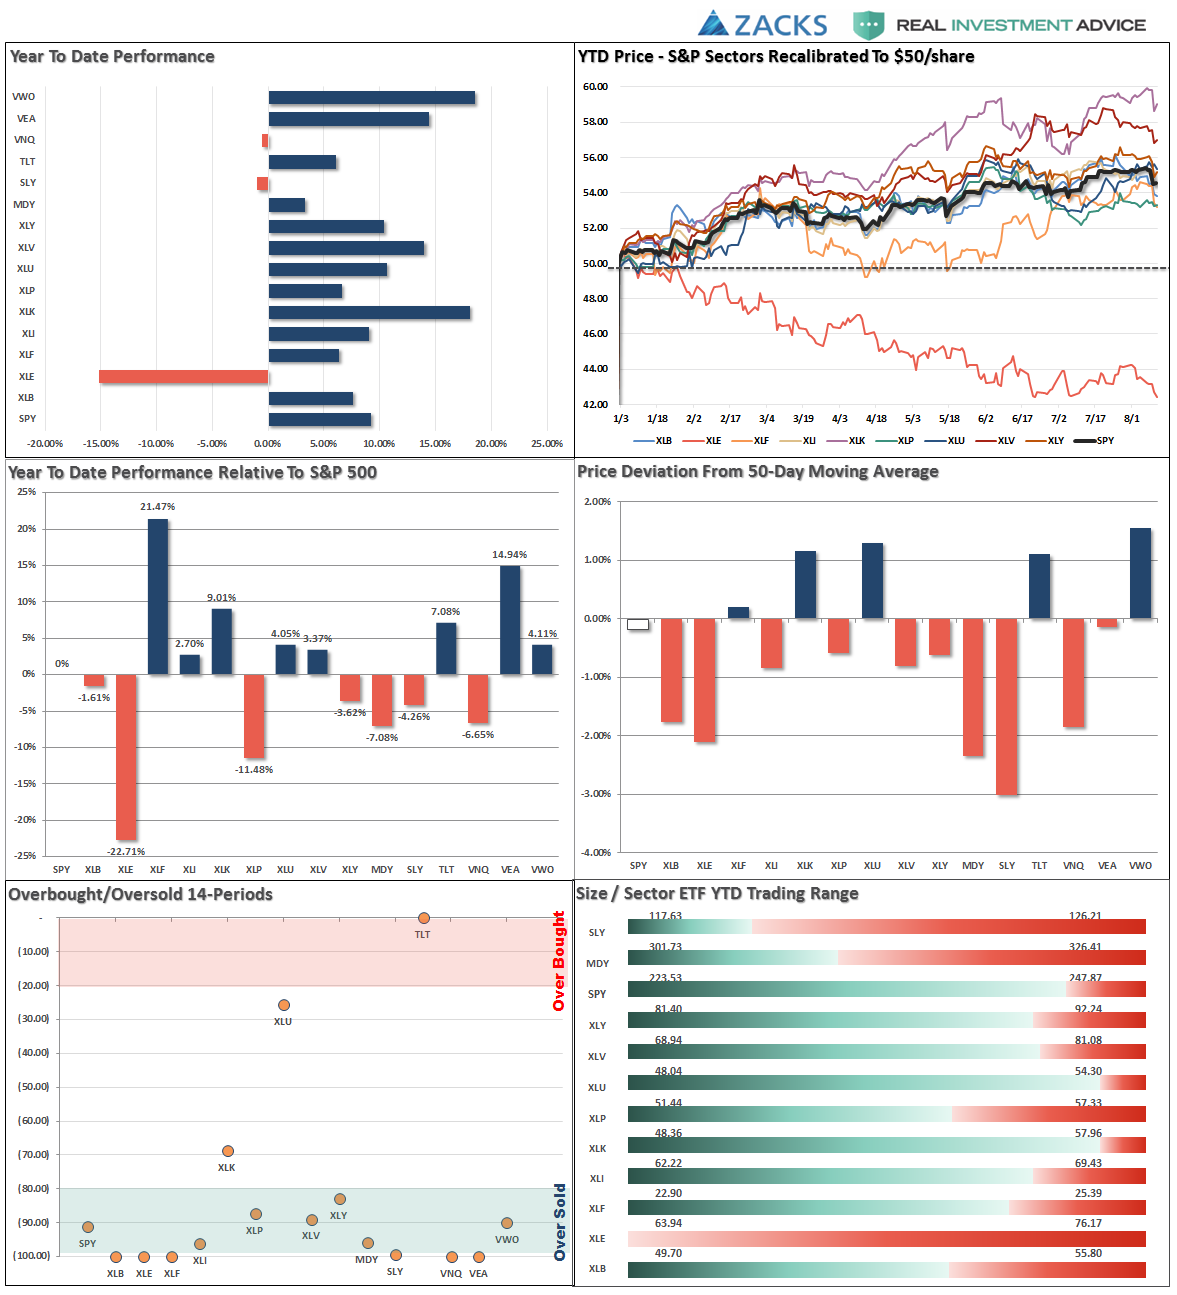
ETF Model Relative Performance Analysis
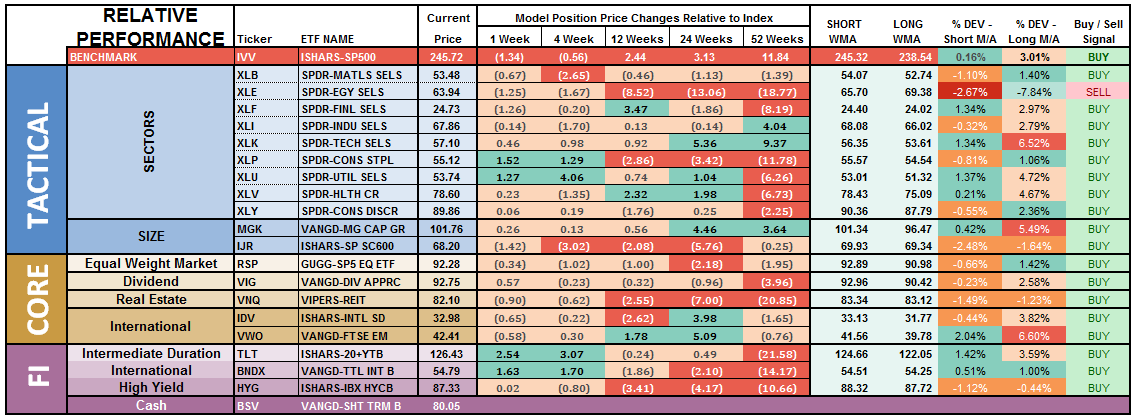
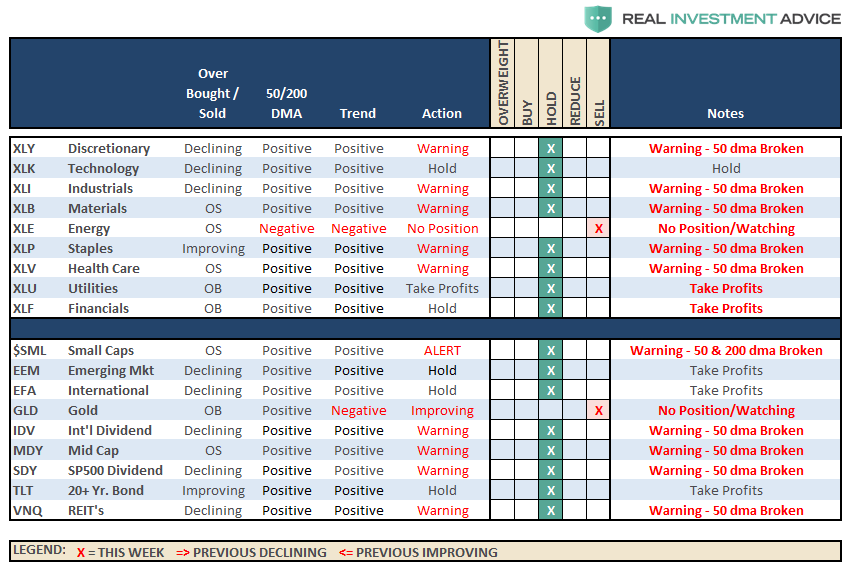
Sector Recommendations:
The table below shows thoughts on specific actions related to the current market environment.
(These are not recommendations or solicitations to take any action. This is for informational purposes only related to market extremes and contrarian positioning within portfolios. Use at your own risk and peril.)
Portfolio Update:
The bullish trend remains positive, which keeps us allocated on the long side of the market for now. However, more and more “red flags” are rising, as noted above with WARNINGS popping up across sectors and markets. While warnings are just that, a warning, it does suggest a bigger correction may be in the works over the next couple of months. Let’s pay close attention.
The sharp drop in interest rates over the last couple of weeks has played favorably for our increased bond positions that we had taken on. However, it is now time to take some profits and rebalance those investments in portfolios and harvest some of the gains.
Stops have been raised to trailing support levels and we continue to look for ways to “de-risk”portfolios at this late stage of a bull market advance.
We remain invested. We just remain cautious and highly aware of “risks” to capital.
THE REAL 401k PLAN MANAGER
The Real 401k Plan Manager – A Conservative Strategy For Long-Term Investors
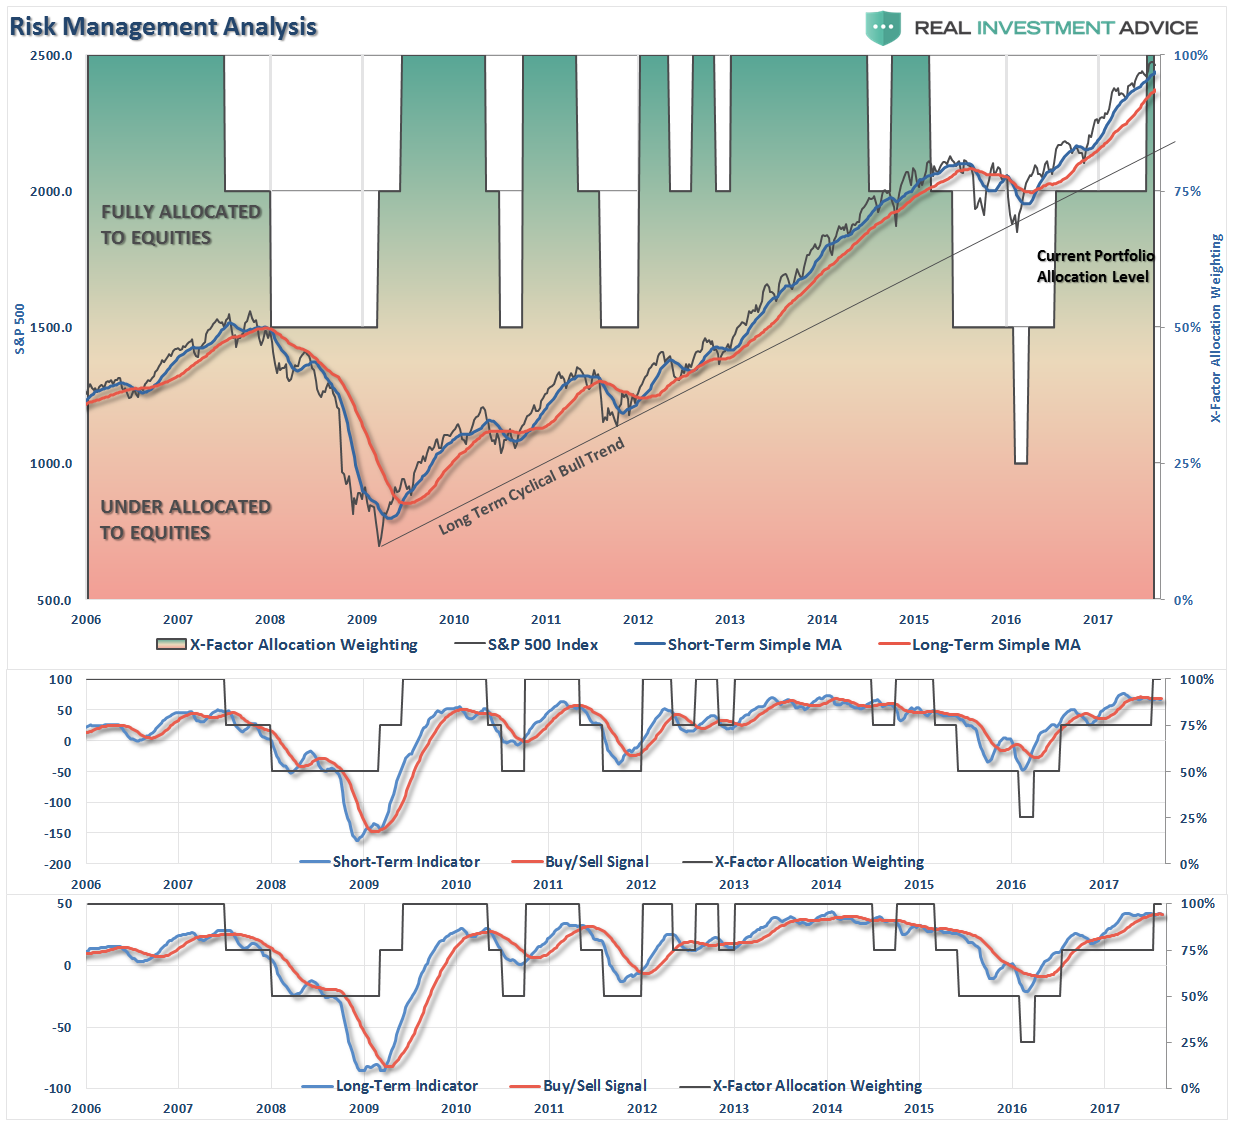
There are 4-steps to allocation changes based on 25% reduction increments. As noted in the chart above a 100% allocation level is equal to 60% stocks. I never advocate being 100% out of the market as it is far too difficult to reverse course when the market changes from a negative to a positive trend. Emotions keep us from taking the correct action.

Warnings Pop Up
Picking up from two weeks ago:
“This past week in the market was a lot like that. While the markets did break out of the previous consolidation range, a bullish event, the conviction of buyers remains somewhat elusive. I did increase the 401k model up to 100% because the market broke out on a technical basis, but as I stated previously, I did so with a high degree of concern.
THERE IS NO REQUIREMENT YOU DO ANYTHING.
Since 401k plans have a limited number of options, AND have limitations as to trading, if you are NOT comfortable with the markets current backdrop, particularly as we head into the last two months of summer, there is no requirement for you to make changes. This model is simply a guide.”
This past week, the markets tripped up on worries over rising geopolitical tensions, and rhetoric, with North Korea. While bullish trends remain intact, the underlying deterioration in the markets, and price momentum, has increased.
This is not a market currently to be trifled with as the overbought and overly bullish conditions remain at extremes with investors chasing momentum with complete disregard to the underlying risk.
Importantly, there continues to be a high degree of correlation between all asset classes. This is particularly disturbing as such a degree of correlation suggests that diversification will not shield investors against losses. This is why we continue to reiterate a regular reassessment of portfolio related risk and positioning.
Stop loss levels should be moved up accordingly.
If you need help after reading the alert; don’t hesitate to contact me.
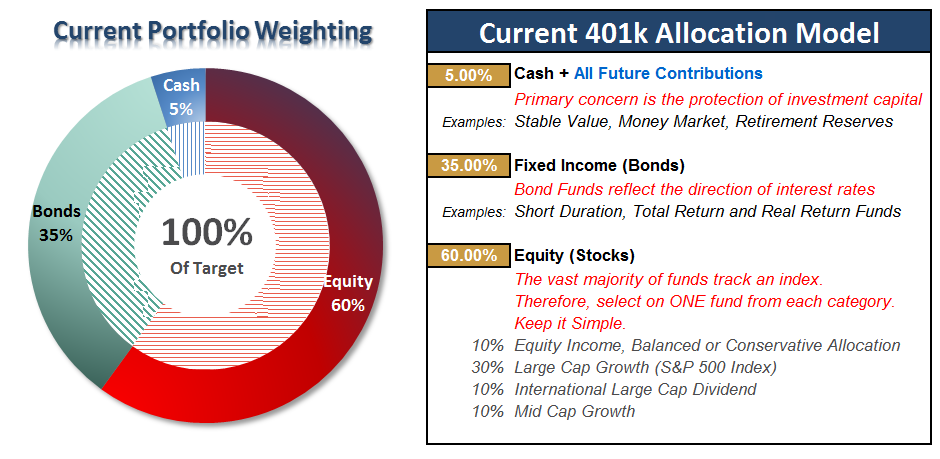
Current 401-k Allocation Model
The 401k plan allocation plan below follows the K.I.S.S. principle. By keeping the allocation extremely simplified it allows for better control of the allocation and a closer tracking to the benchmark objective over time. (If you want to make it more complicated you can, however, statistics show that simply adding more funds does not increase performance to any great degree.)
401k Choice Matching List
The list below shows sample 401k plan funds for each major category. In reality, the majority of funds all track their indices fairly closely. Therefore, if you don’t see your exact fund listed, look for a fund that is similar in nature.

Disclosure: The information contained in this article should not be construed as financial or investment advice on any subject matter. Streettalk Advisors, LLC expressly disclaims all liability in ...
more

