
Is It Time To Worry About Low Oil Prices Again?
Markets raised a lot of interesting questions last week, and most of them had nothing to do with the French presidential elections. The main talking points were the stumble in oil prices—and other industrial commodities—and the growing anxiety that the stop-go cycle in China is edging towards the former rather than the latter. The main question everyone is asking when the market breaks key levels is whether it is the beginning of a more prolonged move.
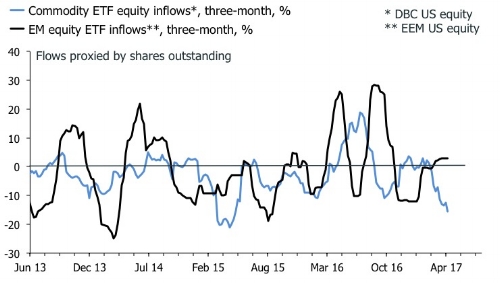
I am no expert, but if pressed I think oil and commodities will snap back. The chart below shows trailing flows of the DBC commodity ETF, which have been depressed recently. This doesn't preclude a further rout, but it suggests that investors' positioning and sentiment don't favor it. This story is corroborated by CFTC data, which shows that spec positioning in oil have been reduced significantly. This doesn't look like a market which is being caught out complacently long as was the case last time oil was routed.
A more fundamental question, though, is what is driving the oil price. Is it supply or demand, or a little bit of both. Last time I found myself between jobs I interviewed for a position as oil strategist/analyst at a large asset manager. I didn't get the job, and given what has transpired in this market since, I am kind of happy I didn't. Would I have predicted the deep dive to $25USD? I doubt it. In any case, here is my theory.
Clearly, OPEC's attempt to control price via supply cuts hasn't worked. This tells us that OPEC is not a real cartel—i.e. that collusion is not effective anymore—or that its members are not the marginal producer in the global economy. It's probably both. This means that we have to look elsewhere for the swing producer, most likely to the U.S. shale cowboys. The crash to $25 was enough for them to stop drilling, but it seems that the rebound and sustained levitation around $50-to-$55 has been enough for them go all in again.
So, if $50-to-$55 is the ceiling, what is the floor? I am not sure that it is as low as $25, but I can't dismiss it. One of the key mistakes markets have made with respect to U.S. shale producers is underestimate their ability to adjust production quickly, and to produce even at very low prices. People smarter than me point out that it isn't as much a question of an actual breakeven price as it is a question of when capital markets will shut down U.S. shale producers' financing. Perhaps we're about to find out at what price that happens.
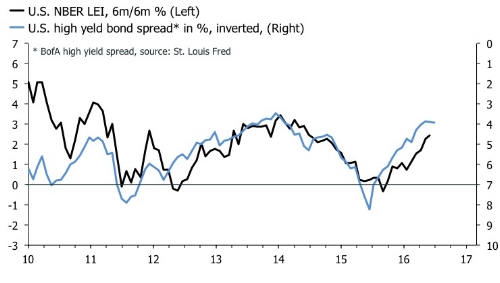
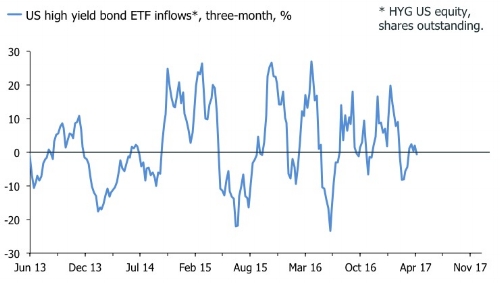
U.S. high yield spreads are certainly tight, but they are not at record lows. In addition, unlike the crash in U.S. economic surprise indices, momentum in the headline leading index does not currently suggest that that the high yield index is about to collapse. Finally, trailing three-month flows into HYG us equity are flat, which also suggests that flows are unlikely to suffer a sustained decline, compared with previous periods of volatility in this market.
I think it is safe to assume, though, that a further fall in oil prices would force spreads wider. And with short-term benchmark rates now higher than last time spreads puked, we also have to worry that stress on a company level would materialize more quickly. This is an important part of the market to watch given the build-up of corporate leverage in the non-financial sector since the crisis. The risk is that a rout in energy space could lead to problem further afield in corporate bond markets in general, and a liquidity crisis given one-sided positioning. We survived the last plunge, but will the heavy hands step in again if it happens again?
Oil isn't the only commodity which has taken a beating; copper, iron ore and other industrial have also been suffering. This has prompted bears to open the China drawer, and pull out the hymn sheet with the song about an impending credit crunch. The idea is that the policy boost to liquidity, which started in the middle of 2016, is waning. The idea here is that the Chinese economy is characterized by a volatile stop-go credit cycle driven by quantitative credit policy by the PBOC. A friend of mine describes it as follows:
Policy stimulus starts with liquidity injections – primarily directed credit expansion – which occurs at the bottom of the cycle, driving excess liquidity sharply higher (max gap between credit growth vs activity & inflation). The opposite dynamic occurs in late cycle: policy tightening slows credit growth as activity is peaking and inflation surges. This is what has occurred over the past six months: credit growth has slowed while activity peaked and inflation (avg PPI & CPI) surged to multi-year highs, driving excess liquidity more sharply lower than any period since the post-2009 stimulus hangover.
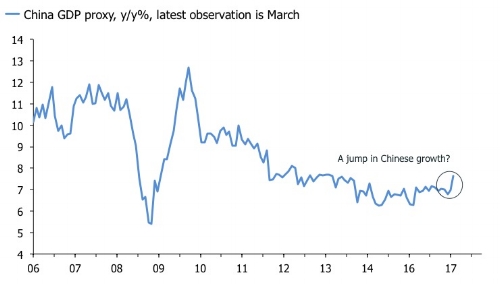
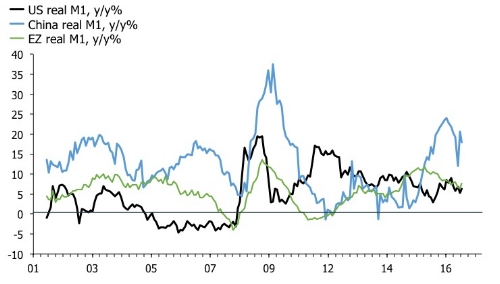
I think this is a good description of the Chinese economy, at least in terms of short-term cyclical gyrations, which tend to drive the narrative and price action in global markets too. But the question is where we are in this process now. After all, base effects alone suggest that growth momentum in commodity prices as well as global PPI indices will ease significantly in coming months. But that doesn't have to signal that the wheels are coming off. Headline data in China have been mixed but isn't deteriorating in a dramatic fashion. The first chart below shows that real M1 growth—which tends to be a good leading indicator in China—bounced back in March following its seasonal plunge in February, and the second shows that Bloomberg's GDP proxy jumped to a three-year high in March. This relatively upbeat story, though, is in contrast to the manufacturing PMI, which slid to a seven-month low of 50.3 in April. To the extent that the survey is right, we should see weakness in the GDP proxy soon.
China followers also will claim that these data only scratch the surface. A weakening "credit impulse" was the key story last week. The chart below shows how Danske Bank is presenting this story to clients, but they aren't the only ones. The credit impulse/PMI chart has been reproduced all over the place in the last few days.
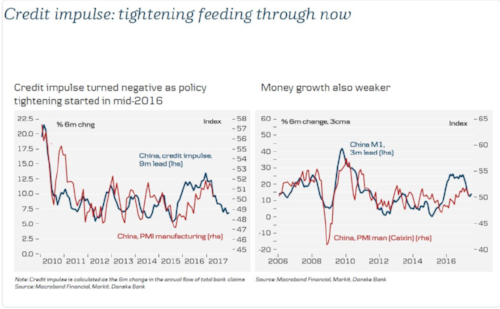
I have some sympathy for this analysis; momentum of credit flows is important for the Chinese business cycle. If the taps are turned off— via higher interbank rates or lower finance quotas by the PBoC—experience tells us that the slowdown in economic will be abrupt, albeit with a lag of about three-to-six months. The final ingredient in the panic scenario is an unruly depreciation of the CNY, and evidence of capital outflows.
The sell-side notes on China that I have seen suggest markets are starting to worry. The story is that quantitative tightening began at the end of Q1, denting shadow banking activity, and the issuance of short-term debt traditionally used to finance real estate investment activities. The idea of the PBoC throwing the book at property developers is not new, and a sharp slowdown here could certainly hurt headline growth. The notes I have gleaned also suggest that local governments' financing of infrastructure products via bank issuance of wealth management products has come under the spotlight. If activity in these sectors grind to a halt, industrial and material equities will be hit across the board in the major economies. The counterpoint is that a resilient Chinese consumer will support cyclical momentum in services, but the survey data aren't exactly upbeat here. The services PMI fell to an 11-month low in April.
As for "credit impulse" indicators, I have issues with them. The sell-side loves them, but let's be clear about this; credit growth usually is a lagging indicator. If we take its second derivative, though, it often leads coincident indicators. But that's cheating because it means that we're using a second derivative to lead a first derivative. Anyone with basic knowledge of math will understand why this is a problem. Taking the second derivative of a lagging indicator does not make it a leading indicator since, by definition, the second derivative of the coincident indicator will lead the credit impulse. Are you confused? Well, in China's case it might actually work given the tight link between economic activity and credit expansion controlled by a central authority. Seasoned China watchers certainly appear to think so, but I remain skeptical. My experience suggests that real M1—which tracks the most liquid component of money/credit flows—is the best leading indicator in China. It is losing momentum, but not dramatically so.
Whatever opinion you might have on Chinese leading indicators, though, it is fair to say that the outlook has darkened for cyclical China bulls. By extension, this story should be grim reading for the proponents of the reflation trade. But this assumes that the "global reflation" trade was driven by China and oil/commodities in the first place.
I suspect it was, but only to some extent.
Another key pivot for the believers in reflation is the promise of growth, via tax cuts and infrastructure spending, from the new U.S. administration. Time is running out for Mr. Trump to deliver the goods here, but last week's victory on the healthcare bill will be seen—by true reflation believers at least—as a sign that the president can in fact push through legislation. This is the case even if the final bill will look very different once chewed over in the Senate, from the one that was passed last week.
U.S. bonds also have so far failed to rally on the somber price action in commodities and angst over Chinese growth. Yields actually rose slightly last week, and the trusty Jonathan Ferro from Bloomberg TV tried repeatedly to get his guests to explain this baffling disconnect, without much success. Perhaps I can help.
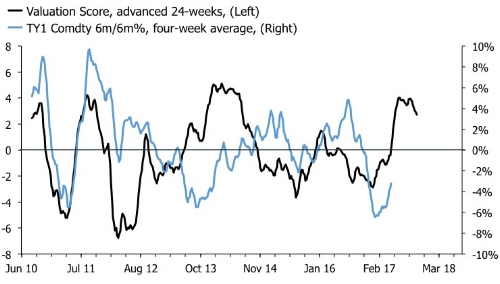
The strong payrolls report which boosted markets' certainty that the Fed will raise in June probably was a key contributor. But positioning also matters. COT data show that spec positioning on U.S. 10y notes have swung violently from short to long in the last eight weeks, making it difficult for bonds to rally in the short run. My reliable valuation score signals more upside for bond prices this year, though, so I am loath to start moving around based on CFTC data. Dips should be bought in my view on the basis that if the Fed has to gun it, the curve will flatten. Bond geeks will undoubtedly remind me that a flattening curve does not have to equate to lower 10-year yields. I get that, but if you look at where 2-year yields are today at 1.2-ish%, and you assume they are going higher because the Fed is moving, then there isn't much room for 10-year yields to move given that we're at 2.2%.
The two main risks to the idea of a flattening yield curve is that Mr. Trump succeeds and that the Fed manages raises rates without killing growth. In that scenario, I reckon the curve would make a parallel shift higher. It would probably remain relatively flat, but an outright long bond position would sting. In this true reflation scenario, though, equities should do well so a balanced portfolio's will be alright. A more sinister outcome is that the Fed gets behind the curve of a Trump presidency in full-on fiscal stimulus mode. If that happens, long rates could conceivably increase very rapidly, very quickly. Eventually, the Fed would have to catch up—and the curve would flatten aggressively—but the period before that would be painful for duration. In addition, I am not sure equities would do necessarily do well if inflation rose too quickly. That said, how many times have people erroneously warned about such a scenario in this cycle?
A final reason why yields have so far been sticky in the face of falling oil and commodity prices could be that markets are looking beyond the near-term hit to inflation data, and the reflation narrative. Weakness in energy and commodity prices could lead to an unravelling in China, but it could also be a shot in the arm for the demand side of the global economy. Low inflation lifts real incomes and boosts global liquidity via the influence on the major central banks' reaction functions. The rise of political uncertainty has had a similar "positive" effect on global liquidity, confounding investors using it as an excuse to throw more money after their already souring bearish bets. This fine balance in the global economy between worries about low growth/deflation and the soothing comfort of Goldilocks as rates/vol stay low forever due to central bank intervention has been a key one to navigate for investors, and I think it will continue to drive prices. The return of a the bullish consumer-sector story due to low inflation is an interesting contrarian thought here, at least in the U.S., where retail have been smacked recently. I know everyone blames this on the structural pressure from Amazon, but if the narrative changes on the U.S. consumer due to lower headline inflation, a lot of retail turds would rise back to the surface quickly I suspect. It's probably too early to be hoping for that, though, and investors should also remember that if this turns out to be the case, it is indeed time for some to worry about low oil prices.


