
Inconceivable! The “Brexit” Reaction
This week’s report is going to deviate a little from the norm as I am just going to focus on the technical impact from the Brexit vote on Thursday, and the subsequent fallout on Friday.
First, let’s pick up with where I left off on Tuesday:
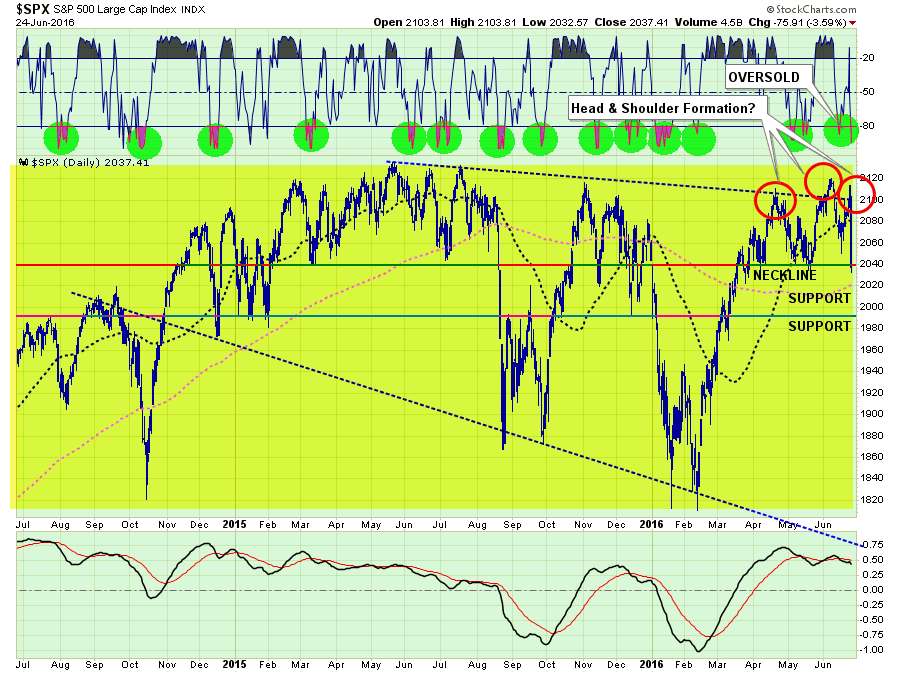
The market has repeatedly made attempts to break out above 2100. But that level has rejected investors more often than Josh Richardson at the net. (Miami Heat)
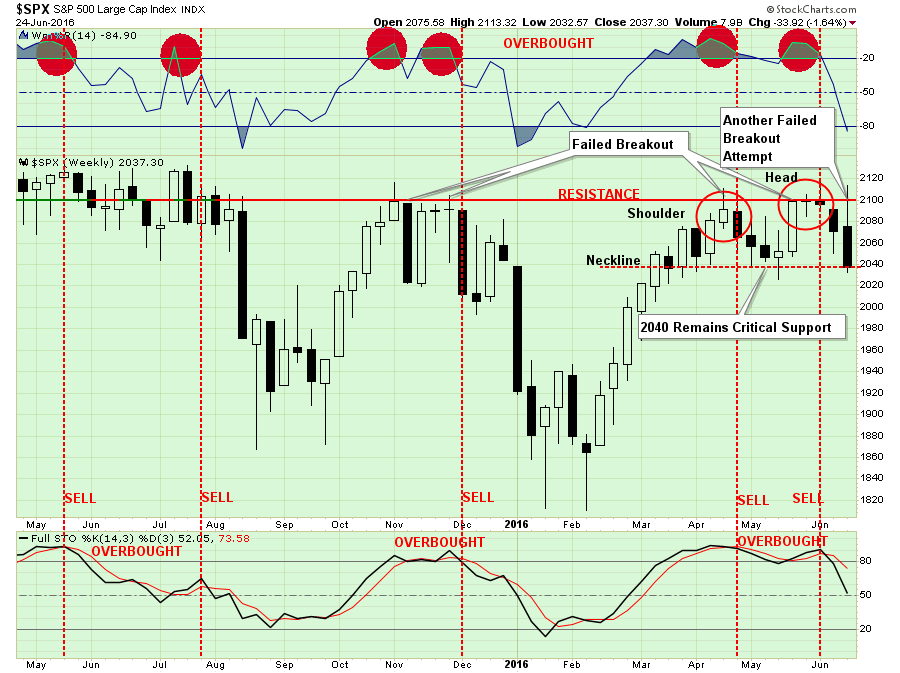
The good news, if you want to call it that, is that 2040 still contains the downside to the market currently. However, the neckline forming at 2040, on a weekly basis, will become critically more important if the development of a “head and shoulder” formation comes to fruition.
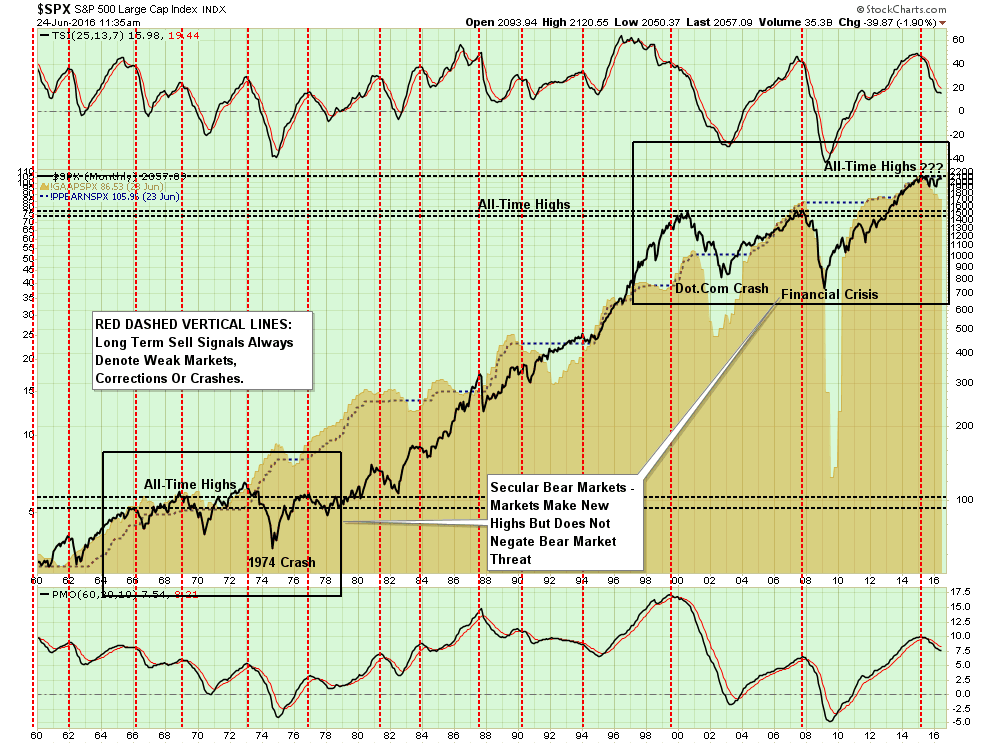
As has been the case since the beginning of the year, the markets have migrated investment strategies to follow “Fed Speak” and headline events rather than fundamentals. The annotated chart below is rapidly running out of room to notate these events while earnings continue to deteriorate.
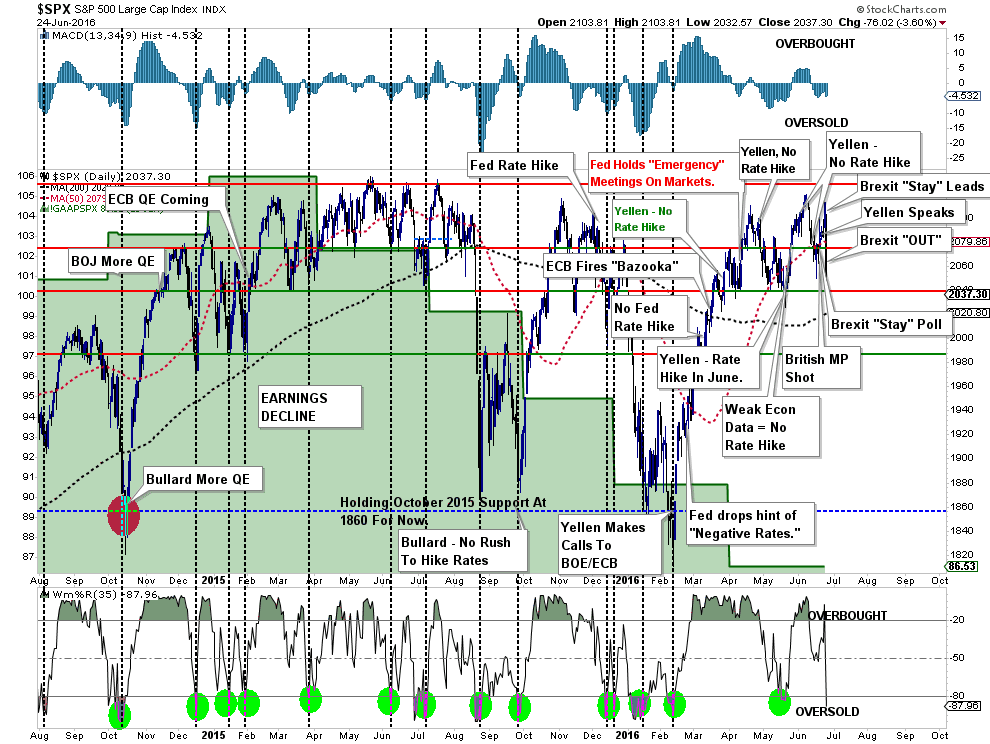
“Of course, the market ignoring fundamentals and focusing on “Fed Speak” is not a new innovation but something seen at the peak of the last two major bull markets.”
As I have stated repeatedly over the last several weeks, with risk outweighing reward, a more cautious stance to portfolio management should be considered. It is always why I continue to hold excess levels of cash:
“However, if the holding of cash is a ‘tactical’ holding to avoid short-term destruction of capital, then the protection afforded outweighs the loss of purchasing power in the distant future.”
The chart below shows the now 13-month long sideways trading range of the market. However, most importantly, the downward trending price pattern remains in place. The recent failure at the downtrend resistance line remains a concern as well as the violation of the short-term moving average which has been acting as support.
The vertical blue-dashed lines denote market sell signals where subsequent price action has been poor, to say the least. While a “sell signal” is NOT CURRENTLY in place, it will not require much further deterioration in price to trigger one.
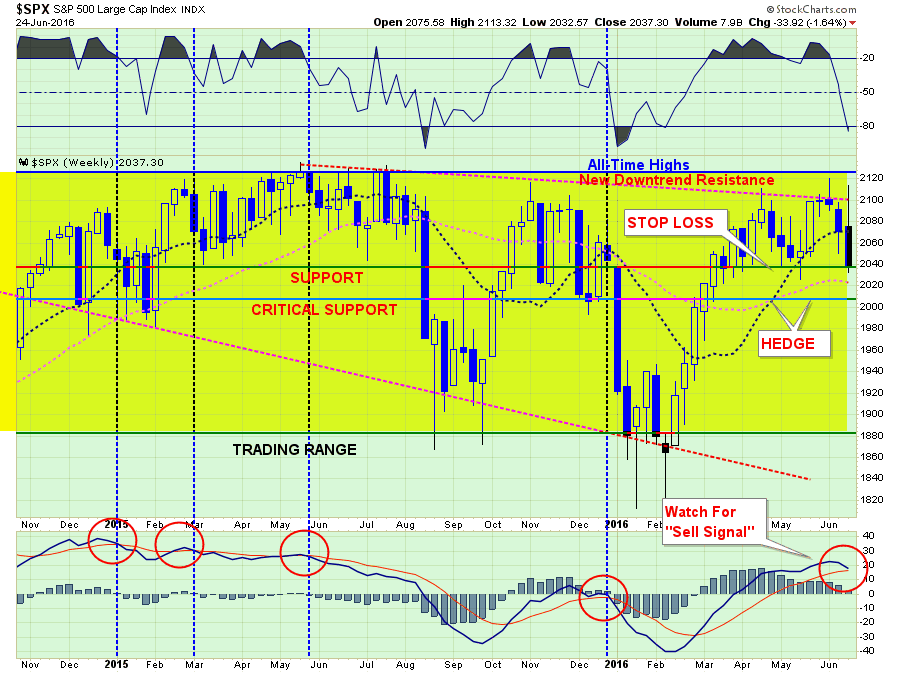
Again, as noted above, the compression that was building between the short-term moving average (blue dashed line) and the current “downtrend resistance” was due to resolve itself. The break to the downside puts 2040 support, as noted above, into focus.
The problem for investors remains the focus on short-term “hopes” rather than longer-term fundamental dynamics. The issue of such “short-termism” is such a focus has had generally poor longer-term outcomes. As discussed in the “Theory Of Bubbles”:
“History is replete with market crashes that occurred just as the mainstream belief made heretics out of anyone who dared to contradict the bullish bias.
It is critically important to remain as theoretically sound as possible. The problem for most investors is their portfolios are based on a foundation of false ideologies. The problem is when reality collides with widespread fantasy.”
DO NOTHING
Last Tuesday, while the markets were ramping higher on expectations Britain would “remain” in the Eurozone, I wrote:
“There are times in portfolio management where ‘doing nothing’ is better than“doing something.” This is one of those times.
With portfolios already running at just 50% of total recommended equity exposure, portfolio risk is already substantially mitigated. This leaves us is the best place to be for the moment as we await the outcome of the ‘Brexit’ vote on Thursday and the culmination of Yellen’s testimony on the ‘Hill.’
From that vantage point, we can then assess the markets and make a reasonable assumption about what to do next. Could we miss a bit of upside? Absolutely. But such a small lag is a much better outcome than trying to recoup a substantial loss if things go wrong.”
Well, things certainly went wrong.
However, the problem is we remain trapped in limbo. With the markets holding above supports, but still within an overall corrective topping process, there is no reason to become extremely negative on the markets at the moment OR be extremely bullish.
In other words, the only option is to continue to “do nothing” until the market resolves its current state in one direction or another.
The bad news is the longer the market remains in this current state, the risk are rising of a more substantial downside break.
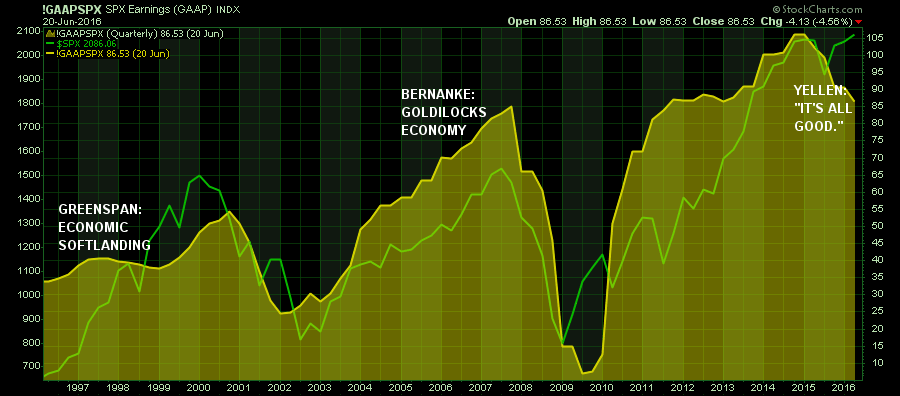
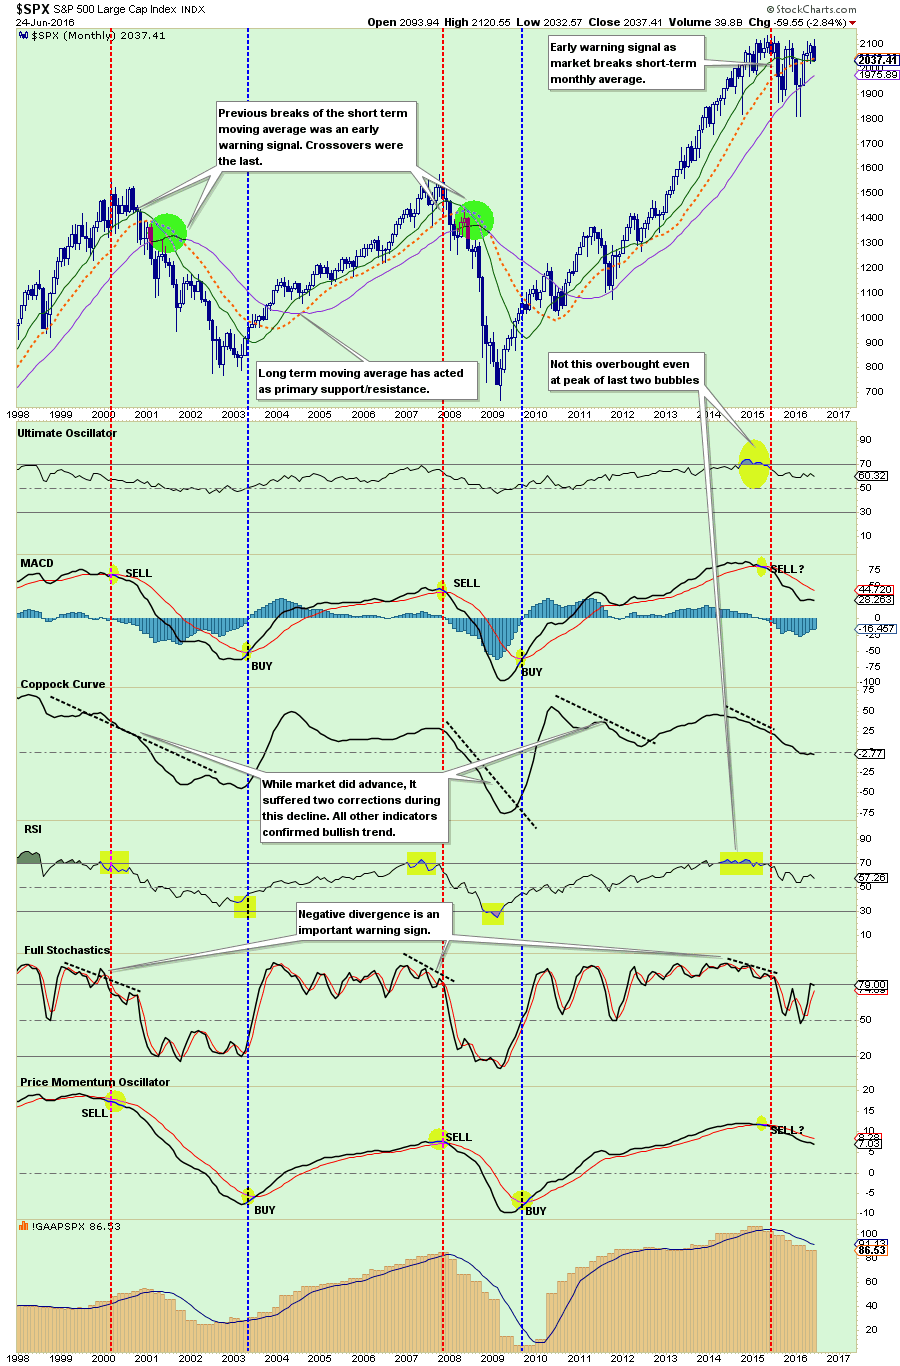
The chart below is a monthly chart of the S&P 500 with GAAP earnings and Peak Earnings shown. The current topping process, stuck below “all-time” highs, is not too dissimilar to what has been seen at previous major bull market peaks. As was the case then, “doing nothing” may be the best solution.
BACK TO FUNDAMENTALS
While the initial shake out of the markets was severe, the “shock” of the exit will be quickly absorbed by the financial markets. In the longer-term, the markets will have to come back to focus on the fundamentals, which are, to say the least, wanting.
As Andrew Lapthorne noted from SocGen earlier this week (via ZeroHedge):
“Whatever the outcome of the Brexit vote this week investors will still be facing the prospect of negative rates and negative yields on a huge range of bonds, massive corporate leverage with worryingly rising delinquencies and of course expensive equity markets and falling profits. To that extent, these political events are a distraction from the main event, weak global economic growth and perverse asset markets. So whilst the market preference for the status quo might be celebrated in the short-term, actually when the fog clears all of the problems will still be there.“
He is absolutely correct. However, this note from Nomura on Friday reiterated the point:
“In a nutshell, we expect the global impact of the Brexit to be more through the financial, confidence and psychology channels than simply through trade. Our warning is to not underestimate the depth and reach of global financial market contagion, which seems to have increased since 2008. For instance, during the European crisis of 2011, when there were significant fears of EU breakup, Asia’s stock and bond markets became much more highly correlated to the Euro Stoxx 50 and the German government bond yield than over 2000-07. And as Hyun Song Shin, economic advisor and head of research at the BIS, recently described it,“the real economy appears to dance to the tune of global financial developments rather than the other way around”, through wealth, confidence, loan collateral and liquidity effects.”
As I have written recently, the markets have been drifting from one Central Bank speech or action to the next. The disregard for underlying fundamentals is something that has only been witnessed at major market peaks historically.
Furthermore, it is virtually assured the Federal Reserve will not hike rates now. In fact, the Fed will likely not hike rates at any point in 2016.
Here are the big risks going forward as money shifts from the instability of Europe to the“safety” of the U.S.
- International and Emerging Market performance will suffer relative to domestic markets.
- USD will strengthen from currency inflows.
- Bond prices will rise (interest rates will fall further)
- Oil prices will decline towards $30/bbl.
- Utilities, REIT’s, Healthcare, and Staples should outperform the S&P 500. (This just means they won’t decline as much as the index)
- Financials, Technology, Discretionary will lag as recessionary forces pick up steam.
- Imports / Exports will continue to suffer weighing on corporate profits (fuggetabout hockey stick earnings recovery.)
This is just some initial outlooks. I will continue to monitor and report on these specific areas each week from a price trend basis and make adjustments/recommendations accordingly.
Of course, the reality is that we will likely see a globally coordinated Central Bank response to the financial markets over the next few days if the selling pressure picks up steam. This will come in the form:
- Further interest rate reductions
- Deeper moves into negative rate territories
- Increased/accelerate bond purchases by the ECB
- A potential short-term QE program by the Federal Reserve
- A pick up of direct equity/bond buying by the BOJ.
- Liquidity supports through FX swaps or direct intervention
- Lot’s and Lot’s of “Verbal Easing”
The problem that potentially exists, and should be paid attention to by investors, is the lack of credibility of the Central Banks themselves. If the Central Banks do intervene, as expected, there is a possibility of a “negative” response by financial markets as the veil of “an improving economic backdrop” is ripped away.
PORTFOLIO ACTIONS
While I stated above that you should “do nothing” over the next day or two until the initial “panic” subsides, it is prudent that over the next few days you continue to take prudent portfolio and risk mitigation actions.
Continue with the steps laid out in the “Monday Morning Call” Section a couple of weeks ago:
- Tighten up stop-loss levels to current support levels for each position.
- Hedge portfolios against major market declines.
- Take profits in positions that have been big winners
- Sell laggards and losers
- Raise cash and rebalance portfolios to target weightings.
Next, as shown in the chart below, tighten up “stop loss” levels and have a strategy to hedge equity risk in portfolios in the event the market breaks down.
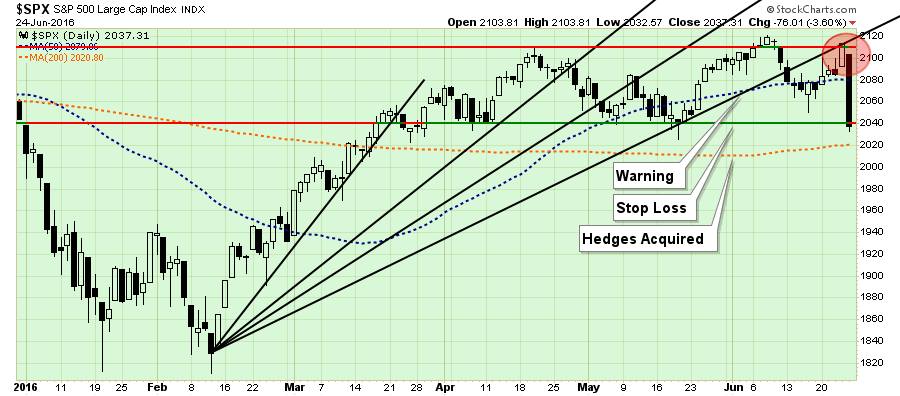
While the 2040 level was “technically” broken on Friday, I recommend waiting until next week before liquidating positions. With the markets now very oversold on a short-term basis, a bounce early next week would not be surprising. Use any bounce to rebalance portfolios.
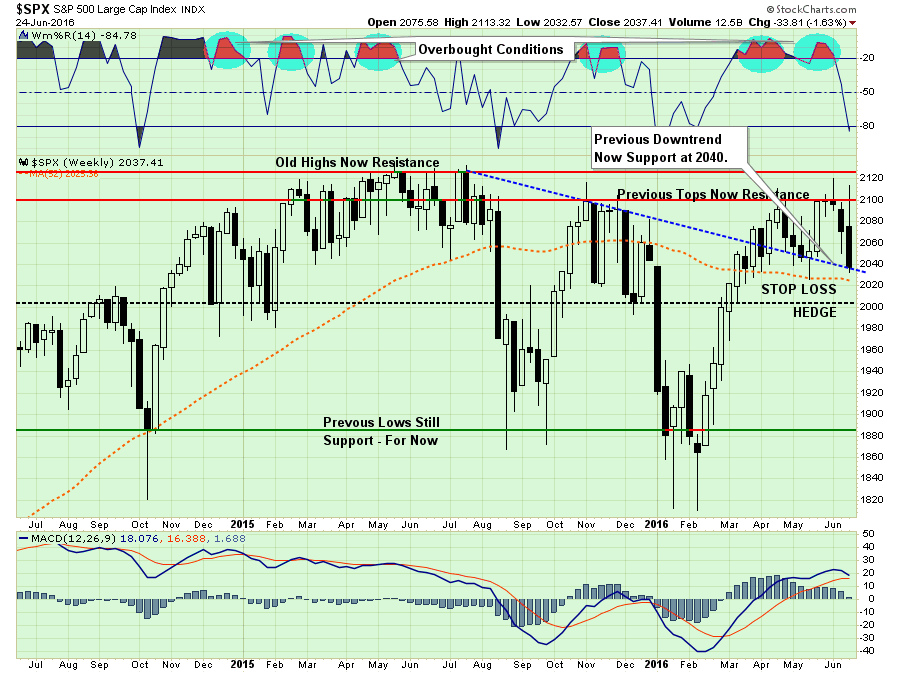
Importantly, I am moving the level where a “negative market (short) hedge” is added to portfolio up to 2020 from 2000. This is due to the recent rally which has pulled the longer-term moving average up to that level as shown above.
This week’s actions is the reason I have continued maintaining a large exposure to “cash” in portfolios despite much criticism. As Mohamed El-Erian discussed last week:
“At a breakfast meeting with reporters on Monday, the former Pacific Investment Management Company chief executive said central bank asset purchases have successfully decoupled asset prices from fundamentals and distorted traditional correlations.
‘Investors cannot rely on correlations as a risk mitigator, making cash a very valuable thing to have.
It can give your portfolio resilience during stressful times, optionality—whether you use it for tactical or strategic purposes and flexibility to deploy it when necessary.’
Central banks are finding it harder and harder to repress volatility in financial markets, and any jolts, such as currency devaluation in China or political events, such as Brexit, result in wild swings in the markets.’
El-Erian also said years of unconventional monetary policy, including asset purchases, and a lack of fiscal stimulus are making developed economies less stable.”
While we can debate over methodologies, allocations, etc., the point here is that “time frames” are crucial in the discussion of cash as an asset class. If an individual is “literally”burying cash in their backyard, then the discussion of the loss of purchasing power is appropriate. However, if the holding of cash is a “tactical” holding to avoid short-term destruction of capital, then the protection afforded outweighs the loss of purchasing power in the distant future.
Of course, since Wall Street does not make fees on investors holding cash, maybe there is another reason they are so adamant that you remain invested all the time.
“In a bear market, the man who wins is the man who loses the least.” – Dick Russell
THE MONDAY MORNING CALL
The Monday Morning Call – Analysis For Active Traders
Caution Advised
While the analysis above was a longer-term outlook of the market, I wanted to touch on the short-term outlook as we head into next week.
I want to note that despite all of the rhetoric, the “Brexit” related meltdown on Friday took the markets all the way back to where they were just one month ago. Yes, tragic for the “bulls” who bought the run-up, not so much for portfolios holding extra levels of cash.
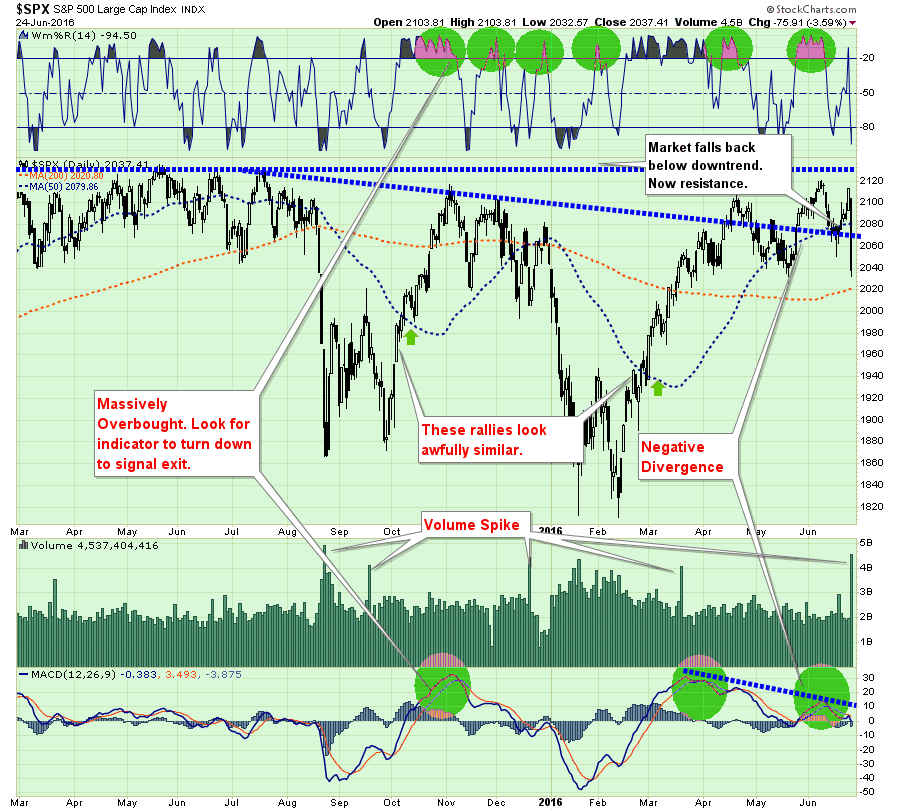
As noted in the chart above, there are some warnings to pay attention to going into next week.
- The volume spike on Friday is very similar to volume spikes in the past which have preceded further sell-offs in the market. This is particularly the case when the spike in volume occurs when there is a negative divergence between market price action and the MACD.
- While the market is oversold on the short-term following Friday’s carnage, which bodes for a short term bounce on Monday, the previous downtrend support line has been broken. That resistance suggests that any bounce seen early next week could be fairly short-lived and should be used for rebalancing risks in portfolios as discussed above.
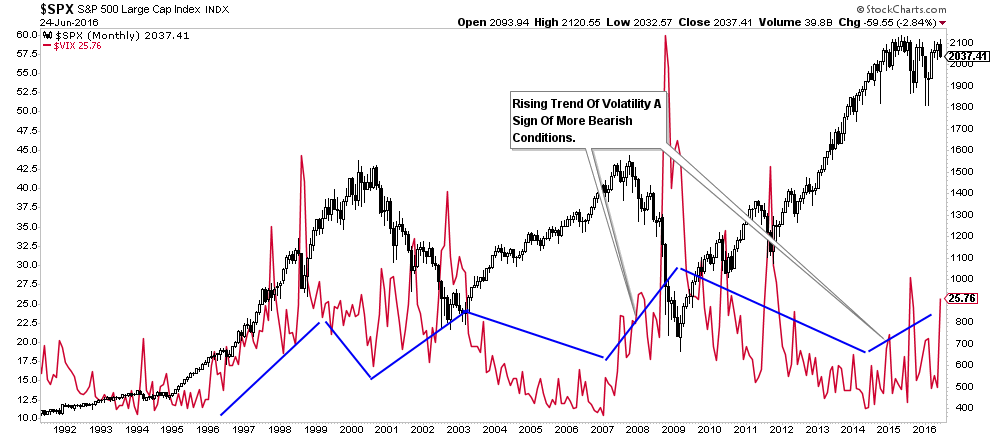
Furthermore, volatility has picked up markedly over the last week. More importantly, as shown in the chart below, volatility is trending higher on a monthly basis which has historically spelled trouble for the markets in the short-to-intermediate term.
One interesting point is on a daily basis, the market appears to be completing a “head and shoulders” formation as shown below. While these patterns are important warnings, on a short-term basis there is a tendency to provide “false flags.”
While there is a history of these short-term formations to provide misleading information, they should not be readily dismissed as there is also a history of these signals being correct. As always, it is easier to add capital to rising markets rather than spending time making up previous losses.
As I stated last week:
“As shown in the top part of the chart above, when the markets are as overbought as they are now, it has generally been at, or near, a short-term peak in the market.
The short-term outlook continues to suggest more vulnerability to selling. The failure of the markets to hold support at 2080 now sets the market up to test support at 2040.
Stop loss levels remain in place at 2040 currently. A break of 2000 will initiate a market-neutral hedging strategy to reduce overall equity exposure and related portfolio risk.“
It will be important the markets hold support next week. Risk is extremely elevated at the moment so caution remains advised.
No Change To Allocations
The inability for the markets to advance, but having not yet violated important support levels, keeps portfolio allocation models once again unchanged.
Two weeks, I discussed the portfolio management rules that guide the investment process in my shop. It is through following these basic rules that, with the markets overbought, underlying fundamentals and economics deteriorating, and profits still weak, that I continue to suggest some portfolio actions be taken to reduce, not eliminate, overall risk as noted above.
On a long-term analysis basis, there is still a weight of evidence suggesting the markets are currently working through a major topping process. Yes, maybe this “time will be different,” however, historically speaking it hasn’t been.
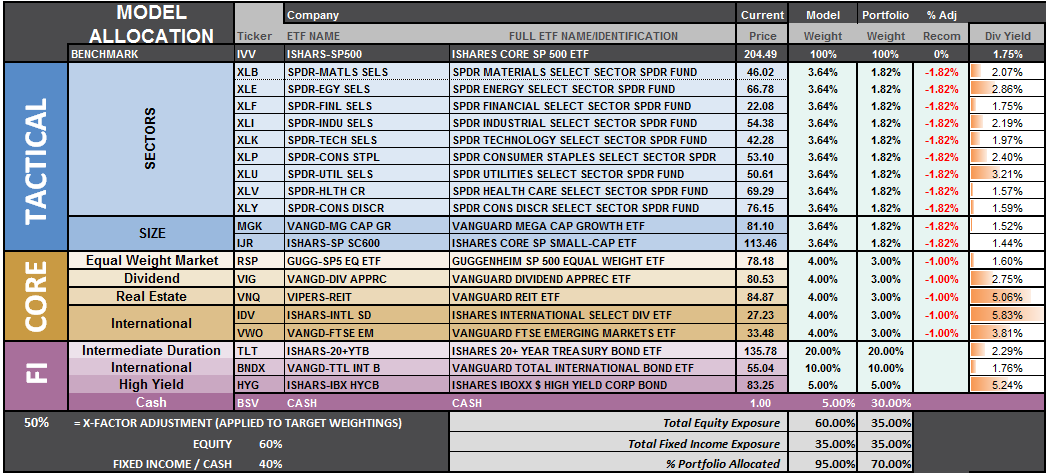
S.A.R.M. Model Allocation
The Sector Allocation Rotation Model (SARM) is an example of a basic well-diversified portfolio. The purpose of the model is to look “under the hood” of a portfolio to see what parts of the engine are driving returns versus detracting from it. From this analysis, we can then determine where to overweight sectors which are leading performance, reduce in areas lagging, and eliminate those areas that are dragging.
This past week, as over the last five weeks, we continued to see the relative rotation from RISK to SAFETY as performance improved in bonds and areas that benefit from lower rates. Furthermore, RISK based sectors have continued to wane in performance and the number of sectors leading the markets have continued to shrink. As I stated previously, such action is indicative of short-term topping process following an advance. This is exactly what we continue to see play out currently, which was the same as we witnessed during the summer and winter of 2015.
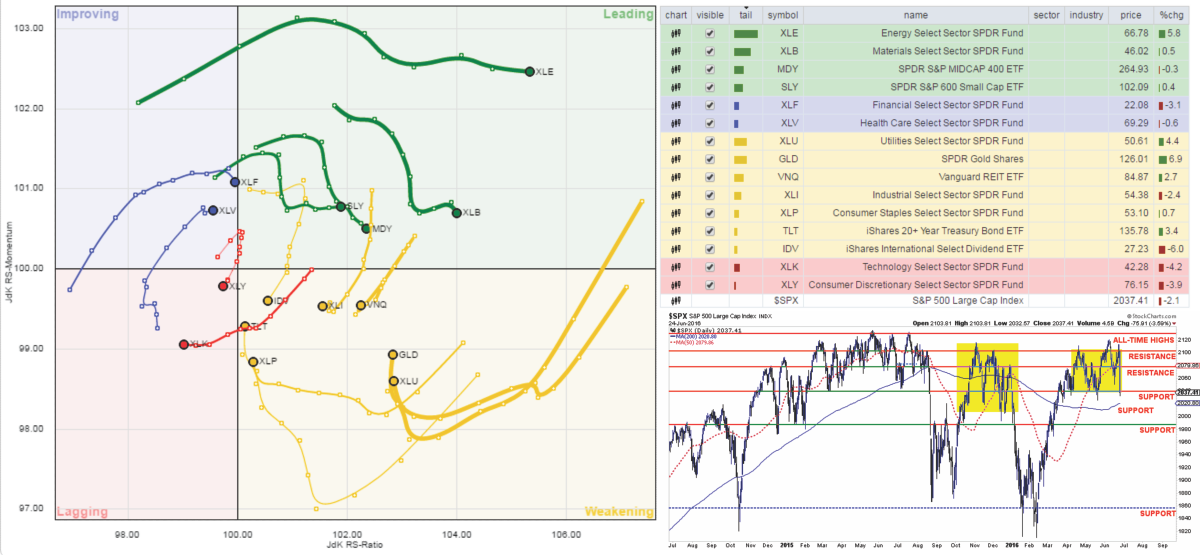
All sectors, with the exception of the major DEFENSIVE areas of Utilities, Gold, and Bonds, lost ground last week.
The sector recommendations last week paid off handsomely this week.
As I recommended last week:
LEADING: Energy, Materials, Mid-cap and Small-cap (Take Profits)
IMPROVING: Financials and Health Care (Hold)
LAGGING BUT SHOWING IMPROVEMENT: Utilities, Gold, Bonds and Staples (Hold and Selectively Add)
LAGGING & WEAKENING: Discretionary, Technology, International, Industrials, & REITs (Reduce)
The sector comparison chart below shows the 9-major sectors of the S&P 500.
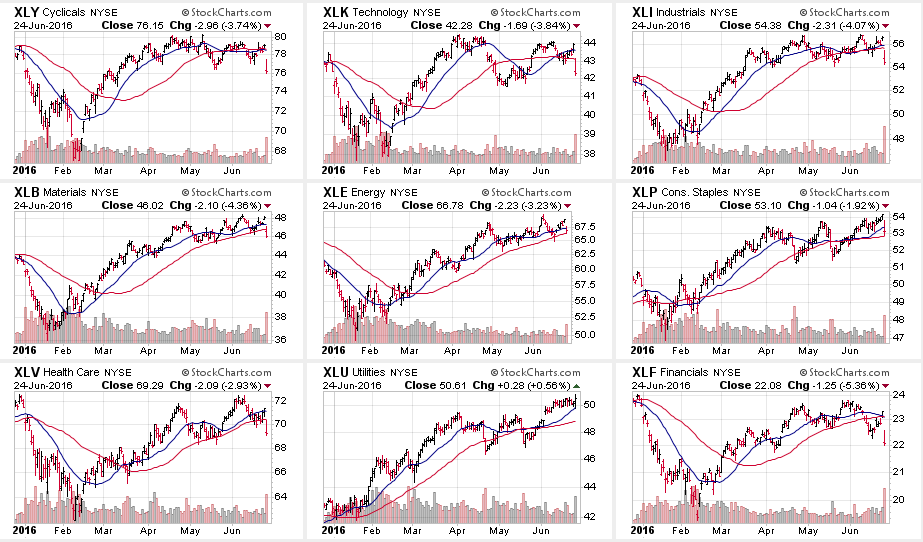
The sell-off last week was most clearly seen in across all sectors of the market last week with the exception of Utilities. The hardest hit sector was Financials as the decline of interest rates, the “Brexit,” and the inability of the Fed to hike rates, led to continuing concerns about net-interest margins and balance sheet risk in the sector. Importantly, 6 out of 9 sectors are trading below both their short and intermediate-term moving averages.
Healthcare, which I stated three weeks ago was pushing extreme overbought conditions and some profit taking would be wise, also fell sharply this past week.
The case with Healthcare is now seen in Utilities. The very sharp push in the sector has now pushed it back into extreme overbought territory. While the “yield chase” is still intact, it would be rise to take some profits from the sector near term.
On a short-term basis, bonds and gold are pushing extreme levels of deviation, profit taking at these levels would be strongly recommended.
As I stated last week:
“We saw the early stages of deterioration in leadership in Small and Mid-Cap stocks last week, so profit taking would be suggested.“
That proved prescient.
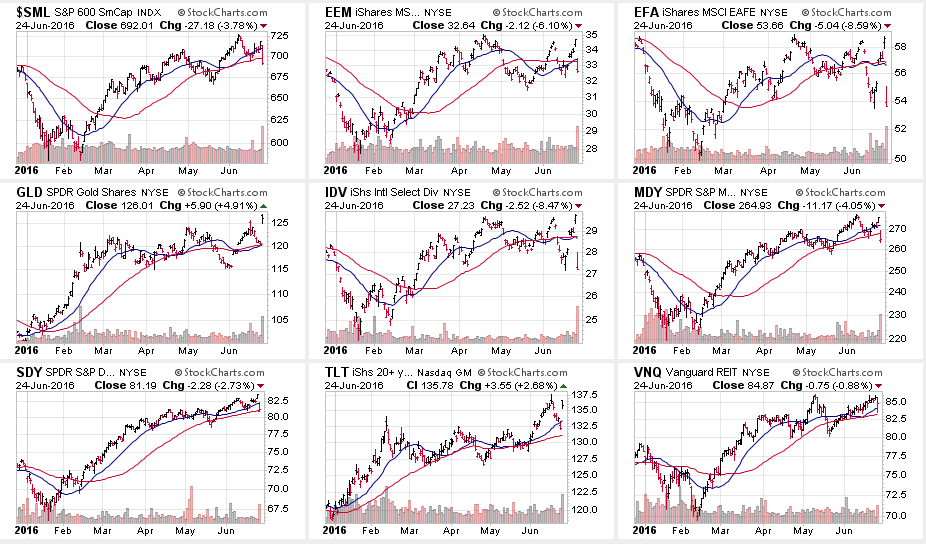
In portfolio models, I have continued to admonish international and emerging market exposure. These asset classes have continued to act as an anchor to the performance of traditional asset allocation models. The flight to safety into domestic assets following the“Brexit” last week, continues that run of relative outperformance over international holdings.
S.A.R.M. Sector Analysis & Weighting
The current risk weighting remains at 50% this week. The failure to maintain the breakout above 2100 holds allocation changes for now. With technical underpinnings still “bullishly biased,” we want to give the markets the benefit of the doubt for now. However, with those technical underpinnings deteriorating, risk has risen markedly.
Relative performance of each sector of the model as compared to the S&P 500 is shown below. The table compares each position in the model relative to the benchmark over a 1, 4, 12, 24 and 52-week basis.
Historically speaking, sectors that are leading the markets higher continue to do so in the short-term and vice-versa. The relative improvement or weakness of each sector relative to index over time can show where money is flowing into and out of. Normally, these performance changes signal a change that last several weeks.
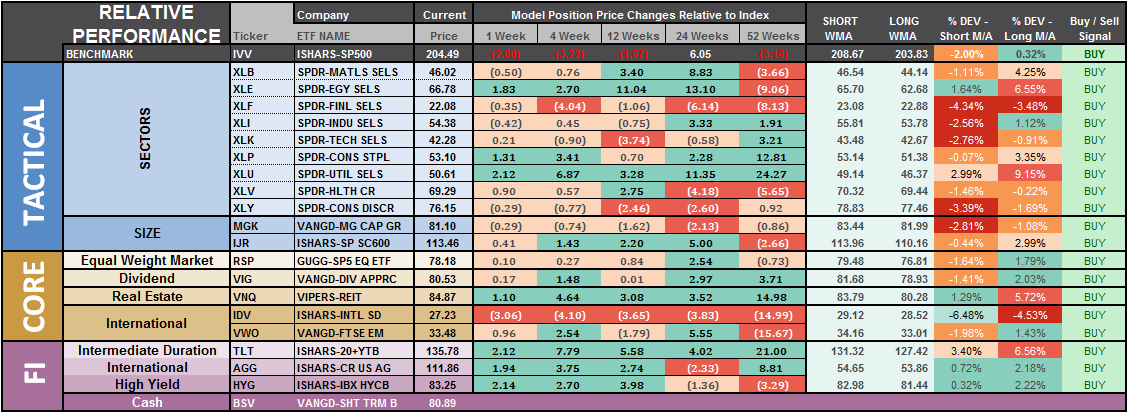
The last column is a sector specific “buy/sell” signal which is simply when the short-term weekly moving average has crossed above or below the long-term weekly average. The number of sectors on “buy signals” has improved from just 2 a few weeks ago to 19 this past week.
The risk-adjusted equally weighted model remains from last week. No changes this week.
The portfolio model remains at 35% Cash, 35% Bonds, and 30% in Equities.
As always, this is just a guide, not a recommendation. It is completely OKAY if your current allocation to cash is different based on your personal risk tolerance, time frames, and goals.
For longer-term investors, we need to see an improvement in the fundamental and economic backdrop to support a resumption of the bullish trend. Currently, there is no evidence of that occurring.
THE REAL 401k PLAN MANAGER
The Real 401k Plan Manager – A Conservative Strategy For Long-Term Investors
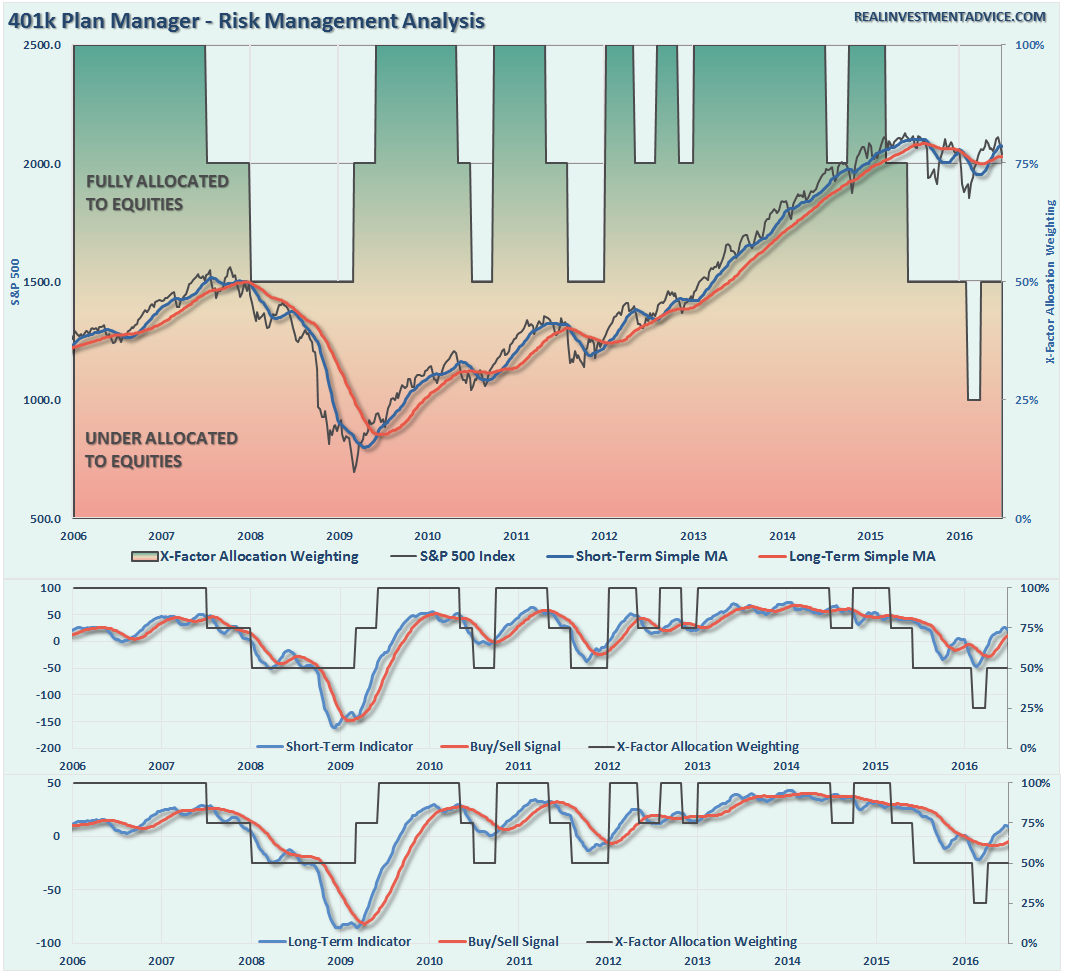
NOTE: I have redesigned the 401k plan manager to accurately reflect the changes in the allocation model over time. I have overlaid the actual model changes on top of the indicators to reflect the timing of the changes relative to the signals.
There are 4-steps to allocation changes based on 25% reduction increments. As noted in the chart above a 100% allocation level is equal to 60% stocks. I never advocate being 100% out of the market as it is far too difficult to reverse course when the market changes from a negative to a positive trend. Emotions keep us from taking the correct action.

“Brexit”
As discussed in the main section of the newsletter, the surprise “Brexit” on Thursday sent the markets plunging on Friday. While “bulls” were sent scrambling for cover, the overweight cash and fixed income holdings protected 401k plans nicely this past week.
Furthermore, the technical underpinnings, while still bullishly biased at the moment, are beginning to deteriorate. That, combined with the failure of the market to breakout about 2100 keeps allocation models on hold, again, this week. In other words, we remain in “limbo” and frustratingly so.
As I stated last week:
“With technical buy signals currently in place, it suggests that allocations should be moved up to 75%. However, given the inability to rapidly change allocations in many 401k plans, due to trading limitations, I would rather wait for a clear breakout above resistance and a re-establishment of the “bullish trend” before taking on additional equity risk.
Also, as we head into the seasonally weak time of year, combined with what appears to be a rather volatile Presidential election, “Brexit,” and weakening economic underpinnings, some extra levels of precaution seem prudent.”
That turned out to be very good advice. Once again, there are no changes to the 401k model this week as risk/reward is still not balanced enough to justify taking on additional model risk.
For longer-term investors, the markets have made virtually no progress since January of 2015. Therefore, there is little evidence to suggest stepping away from a more cautionary allocation…for now.
If you need help after reading the alert; don’t hesitate to contact me.
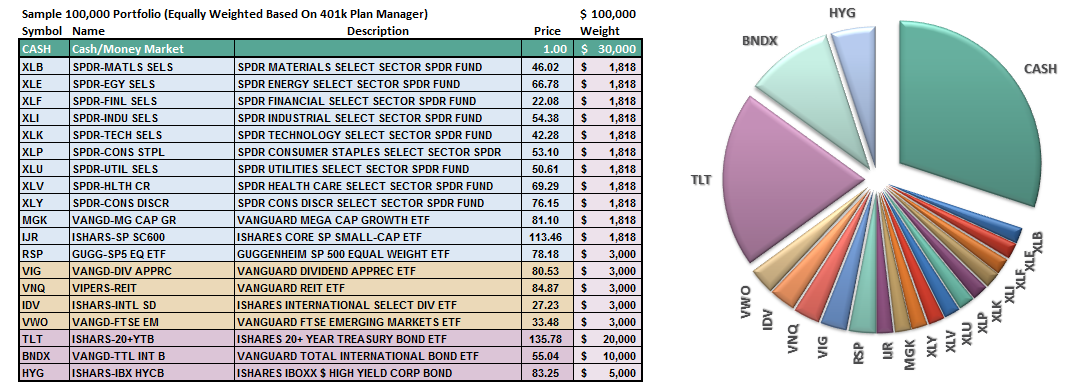
Current 401-k Allocation Model
The 401k plan allocation plan below follows the K.I.S.S. principal. By keeping the allocation extremely simplified it allows for better control of the allocation and a closer tracking to the benchmark objective over time. (If you want to make it more complicated you can, however, statistics show that simply adding more funds does not increase performance to any great degree.)

401k Choice Matching List
The list below shows sample 401k plan funds for each major category. In reality, the majority of funds all track their indices fairly closely. Therefore, if you don’t see your exact fund listed, look for a fund that is similar in nature.

Disclosure: The information contained in this article should not be construed as financial or investment advice on any subject matter. Streettalk Advisors, LLC expressly disclaims all liability in ...
more

