
CoT: How Hedge Funds Are Positioned For The Week
Following futures positions of non-commercials are as of October 23, 2018.
10-year note: Currently net short 544k, down 71.9k.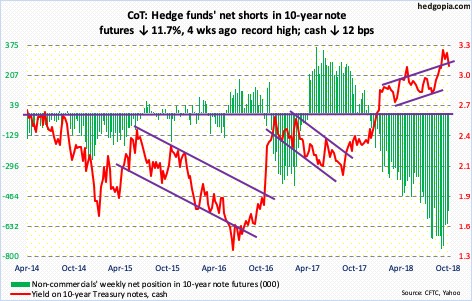
The 10-year Treasury rate (3.08 percent) shed 12 basis points this week – now down 17 basis points from the intraday high of 3.25 percent reached on October 5, which was the highest since May 2011. These notes have had quite a drop, with yields as low as 2.03 percent in September last year and 2.81 percent on August 22 this year.
Both weekly and monthly charts are in overbought territory. Rather menacingly for bond bears, with three sessions to go, October so far has produced a gravestone doji on the 10-year rate. This is a potential bearish reversal candle. Non-commercials, who have cut back quite a bit in the past month but remain massively net short these notes, are not betting on this outcome. They would profit if yields rallied higher. A scenario in which interest rates head lower exposes them to a risk of short squeeze down the line.
30-year bond: Currently net short 87.8k, down 16.1k.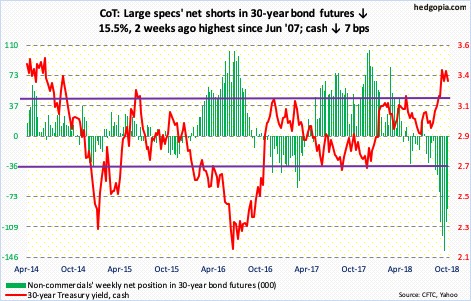
Major economic releases next week are as follows.
Personal income and spending for September is scheduled for Monday. In the 12 months to August, core PCE (personal consumption expenditures) – the Fed’s favorite measure of consumer inflation – rose 1.96 percent. July’s 2.03-percent increase was the first two-plus reading since April 2012.
August’s S&P Case-Shiller home price index is on tap for Tuesday. Nationally in July, home prices increased six percent year-over-year. Prices are rising much faster than inflation. That said, growth is decelerating from March’s 6.5 percent.
The employment cost index for 3Q18 is due out Wednesday. In the 12 months through June, compensation costs for private-industry workers rose 2.9 percent. This was the fastest growth rate in a decade.
Thursday brings labor productivity (3Q18) and the ISM manufacturing index (October).
Non-farm output per hour increased 1.3 percent y/y in 2Q18. Productivity remains suppressed.
Manufacturing activity in September fell 1.5 points month-over-month. August’s 61.3 was the highest since 61.4 in May 2004. It is hard to sustain this kind of pace.
On Friday, October’s employment report and revised durable goods data for September are on the docket.
The economy created 134,000 non-farm jobs in September, for a monthly average this year of 208,000. If the trend persists in the remaining three months, this would represent a first up year in four. In 2017, the monthly average was 182,000, versus 195,000 in 2016, 226,000 in 2015 and 250,000 in 2014.
Orders for non-defense capital goods ex-aircraft – proxy for business capex plans – rose a mere 1.9 percent y/y in September. This is a huge deceleration from the 8.8-percent pace as early as July.
Crude oil: Currently net long 510.6k, down 32.9k.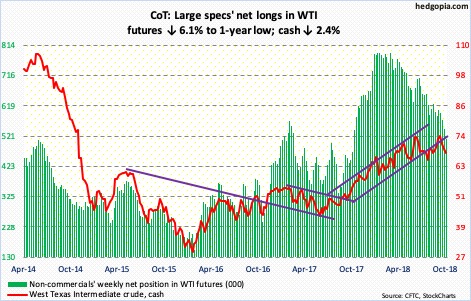
Spot West Texas Intermediate crude ($67.59/barrel) opened the week with a breach of trend-line support from June last year. Monday’s intraday low of $65.74 was still higher than the mid-August low of $64.43. This is scant consolation for oil bulls, given oil has taken quite a hit since peaking at $76.90 early this month.
On the weekly, there is still room for the crude to continue lower. The daily, however, has been pushed into oversold territory. Odds of a rally have grown near term.
In the meantime, the EIA report for the week of October 19 showed crude stocks continued to build, up 6.3 million barrels to 422.8 million barrels. Crude imports rose too, up 63,000 barrels per day to 7.7 million b/d. Stocks of gasoline and distillates, however, continued to drop – down 4.8 million barrels and 2.3 million barrels respectively to 229.3 million barrels and 130.4 million barrels. Crude production remained unchanged at 10.9 mb/d. Refinery utilization inched up four-tenths of a point to 89.2 percent.
E-mini S&P 500: Currently net long 239.4k, up 12.6k.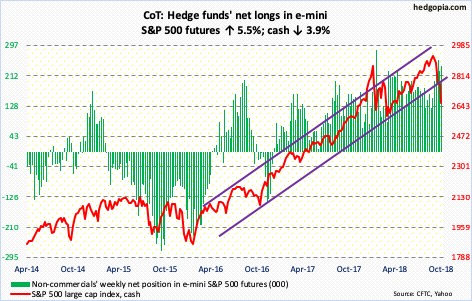
The cash (2658.69) this week went on to lose trend-line support from February 2016. By Friday’s intraday low of 2628.16, it was down 10.6 percent from the all-time high reached on September 21. The daily, in particular, is extremely oversold. Friday, only 11 percent of S&P 500 stocks were above the 50-day, matching the low of October 11.
Friday’s candle with very long upper and lower shadows is a testament to the indecision developing among traders. The daily RSI is beginning to show positive divergence. The 200-day (2767.03) lies above. Apart from this, a genuine bull-bear duel will be fought around 2800. Last week, rally attempts were denied at that resistance.
Perhaps encouraging for bulls, flows improved. In the week to Wednesday, US-based equity funds (including ETF’s) gained $4.2 billion (courtesy of Lipper.com). In the same week, SPY (SPDR S&P 500 ETF) took in $3.3 billion, IVV (iShares core S&P 500 ETF) $497 million and VOO (Vanguard S&P 500 ETF) $257 million (courtesy of ETF.com).
Euro: Currently net short 30.3k, up 960.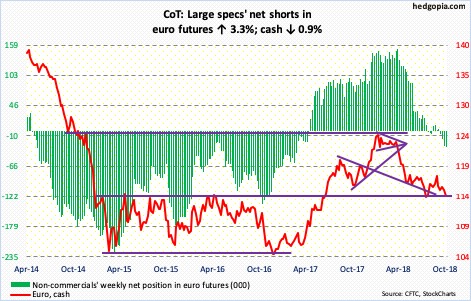
The ECB Thursday reiterated that rates would remain at their present record lows at least through the summer of 2019. The cash ($114.22) in that session lost 0.2 percent. The currency was already under pressure, having once again failed at $115-plus resistance. Mid-August, the euro fell intraday to $113.01, before reversing higher to subsequently get rejected at just north of $118. That low serves as a good reference point.
Gold: Currently net long 29.4k, up 11.7k.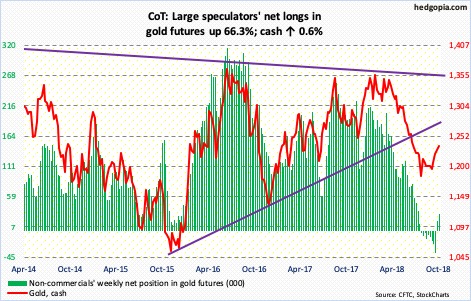
Resistance at $1,240-ish continues to draw sellers on the cash ($1,235.80/ounce). This has been going on for two weeks now. Bulls’ inability to break through this ceiling comes amidst improvement in flows. In the week to Wednesday, GLD (SPDR gold ETF) attracted $36 million. This was preceded by inflows of $726 million in the prior two. In the same week, IAU (iShares gold trust) took in $95 million (courtesy of ETF.com).
Amidst this, the daily is overbought. Thus far, gold bugs have defended short-term support at $1,230. In the event it is lost, there is support at $1,213-ish, followed by the 50-day ($1,208.64), which is now curling up. Longer-term, several monthly momentum indicators have either turned up or are on the verge of doing so.
Nasdaq 100 index (mini): Currently net long 9.3k, up 8.9k.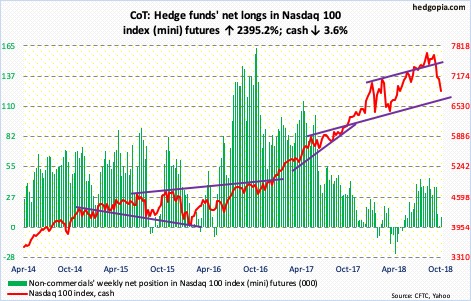
Wednesday’s 4.6-percent collapse in the cash (6852.40) undercut the low of October 11. This was followed by a 3.4-percent rally Thursday, which saw sellers reappear at the 200-day (7065.90). Since peaking on October 1 at 7700.56, the Nasdaq 100 has lost many a support, including a rising trend line from February this year.
Shorts have been rewarded. In the October 1-15 period, short interest on QQQ (Invesco QQQ Trust) jumped 42.5 percent period-over-period to an eight-month high. In a perfect scenario for tech bulls, this can come in handy if these shorts begin to cover/or are forced to cover. For that to occur, flows, among other things, need to cooperate. In the week ended Wednesday, QQQ lost $278 million (courtesy of ETF.com).
The daily in particular remains grossly oversold. Shorts likely reduce their exposure if 7300 is recaptured, which is where they showed up last week.
Russell 2000 mini-index: Currently net short 81.7k, up 3.4k.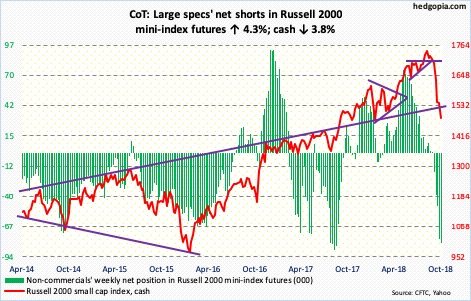
Having already sliced through a rising trend line from February 2016, lost major horizontal support at 1610-ish as well as both the 50- and 200-day, the cash (1483.82) proceeded to undercut the low of October 12. Friday’s intraday low of 1459.16 means the Russell 2000 lost 16.2 percent from its all-time high of August 31. This took place without much of a decent bounce. One is due, assuming Friday’s low holds. It is perhaps this anticipation that both IWM (iShares Russell 2000 ETF) and IJR (iShares core S&P small-cap ETF) saw positive flows in the week through Wednesday – $1.3 billion and $108 million, respectively (courtesy of ETF.com).
US Dollar Index: Currently net long 38k, up 152.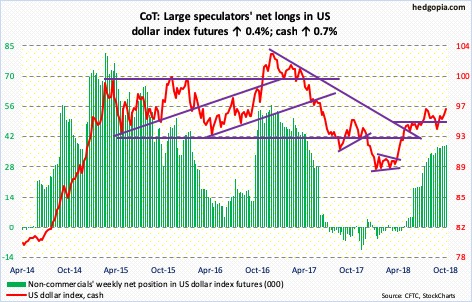
Post-defense of 95-plus Thursday and Friday last week as well as Monday this week, the cash (96.13) took out short-term resistance at 95.80-ish, before posting higher highs. Since September 21, there is already a pattern of higher lows. The upper bound of this channel draws to 97, which approximates the mid-August high of 96.87. Friday, the US dollar index rallied to 96.62 intraday before closing down 0.3 percent. The daily is itching to go lower.
VIX: Currently net short 10.3k, down 22.7k.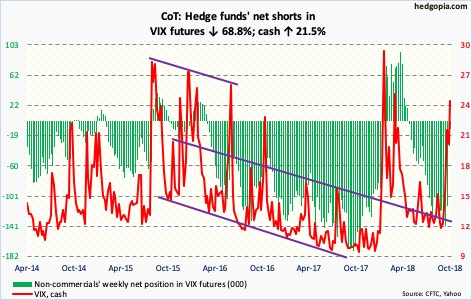
Volatility is holding ground. Monday was the only session this week the cash (24.16) closed sub-20 – closed at 19.64. Nonetheless, even as major indices dropped to fresh lows this week, VIX has not surpassed the October 11th intraday high of 28.84. Friday, VIX closed down 0.3 percent, even as the S&P 500 fell 1.7 percent! The path of least resistance is for volatility to subside – duration and magnitude notwithstanding. Non-commercials have been actively cutting back their net shorts.
On a related note, on a closing basis, the VIX-to-VXV ratio read 1.12 on Wednesday; Friday was 1.08. This is way elevated, and needs to unwind.
Concurrently, the 21-day moving average of the CBOE equity-only put-to-call ratio closed out the week at 0.669. Ideally, the ratio can rise to high-0.60s to low-0.70s. That said, it has risen quite a bit from 0.588 on September 25. Much of the optimism US stocks reflected back then has been unwound.
Disclaimer: This article is not intended to be, nor shall it be construed as, investment advice. Neither the information nor any opinion expressed here constitutes an offer to buy or sell any ...
more

