
Breakout Failure As Resistance Holds
Last week, I discussed the “Seemingly Bulletproof Market” and how, despite the carnage in Technology and Discretionary sectors, the overall market was mostly unaffected.
“Stepping back from the sector-specific action, if you only looked at the S&P 500 to judge what was happening in the markets, you wouldn’t suspect anything was wrong.”
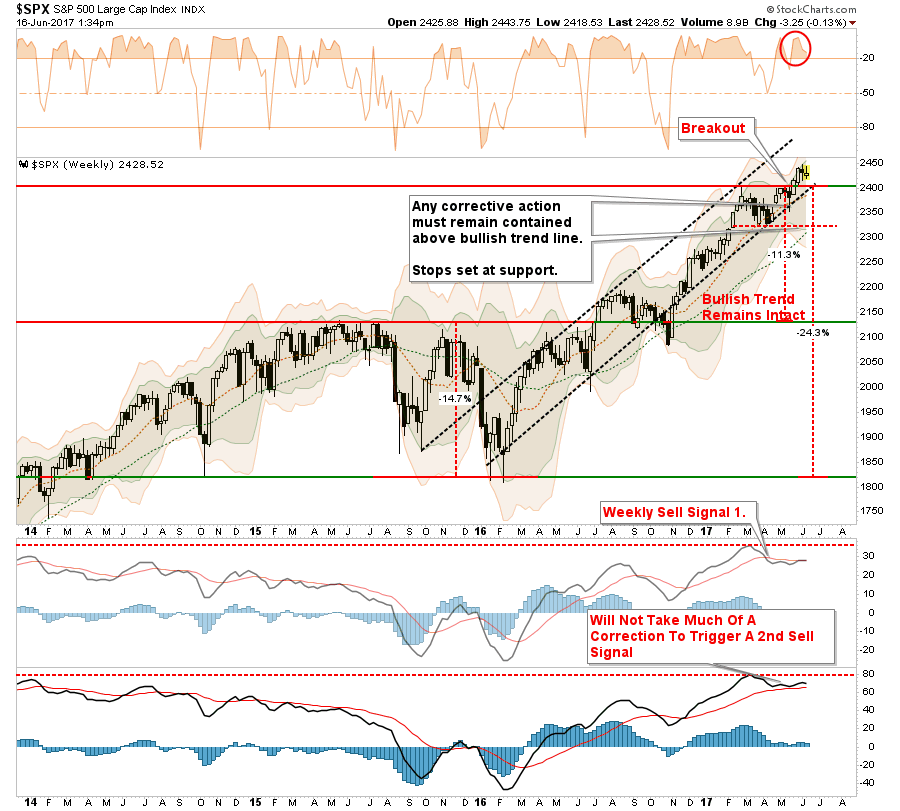
“The market breakout remains intact currently with support at 2400 holding firm. The bullish trend line, which also intersects at 2400 remains critically important as the secondary buy/sell signal remains in positive territory. The only negative currently, despite improvement, is the ‘weekly sell signal-1’ remains triggered which keeps us on ‘alert.’ (It is also worth noting both signals remain at VERY high levels which suggest current upside remains somewhat limited.)
You can understand why more and more commentary is beginning to succumb to the ‘siren’s song’ of why ‘this time is different.’ Whether it is terrorist attacks, poor economic data, geopolitical tensions, or plunging oil prices, the market has continued its advance. It certainly seems to be ‘bulletproof.’”
That was SOOOO last week.
Last Monday, the markets shot out of the gate and rose 20 points for the day which confirmed the breakout above previous resistance. Unfortunately, that bout of “exuberance” was short-lived and the rally faded for the rest of week closing back below resistance as shown below.
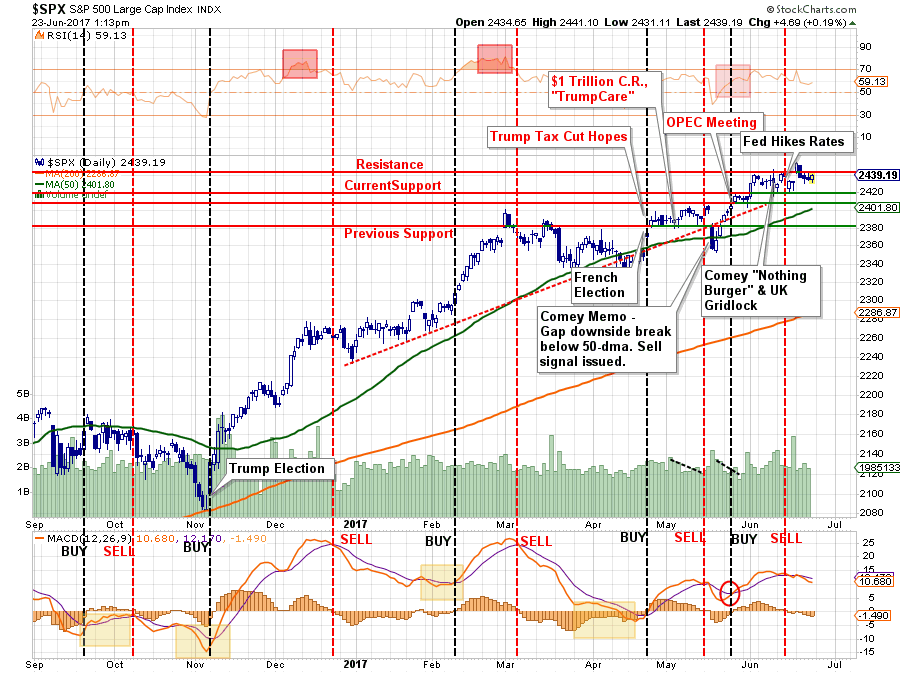
Importantly, note the short-term “sell signal” remains intact in the lower part of the chart as well as the “weekly sell signal” in the chart above. Both of these suggest warnings suggest pressure is to the downside currently as we head into the month of July and the “Dog Days Of Summer.”
From a portfolio positioning standpoint, nothing has really changed at the current time. As I noted in last week’s missive:
“During last week’s pullback, we added modestly to our broader-based ‘core’ holdings for the second time over the last couple of months. to participate with the breakout. Stops have been moved up and remain very tight.
While I remain very cautious on the overall market, the trend remains bullishly biased which keeps portfolios allocated on the long side for the time being. However, I will not be surprised by a reversal and failure of the breakout leading to us getting stopped out of positions.”
We remain extremely “alert” to the underlying strength of the market and are not taking on excessive risk with portfolio allocation models.

With volatility suppressed, legislative agenda stalled, economic data weak and earnings growth expectations at risk, remaining somewhat cautious, and alert, makes sense to us. As stated, while we remain long at the moment, we do so with a very “twitchy trigger finger.”
Sector By Sector
With that bit of analysis in place, let’s review the market environment for risks and opportunities.
ENERGY
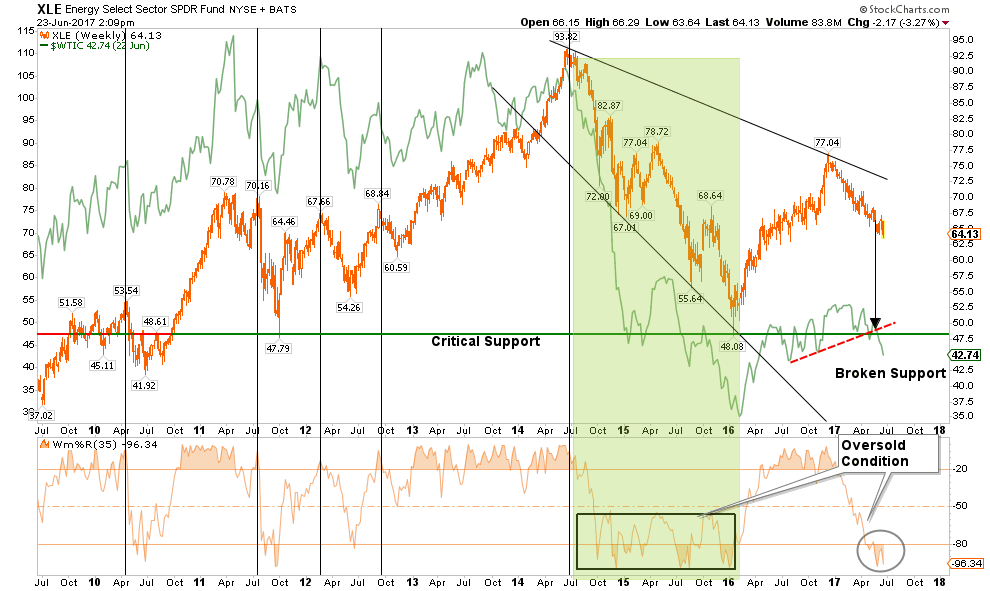
The OPEC oil cut has likely run the majority of its course and with Permian Basin production on the rise, the pressure on oil prices from supply/demand imbalances remains an issue. I discussed the headwinds to oil prices in May of this year as oil prices approached $50/bbl.
“While investors have chased energy stocks on expectations of minor production cuts from OPEC, little has been done to resolve the fundamental valuation problems which face a majority of these companies, and investors have paid the price as of late. Which is why I had suggested selling energy stocks in November of last year as noted below.”
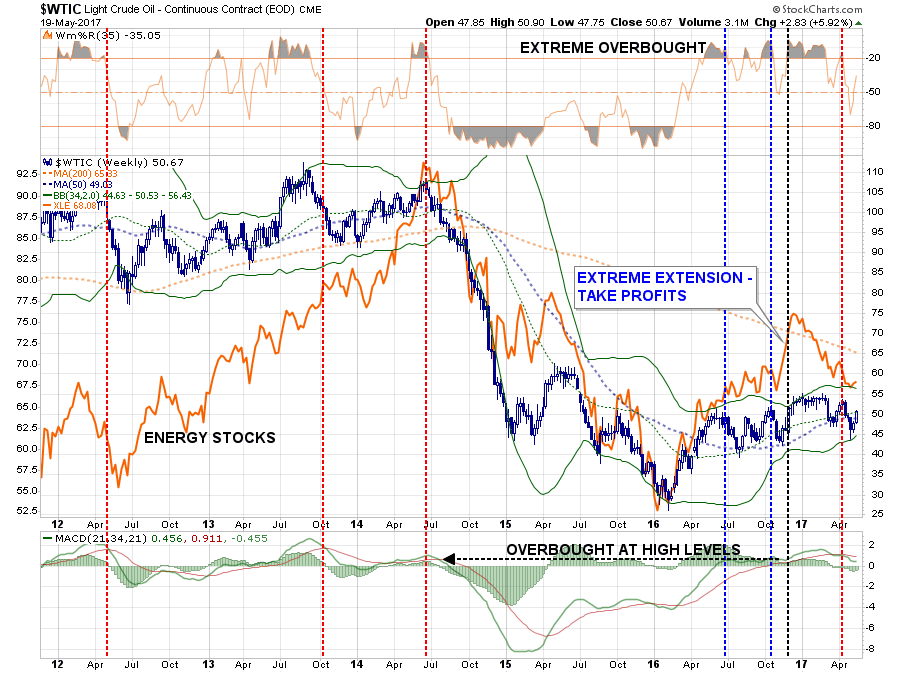
“Importantly, note the weekly ‘sell signal’ (vertical dashed red line) at very high levels currently for oil.While there is hope the production cuts will lift oil prices in the short-term, the longer-term technical backdrop suggests a bigger correction may already be in the works.
With respect to investors, the argument can be made that oil prices could remain range-bound for an extremely long period of time as witnessed in the 80’s and 90’s. It is here that lessons learned in the past will once again be re-learned with respect to the dangers of commodities, fundamentals, leverage, and greed.”
Over the last few months, I have repeatedly suggested in the sector allocation models below that energy exposure should be severely reduced or eliminated entirely. That has been profitable advice since then.
“Energy – Oil prices dropped below support at $45 on Friday and is now set up to test the lower range of $40/bbl in the weeks ahead. The supply of oil remains a problem with rig-counts rising and economic weakness setting in. With a major sector sell signal, and the cross of the 50-dma below the 200-dma, we remain out of the space for the time being. “
As I have warned, the failure of support at $48/bbl would likely see oil sliding back to the low 40’s. With oil at the lower end of the current range, there is a three-pronged attack being waged currently.
- While energy-related earnings have helped the overall S&P 500 earnings rebound over the last quarter, it is likely transient and forward earnings estimates will likely have to be ratcheted down rather sharply for the rest of the year.
- Inflationary pressures, which appeared with the rebound in oil prices last year, has led the Fed into a “comfort” zone thinking the inflation rise was due to economic growth. As suggested on Friday, this is not the case and the Fed’s plan to hike rates further make come to a frustrating conclusion.
- Economic growth also ticked up with rising commodity costs, however, that tailwind has once again reversed. Reductions in planned CapEx expenditures, drilling and operations, may weigh into the Q2 and Q3 economic outlooks as well as earnings forecasts by companies.
FactSet just supported point one with the following tweet.
$SPX EPS estimate for Q2 has declined 3.7% over past 26 weeks, 2.0% since March 31. https://t.co/m460nbR8f5 pic.twitter.com/JvrBDTo78C
— FactSet (@FactSet) June 24, 2017
Currently, the energy sector remains in a negative trend but has now reached extremely oversold levels along with oil prices. Any rally in oil prices that fails to climb above $48/bbl should be “faded” and energy exposure reduced to extreme underweight in portfolios for the time being. There will come a time for owning energy related equities, it just isn’t right now.
HEALTH CARE
Each time either Congress, or the Senate, introduces a bill to “repeal and replace” the Affordable Care Act, health care stocks get a big boost. This happened again over the last few days as the Senate introduced an “Obamacare-Lite” bill which will likely never be passed out of the Senate.
Despite all the complaints by the Republican’s over ACA, they keep passing bills which are massive tax-funded gifts to health care related providers. So, it is not surprising that health care stocks explode higher each time Congress introduces a bill which will gift them billions of dollars in tax subsidies, grants, and credits.
The recent spike has pushed the sector to 4-standard deviations overbought. Trim back current holdings to target weightings as stop-loss levels are too far away at $73.

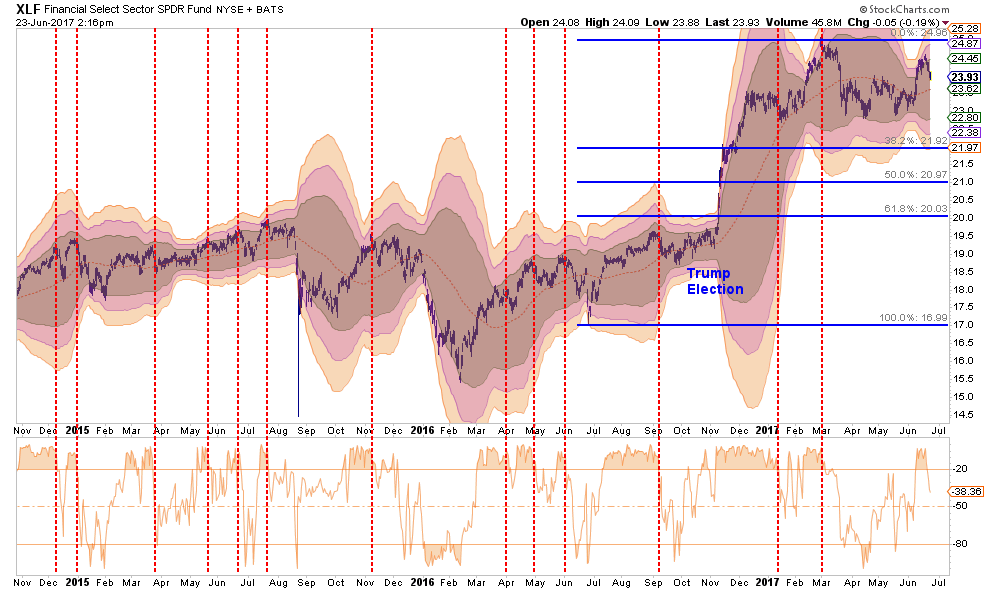
FINANCIALS
As the “Trump Trade” has faltered in recent weeks, Financials have weakened. However, the recent test of support at $23 provided a tradeable entry point with a stop at that level. The sector is currently overbought on a short-term basis, and the upside remains limited at $25/share at the moment. Keep hard stops at $23.
Risk is rising in the sector as loan delinquencies are increasing and loan demand is falling. Caution is advised.
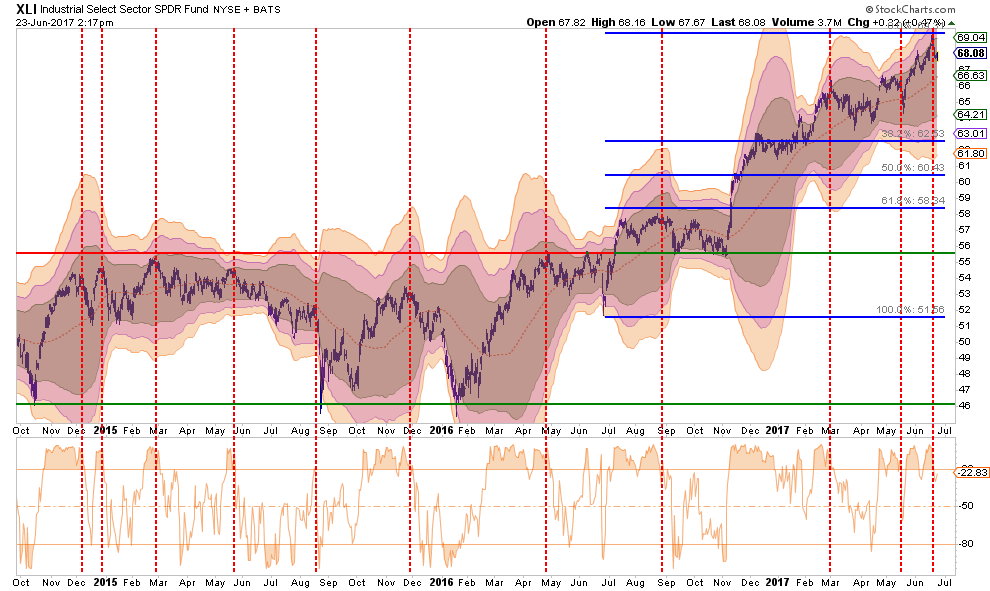
INDUSTRIALS
Industrials have continued to perform well as the “dividend chase” continues. The biggest risk to the sector comes from the inability to get legislative action moving on infrastructure and tax reform. The sector is currently overbought with little upside currently.
Take profits in the sector and reduce back to portfolio weight as reasonable stop levels are much lower at $62.
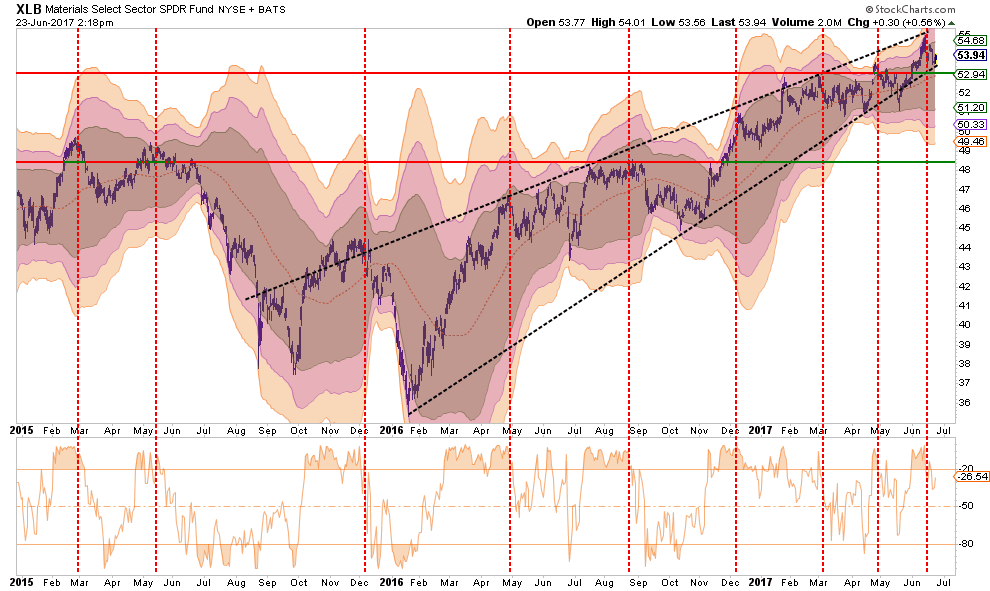
MATERIALS
As with Industrials, the same message holds for Basic Materials, which are also a beneficiary of the dividend chase. This sector should also be reduced back to portfolio weight for now with stops set at the lower support lines of $51.00.
UTILITIES
Back in January, I discussed the “rotation” trade into Utilities and Staples. That performance shift has played out nicely and the sector is now extremely overbought.
Currently, on a risk/reward basis, stops should be placed at $50 on existing positions. Look for a correction to $48.50-$49.50 for potentially adding new positions.

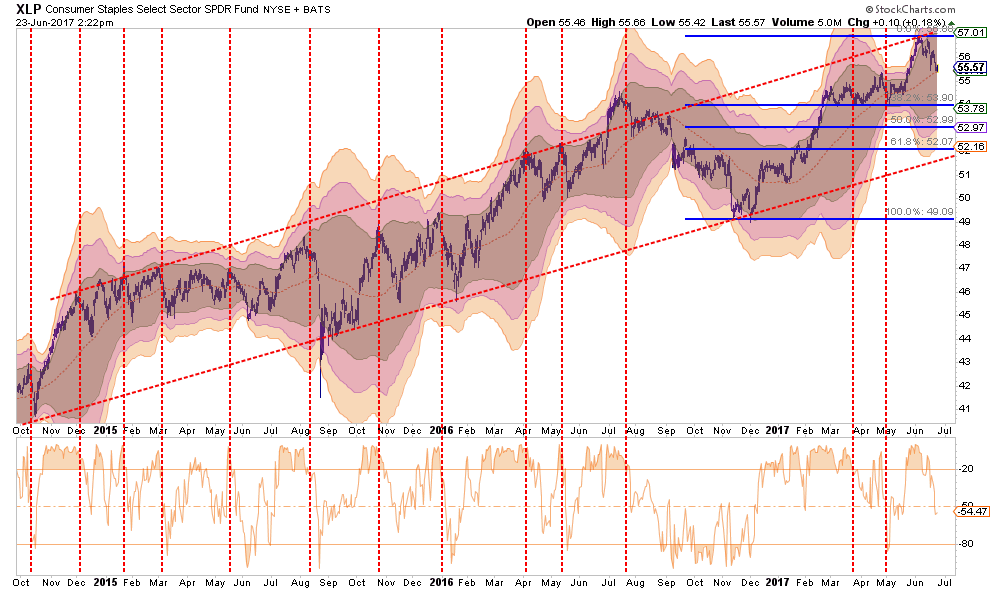
STAPLES
Staples, broke out to new highs recently with the market. With the “risk-on” and “risk off” sectors all marching higher, this has been a can’t lose market so far. As with Utilities, set stops on existing positions at $54 while rebalancing current holdings back to portfolio weights.
Look for a correction to back to support to work off the overbought condition before adding in new positions.
DISCRETIONARY
Discretionary has been running up in hopes the pick-up in consumer confidence will translate into more sales. There is little evidence of that occurring currently as retail stores are rapidly losing sales and fighting the “retail apocalypse.”. However, with discretionary stocks near recent highs, profits should be harvested.
Trim portfolio weightings should back to portfolio weight with stops set at $86. With many signs the consumer is weakening, caution is advised and stops should be closely monitored and honored.

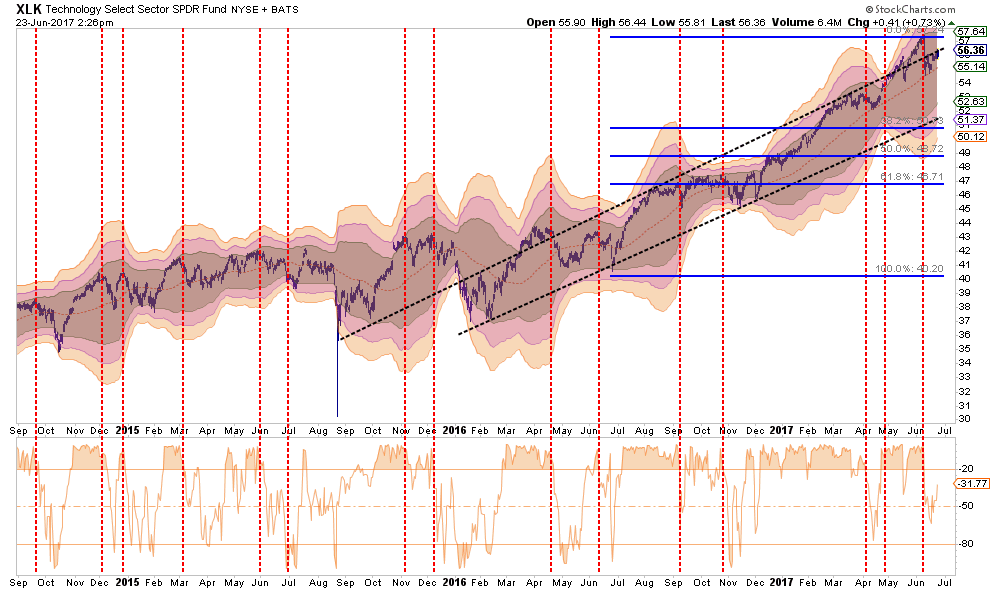
TECHNOLOGY
The Technology sector has been the “obfuscatory” sector over the past couple of months. Due to the large weightings of Apple, Google, Facebook, and Amazon, the sector kept the S&P index from turning in a worse performance than should have been expected prior to the election and are now elevating it post election. However, despite the recent correction last week which led to a frantic rotation into other“defensive” sectors, the leaders regained their mojo last week.

The sector is again extremely overbought and stops should be moved up to $55 where the recent sell-off found support at the running moving average. The bullish trendline currently intersects at $52 which could provide a reasonable entry point for additional exposure if that level holds. For now, weightings should be revised back to portfolio weight.
EMERGING MARKETS
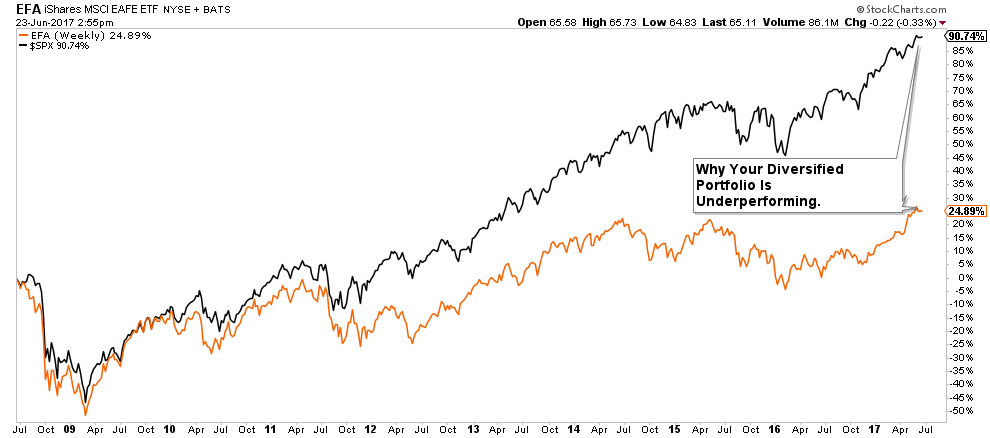
Emerging markets have had a very strong performance in recent months. However, with it now extremely overbought and global growth beginning to wane, some profit taking should be done. Furthermore, as shown below, other than tactically trading emerging markets, holding such exposure has been the equivalent of adding a “boat anchor” to portfolio performance.
As stated, with the sector overbought, the majority of the gains in the sector have likely been achieved. Profits should be harvested and the sector under-weighted in portfolios. Long-term underperformance of the sector relative to domestic stocks continues to keep emerging markets unfavored in allocation models for now.

INTERNATIONAL MARKETS
As with Emerging Markets, International sectors also remain extremely overbought and unfavored in models due to the long-term underperformance. With the international sector now trading 3-standard deviations above the long-term mean, take profits and rebalance to portfolio weightings for now.
DOMESTIC MARKETS
As stated above, the S&P 500 is extremely overbought, extended and exuberant. However, with a “sell signal” currently in place, there is a reason for some near-term caution.
Caution is advised for now.

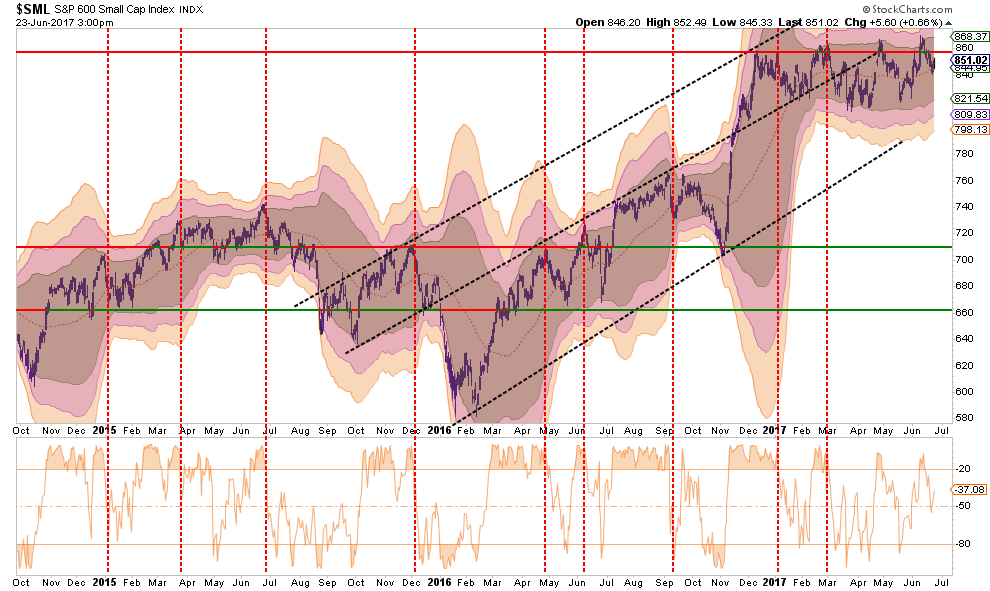
SMALL CAP
Small cap stocks went from underperforming the broader market to exploding following the Trump election. However, as of late, that performance has stalled and the sector has lagged the broader S&P 500 index.
Importantly, small capitalization stocks are THE most susceptible to weakening economic underpinnings which are being reflected in the potential for a decline in earnings expectations. This deterioration should not be dismissed as it tends to be a “canary in the coal mine.”
Currently, small caps are working off an overbought condition which suggests any advance may be somewhat limited. Stops should be placed at $820, a break of which would suggest a much deeper reversion is in process. Reduce exposure back to portfolio weight for now.
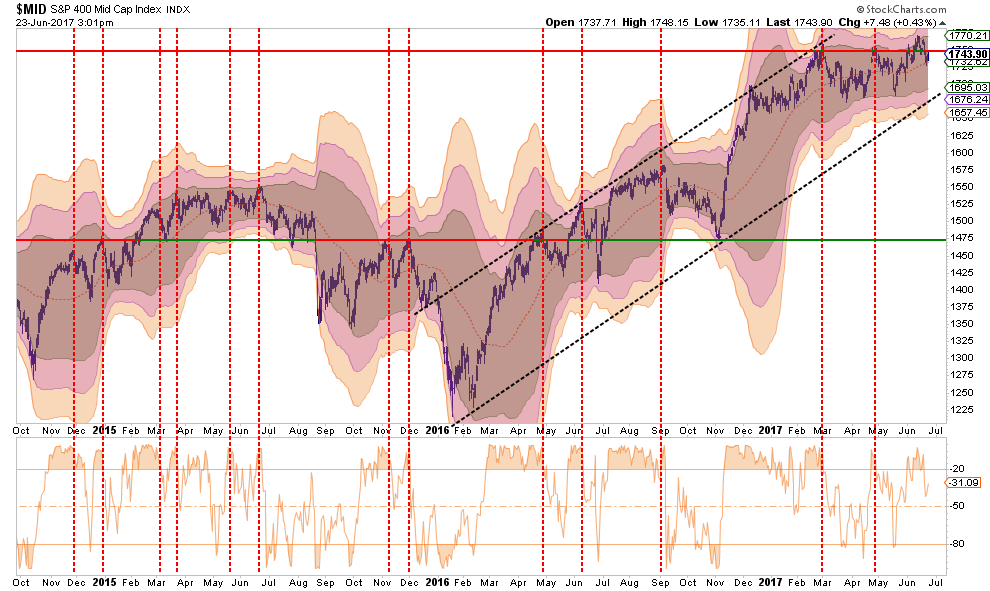
MID-CAP
As with small cap stocks above, mid-capitalization companies had a rush of exuberance following the election as well. However, Mid-caps are currently overbought and remain below resistance. With the risk/reward setup currently unfavorable, reduce exposure back to portfolio weight for now and carry a stop at $1675.
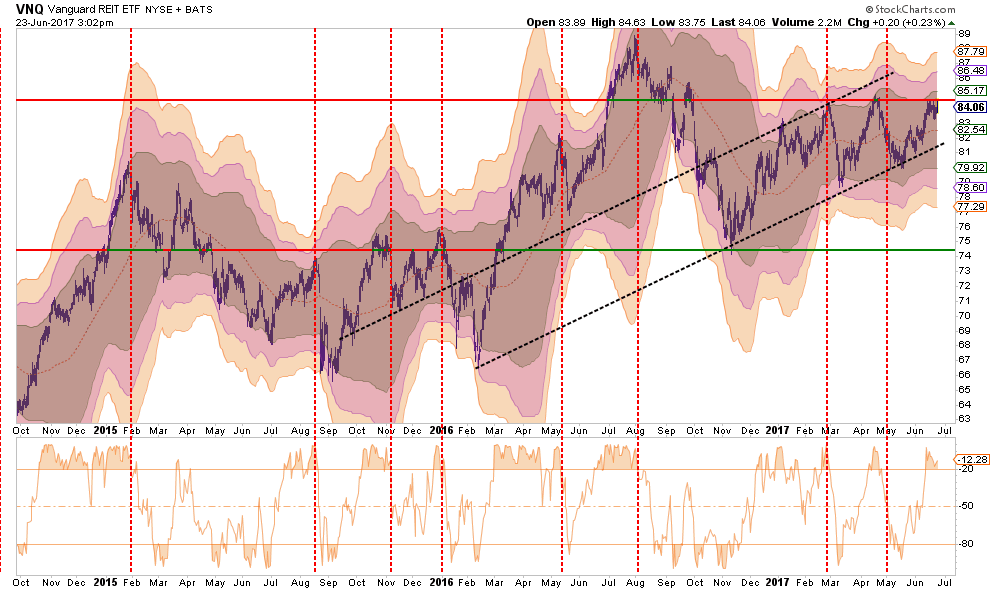
REIT’s
REIT’s have performed well despite the Fed’s ongoing rate hiking campaign. With rates now very overbought, as discussed below, take profits in REIT’s short-term and look for a pullback to trendline support around $82 to add new positions. A stop should be placed at $79.
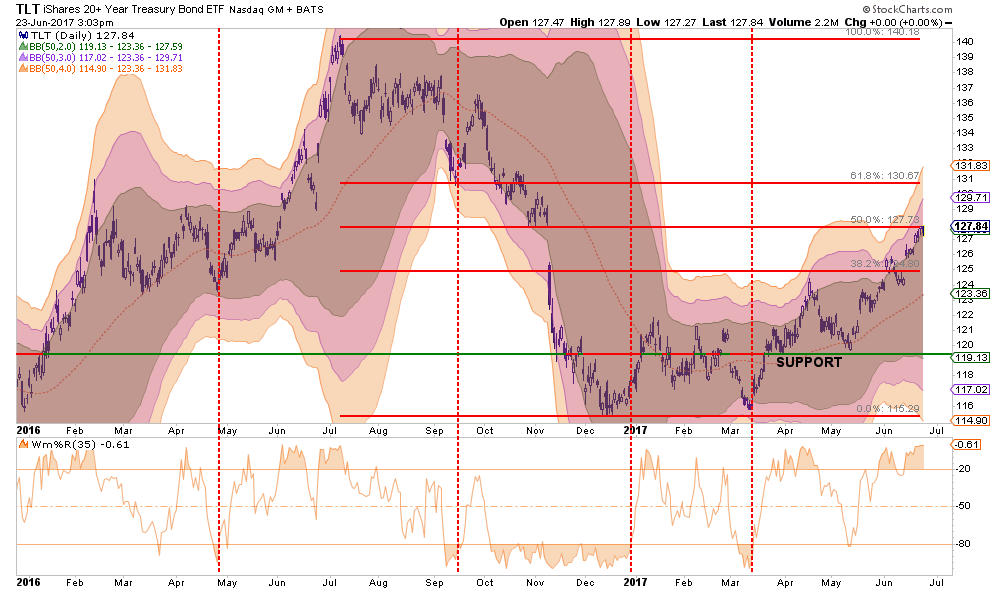
TLT – BONDS
As expected a couple of months ago, rates fell as the economic underpinnings failed to come to fruition. However, with rates now extremely oversold (inverse of bond prices) bonds are now extremely overbought. Look for a pullback to support on the index to $125 to add bond holdings back into portfolios. There is no reasonable stop currently for bond trading positions so caution is advised.
As we wrap up the month of June, we approach one of the weakest months of the year in August. July, which has historically had a modest return with about a 55% success rate, is not much better than a coin toss. Therefore, there is a decent probability the current rally could fail given the ongoing debates in Washington over the debt ceiling, tax cut, health care and infrastructure spending plans.
As noted by Nautilus Research, the markets tend to get choppy over the next couple of months.
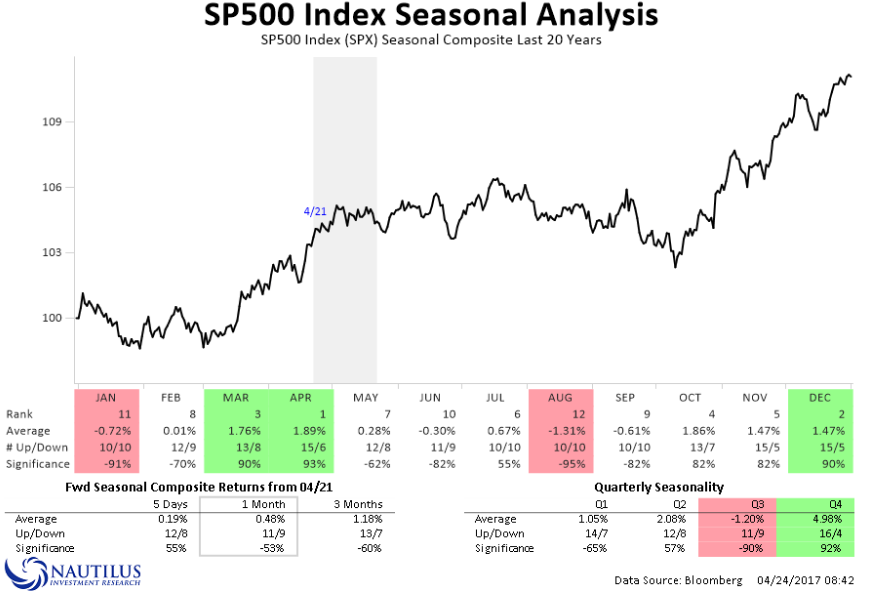
With the understanding, we are currently on short-term sell signal and overbought, the current short-term rally should likely be used for portfolio repositioning and rebalancing. However, such a statement does NOT mean “cashing out” of the market as the bull market trend remains intact. Maintain, appropriate portfolio “risk” exposure for now, but cash raised from rebalancing should remain on the sidelines until a better risk/reward opportunity presents itself.
Caution remains advised.
Market & Sector Analysis
Data Analysis Of The Market & Sectors For Traders
S&P 500 Tear Sheet
The “Tear Sheet” below is a “reference sheet” provide some historical context to markets, sectors, etc. and looking for deviations from historical extremes.
If you have any suggestions or additions you would like to see, send me an email.

Performance Analysis
New! Thank you for all the comments on the performance analysis below. Due to many of the emails I got, I have swapped out the sector weight graph for a year-to-date performance range analysis. Keep the comments coming. (Email Me)
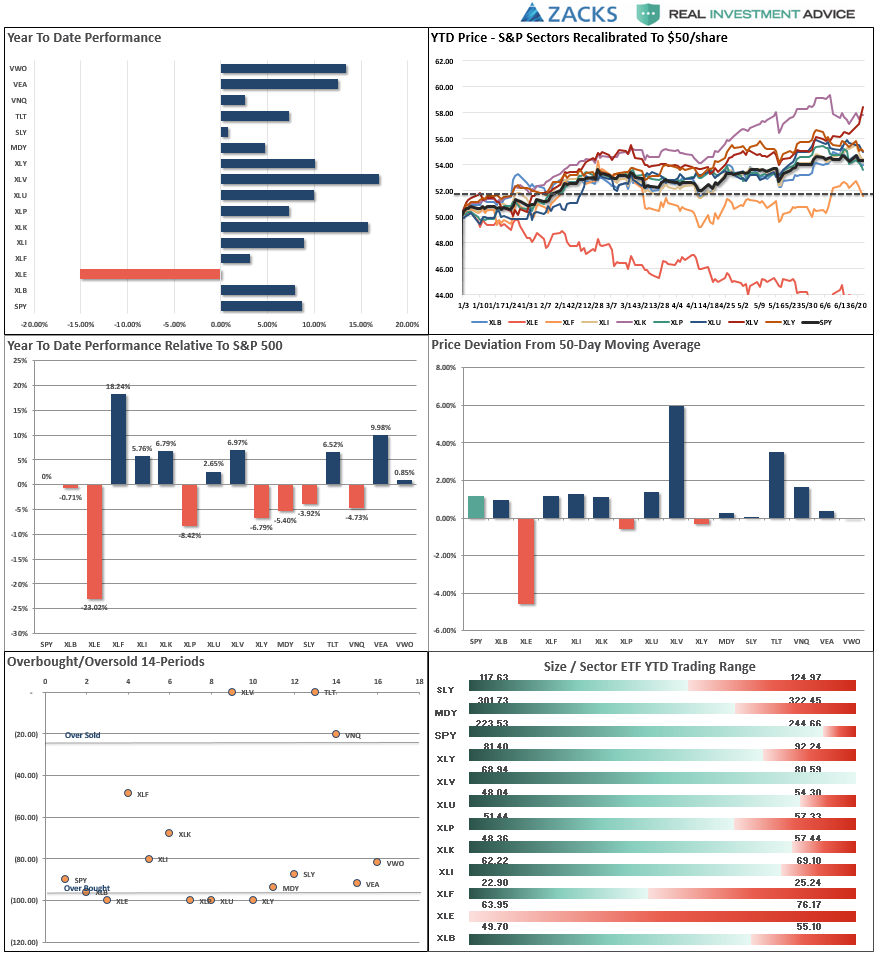
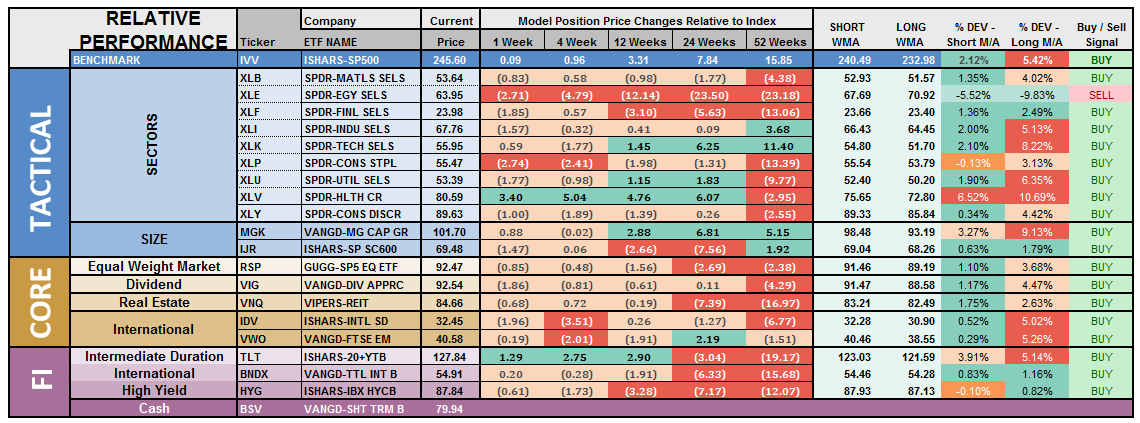
ETF Model Relative Performance Analysis
Sector Analysis
As opposed to the analysis above which drives longer-term market exposures, the following is a short-term trading perspective of sectors and markets

While Technology and Discretionary continued their recent weakness, both sectors are now testing their respective 50-dma’s. Discretionary is trying to breakdown while Technology has improved. The correction does set up a potential trading opportunity provided support holds. We will continue to monitor closely again next week.
Financials, Health Care, Materials, and Industrials maintained their lead this past week catching the money flows as investors rotated out of Tech and Discretionary. All of these sectors remain overbought so some profit-taking and rebalancing is advised. As noted last week:
Energy – Oil prices dropped below support at $45 on Friday and, and as expected, are now testing the lower range of $40/bbl. The supply of oil remains a problem with rig-counts rising and economic weakness setting in. With a major sector sell signal, and the cross of the 50-dma below the 200-dma, we remain out of the space for the time being.
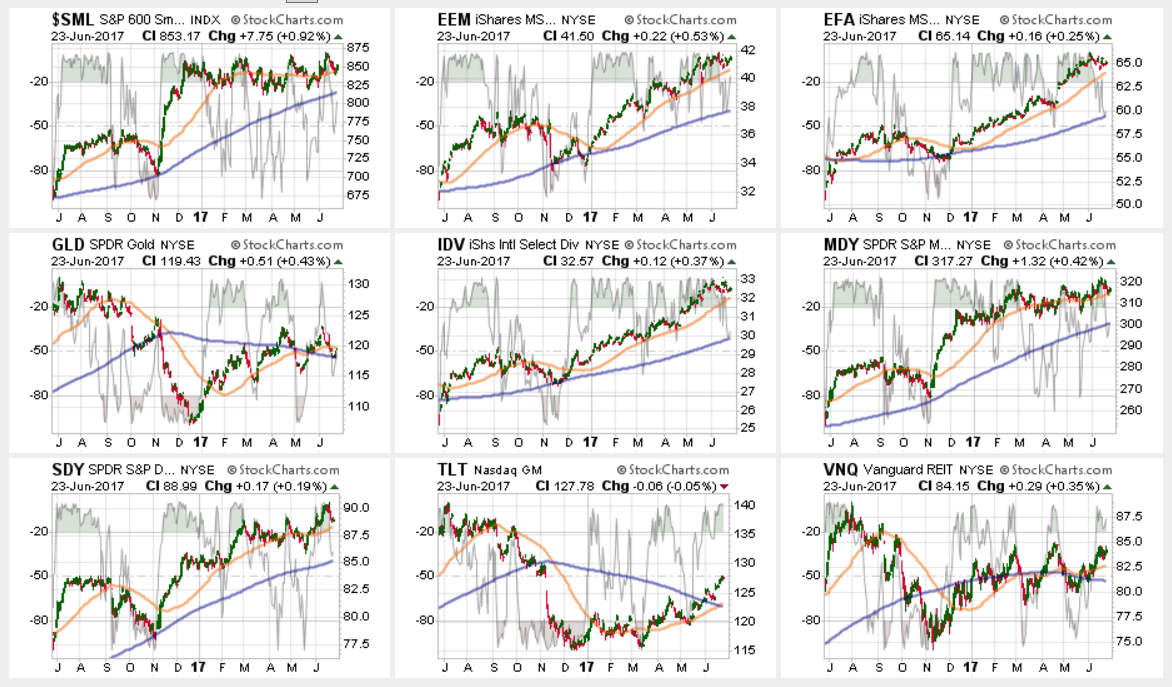
Small and Mid-Cap stocks regained their respective 50-dma’s which removes their warning signs but remained weak relative to the broader market. This keeps concern elevated at the moment, however,maintain exposure for now, but do so cautiously with stops at support.
Emerging Markets and International Stocks as noted previously:
“There is a good bit of risk built into international stocks currently. We took profits a few weeks ago, but the recent extension suggests another round of rebalancing is likely wise. Take profits and rebalance sector weights but continue to hold these sectors but stop levels should be moved up to the 50-dma.”
A pull back to support will provide an opportunity to rebalance holdings in the short-term.
Gold – The rally in Gold over the last couple of weeks once again failed at critical resistance at 1300/oz keeping us out of our long-term positions. Short-term trading positions were stopped out last week on the drop below $1260/oz for now. With Gold back below the 50-dma, caution remains advised with hard stops set on a break below $1240/oz or the 200-dma.
S&P Dividend Stocks regained key support levels last week after briefly breaking below their 50-dma. Last week, we recommended holding current positions which worked well as the rotation out of Technology and Discretionary found a home in dividend yielding stocks. Continue to hold current positions but maintain stops at the recent lows.
Bonds and REIT’s continued their advances this week breaking solidly above resistance. With the 50-dma’s moving upward, these sectors are attractive but extremely overbought. Wait for a pullback to add to exposures.
The table below shows thoughts on specific actions related to the current market environment.
(These are not recommendations or solicitations to take any action. This is for informational purposes only related to market extremes and contrarian positioning within portfolios. Use at your own risk and peril.)

Portfolio Update:
The bullish trend remains positive, which keeps us allocated on the long side of the market for now.
Last week, during the correction, we added modestly to our core holdings for a second time this year. However, we are still maintaining slightly higher levels of cash currently, and still maintain“hedges” by being in areas that are traditionally “risk off” areas of the markets (Bonds, REITs, etc.) Those areas have enhanced returns this year on a total return basis.
We are currently holding positions in portfolios with near full exposure. We are going to rebalance some positions next week, like Health Care, which have had large run-ups in recent days.
As I stated last week:
“While I am not excited about the overall risk/return makeup of the market currently, as a portfolio manager it is the discipline and strategy that drives action. Everything else is secondary.”
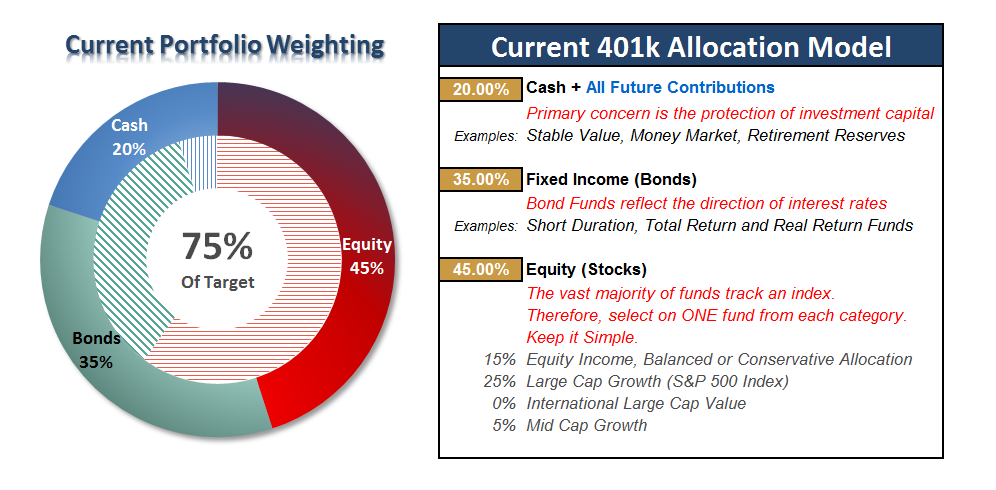
THE REAL 401k PLAN MANAGER
The Real 401k Plan Manager – A Conservative Strategy For Long-Term Investors

There are 4-steps to allocation changes based on 25% reduction increments. As noted in the chart above a 100% allocation level is equal to 60% stocks. I never advocate being 100% out of the market as it is far too difficult to reverse course when the market changes from a negative to a positive trend. Emotions keep us from taking the correct action.

The Dog Days Of Summer
As we head into the “Dog Days Of Summer” the recent volatility of the market, the lack of any movement towards legislative action, and weak internal participation, keeps us maintaining higher cash levels and rebalancing portfolio allocations.
Ideally, we would like to see a firming of the market environment and a reversal of the short-term “sell signal”currently registered to become more confident about increasing equity risk. The somewhat “mad dash”‘ into everything over the last couple of weeks remains worrisome.
Last week, the turmoil in the markets kept the initial warning signal and “sell” signal intact which keeps portfolios a little more heavily weighted in cash. We will watch developments closely as we head into next week to see if the recent market weakness can shore itself up.
As opposed to our portfolio model allocations, where we have more flexibility in movement, we look for opportunities to adjust risk exposure with a view of a 90-day holding period. (This is due to 401k trading restrictions. If we cannot get comfortable with a 90-day outlook, we will remain on hold.)
Refrain from adding further fixed income holdings, for now, take some profits from overweight holdings, but maintain exposures.
If you need help after reading the alert; don’t hesitate to contact me.
Current 401-k Allocation Model
The 401k plan allocation plan below follows the K.I.S.S. principal. By keeping the allocation extremely simplified it allows for better control of the allocation and a closer tracking to the benchmark objective over time. (If you want to make it more complicated you can, however, statistics show that simply adding more funds does not increase performance to any great degree.)
401k Choice Matching List
The list below shows sample 401k plan funds for each major category. In reality, the majority of funds all track their indices fairly closely. Therefore, if you don’t see your exact fund listed, look for a fund that is similar in nature.

Disclosure: The information contained in this article should not be construed as financial or investment advice on any subject matter. Streettalk Advisors, LLC expressly disclaims all liability in ...
more


Thanks sir