
Another Update On Interest Rates And Yield Curves
Reference previous posts on this most important of subjects, here and here.
Why another Bond Yield post? Because macro economically speaking the trend in bond yields will be at the very heart of everything else we will do as investors or traders going forward. You can be the best stock picker in the world, but if you’ve got the macro wrong you’re gonna get killed. Conversely, get it right and…
Global bond yields remained firm at yesterday’s close.
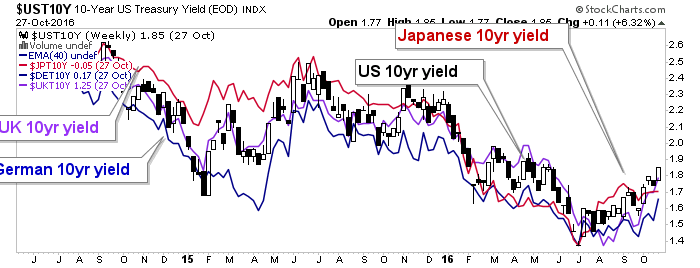
And today’s activity is doing nothing to reverse the above. UK Gilt and Euro Bund are actually up in yield. The view below shows the bond price. There is an oddity in that this quote is showing the 10yr Note up (implying its yield is down), but a quick look at a TNX chart shows the yield is firm. Courtesy of investing.com…

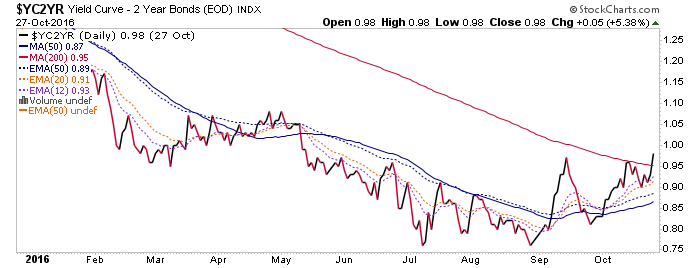
As for the 2yr being in the red, well that only serves to keep the yield curve firm after it closed above its SMA 200 yesterday and made a higher high.
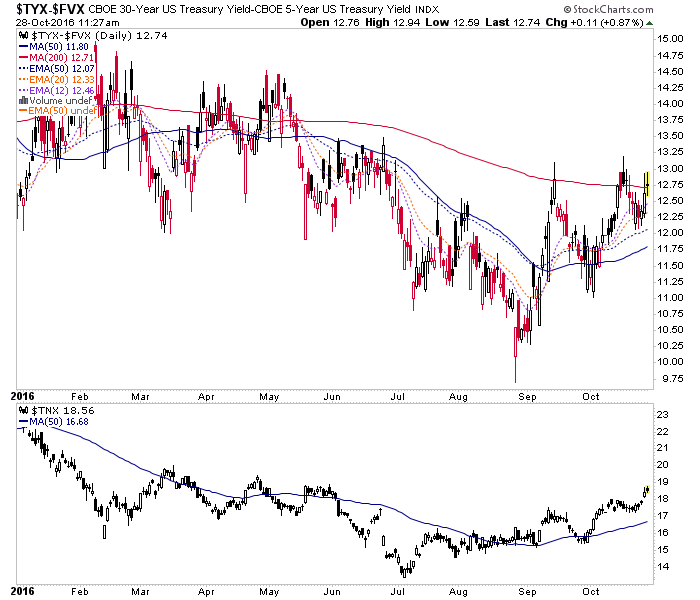
Here’s the 30yr-5yr with the nominal 10yr, for reference.
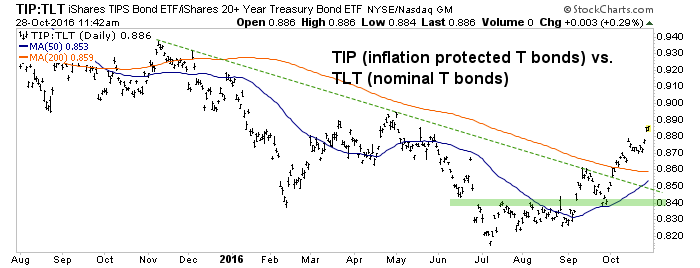
What’s more, inflation-protected TIP is declining less than TLT with the implication that as bond yields rise so are inflation expectations.
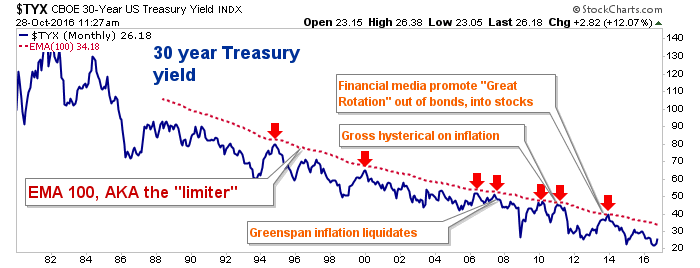
And finally, dialing out to the big picture ‘Continuum’, if we experience an ‘inflation trade’ off of what is happening in bonds, the Limiter (AKA the monthly EMA 100, currently at a 3.4% yield) will be looked at once again to halt the proceedings, probably right around the time bond gurus are in full frontal “INFLATION!!!” hysterics mode (ref. Gross circa spring 2011).
Disclosure: Subscribe to more


