
Bitcoin Et Al – Look Out Below!
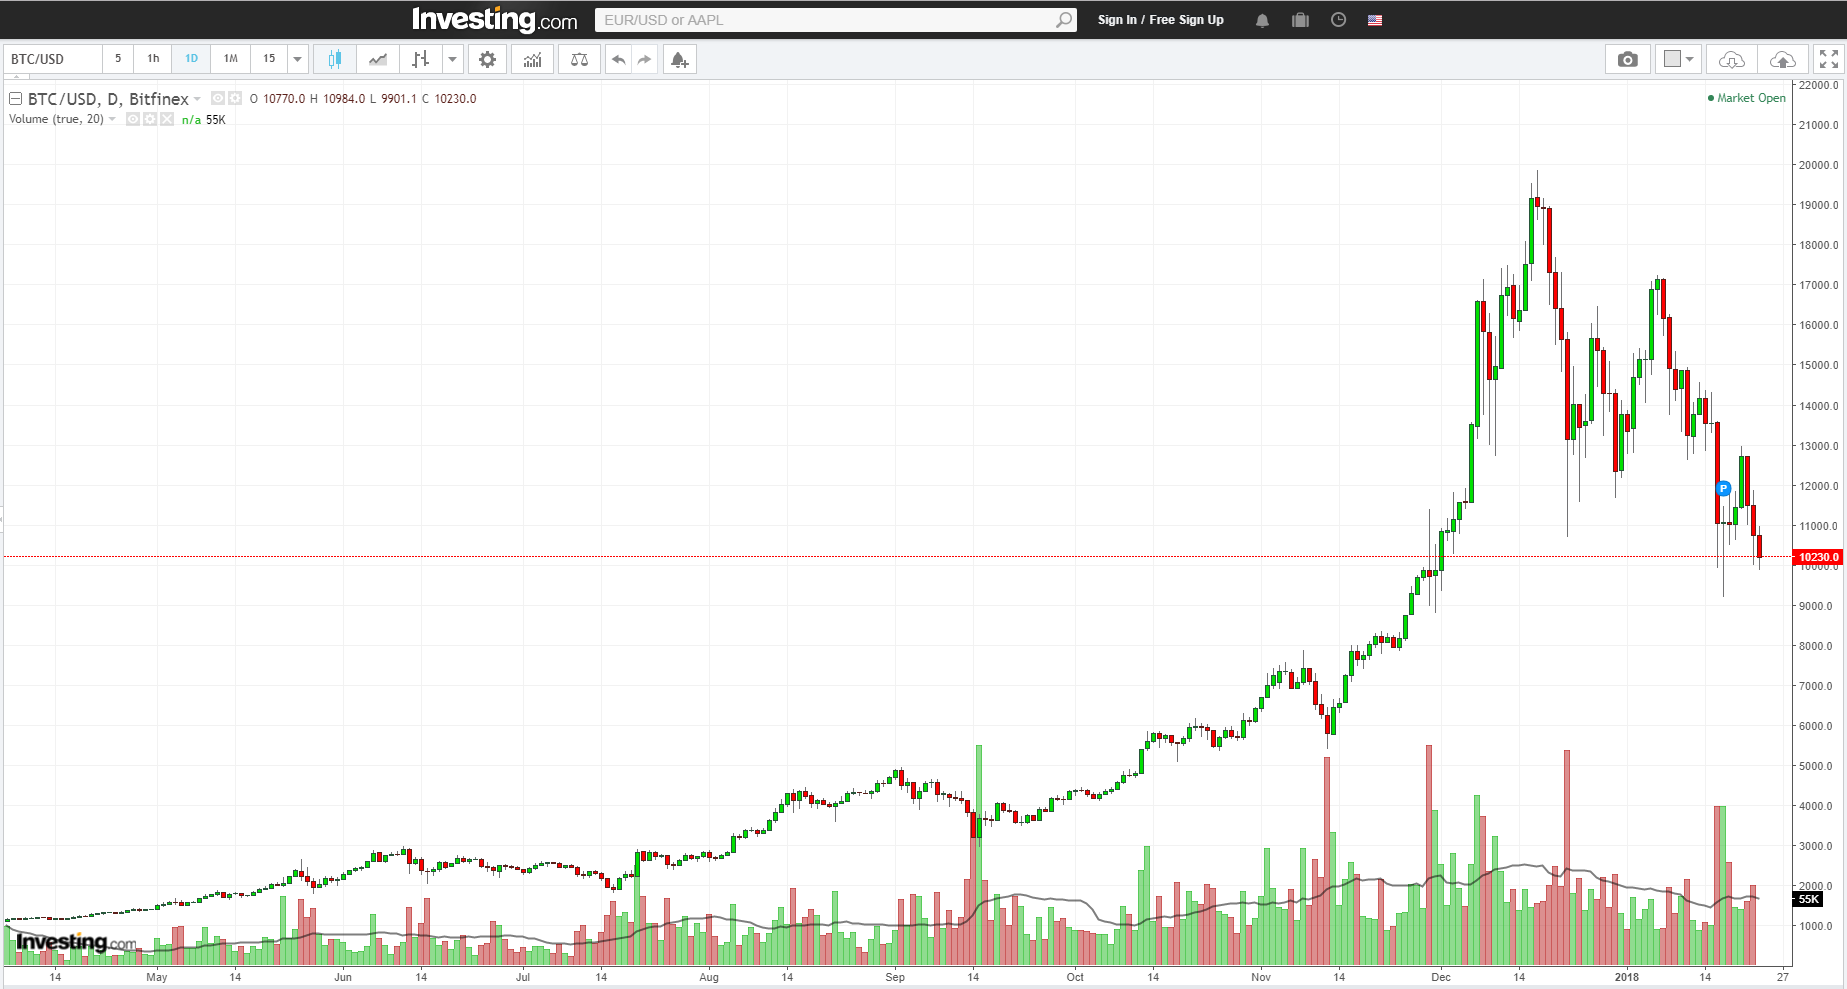
If it wasn’t clear already, the next few days for Bitcoin investors is likely to be traumatic and seminal as the daily chart for the cryptocurrency continues to develop technical, analytical and structural cracks which are likely to see this market fall, and fall heavily once the support region at $10,000 is taken out. This has been building for some time, and despite the influx of buyers in the last week, these have been in insufficient numbers to halt the heavy selling, and in a supply and demand driven market, a lack of buyers can only lead to one thing. A move lower, which is what we are seeing now, with Bitcoin creating a classical pattern of lower highs and lower lows.
Once the price moves through the psychological five figures and down to four, the next question is where, and at what level buyers will return to halt the fall, and from a technical perspective the first pause point is likely around the $7,300 region. But once this is breached, $4,700 then comes into view, and below this $3,000. From here in the longer term, a return to single figures is likely as sanity and common sense returns. This is not to say the blockchain technology is not here to stay, it most certainly is and in many different fields, but what is currently lacking in this market is trust, and until trust is assured, and the authorities have defined the regulatory parameters, buyers will remain on the sidelines, frightened and traumatised by the wild ride, with the main beneficiaries being the IPO’s and the pick and shovel merchants.
Disclaimer: Futures, stocks, and spot currency trading have large potential rewards, but also large potential risk. You must be aware of the risks and be willing to accept them in order to invest in ...
more

