
2018 Total Returns Getting Uglier
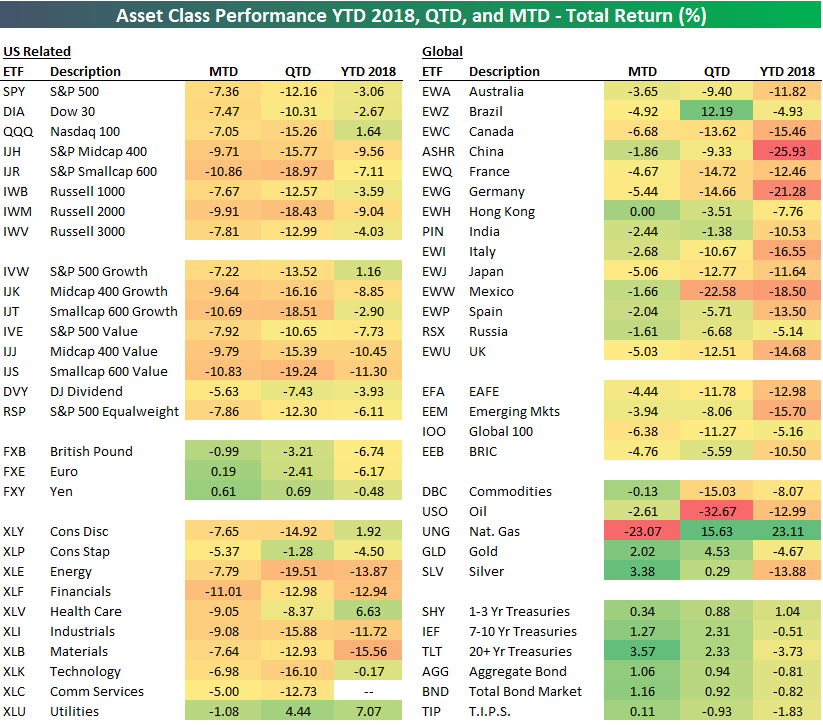
After another 2%+ decline for US equity markets yesterday, the total return picture across the equity asset space is getting uglier and uglier. Below is a snapshot of our key ETF matrix that highlights total returns across asset classes on a month-to-date, quarter-to-date, and year-to-date basis.
Month-to-date, every major US index ETF is down more than 7%, with small-caps down 10%. Quarter-to-date, the S&P 500 (SPY) is down 12%, while it’s down 3% year-to-date. The small-cap Russell 2,000 (IWM) is down a whopping 18.4% quarter-to-date, and it’s down 9% year-to-date.
Looking at US sectors, Financials (XLF) is down 11% already in December alone, leaving the sector down 13% both quarter-to-date and year-to-date. Every other sector except Utilities (XLU) is down 5% or more in December. While international equity markets are underperforming US equities quite dramatically on a year-to-date basis, you’ll notice that many areas of the world are handily outperforming the US in December. The emerging markets ETF (EEM) is down about half the amount that SPY is down month-to-date.
Commodities — outside of natural gas — have been holding up better than equities in December as well. The broad commodities ETF (DBC) is down just 13 bps this month, while gold (GLD) and silver (SLV) are both in the green. Treasuries have also caught a bid as equities have gotten pummeled. The 20+ year Treasury ETF (TLT) is up 3.57% already in December, and it’s up 2.33% quarter-to-date.
(Click on image to enlarge)
Disclaimer: To begin receiving both our technical and fundamental analysis of the natural gas market on a daily basis, and view our various models breaking down weather by natural gas demand ...
more

