
Why Invest In Low Dividend Yield Stocks?
Image Source: Pixabay
As a Dividend Growth Investor, I almost exclusively invest in dividend growth stocks with dividend increase streaks of five years or more. Dividend Radar is a free, weekly auto-generated spreadsheet of such stocks.
I believe in a healthy mix of higher-yielding (HiY) stocks and stocks with higher dividend growth rates (HiG stocks) as measured by the 5-year dividend compound annual growth rate, or 5-year DGR for short.
In the past few years, my DivGro portfolio's balance of HiY and HiG positions has shifted towards HiY stocks. To restore a healthier mix of HiY and HiG stocks, I recently closed several HiY positions and increased my investments in HiG stocks with lower yields. As a result, my annual dividend income decreased significantly, but I believe my total return prospects have vastly improved.
HiG stocks with a long track record of double-digit percentage increases often have very low yields. One example is Mastercard (MA), which has increased its dividend by at least 10% every year for the last ten years:
(Click on image to enlarge)
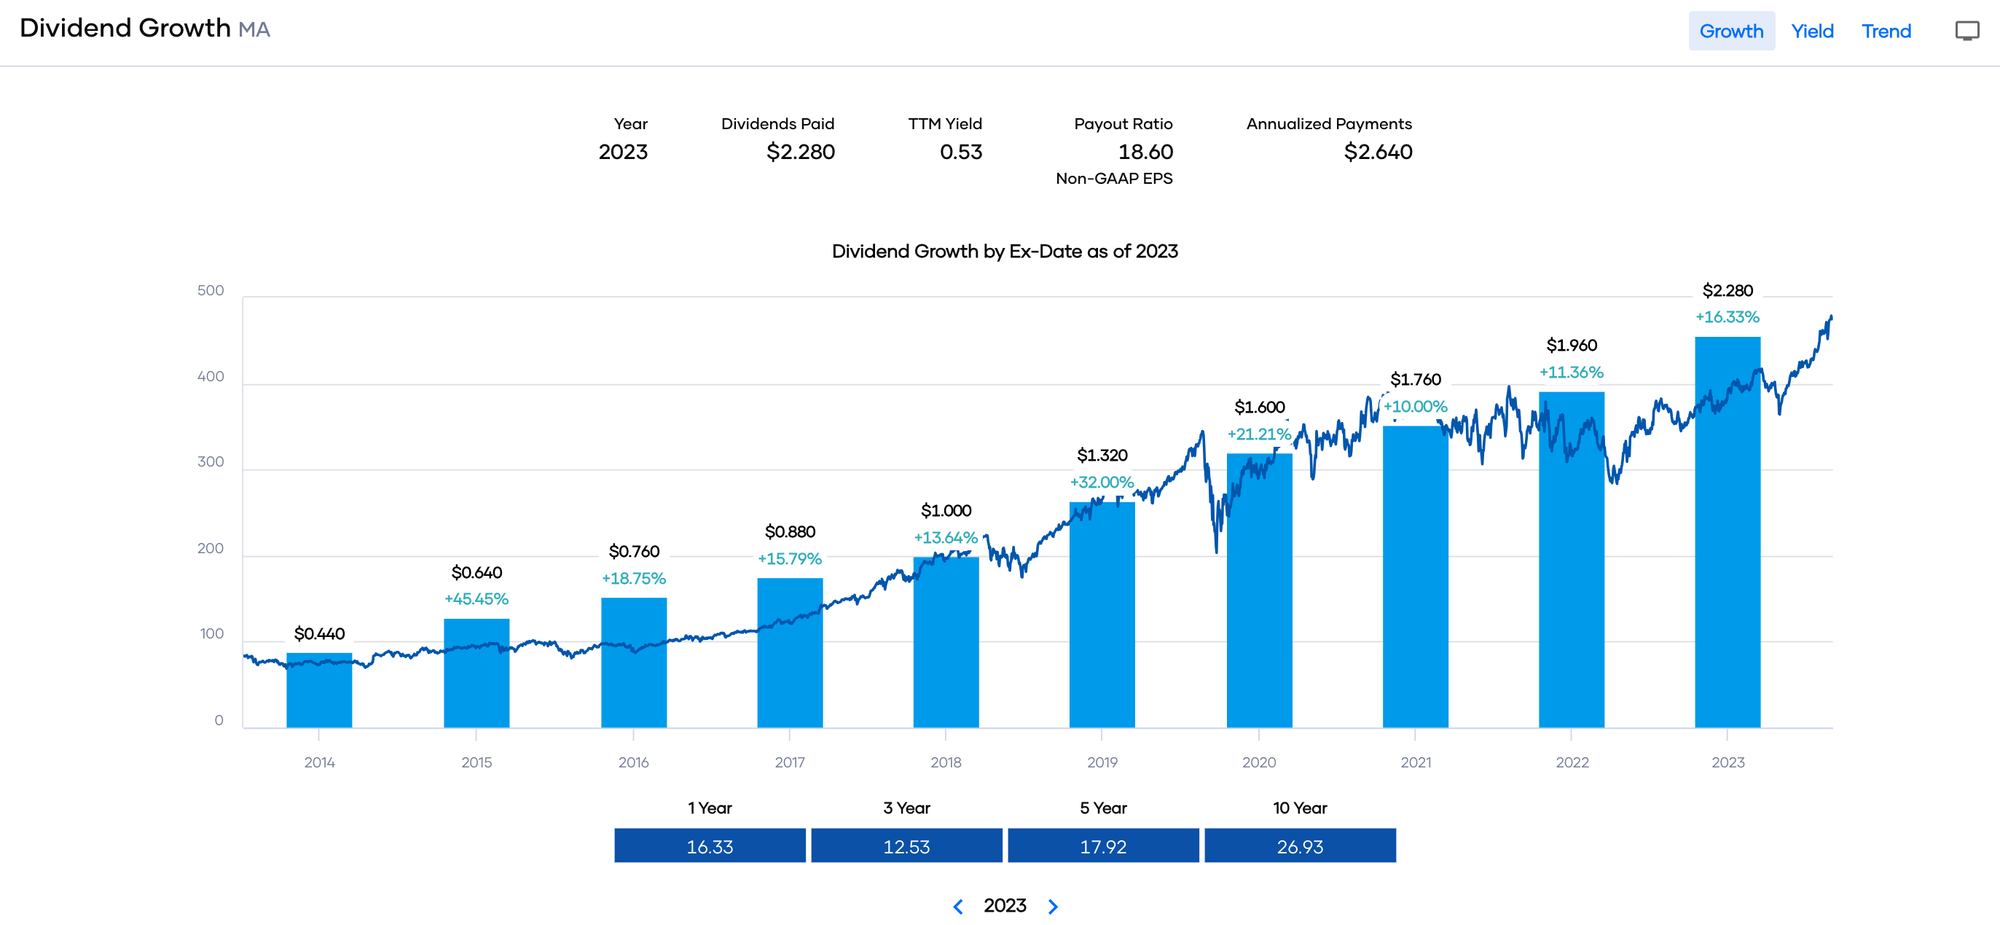
Source: Portfolio Insight
MA's yield stays low despite growing its dividend quickly because its share price grows just as quickly! A stock's dividend yield is the ratio of its dividend per share to the share price:
Yield = Dividend / Price
The yield won't change much if the dividend and price increase at about the same rate. That's what happens with HiG stocks like MA. The price increases about as fast as the dividend does, so the yield doesn't change much over time.
Following is a 10-year history of MA's dividend payouts and some growth rate calculations:
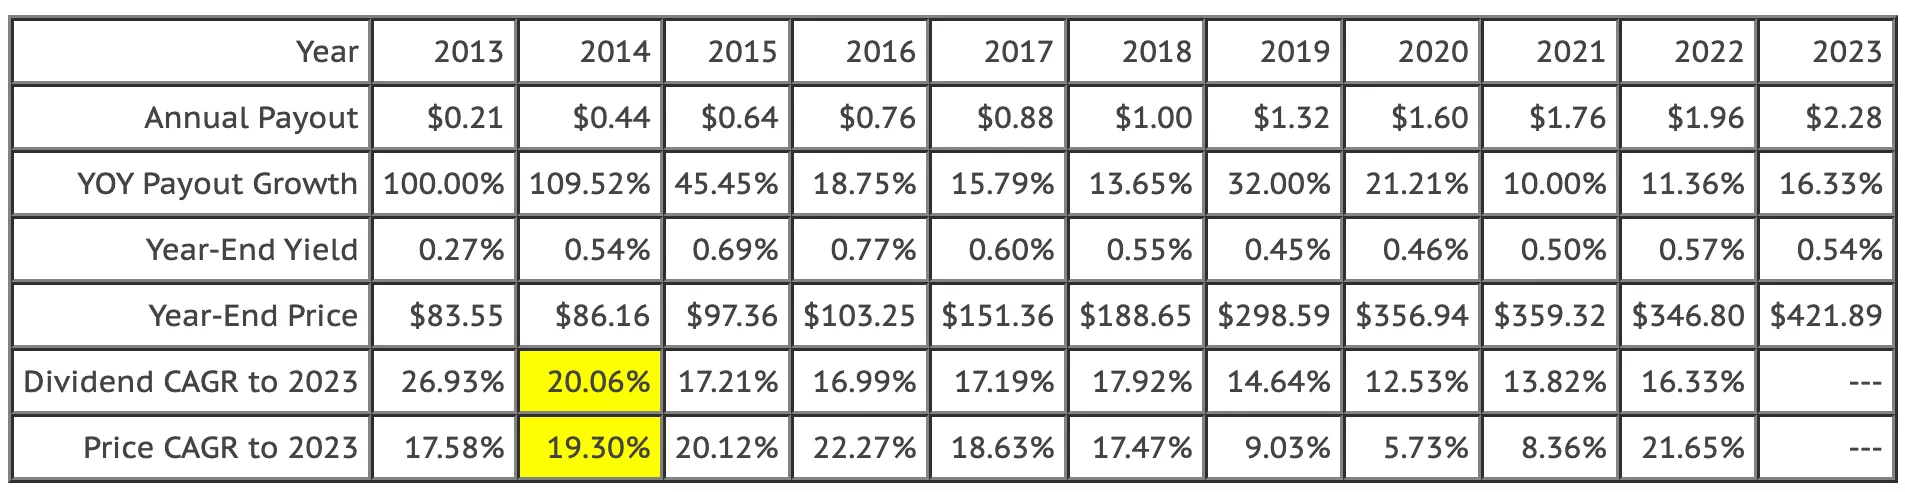
I highlighted two compound annual growth rates [CAGR] in the table. From 2014 through 2023, MA's dividend increased at a rate of 20.06% and its price at a rate of 19.30%. That's about the same rate of growth over a period of nine years!
Sometimes the price grows faster than the dividend, and sometimes slower than the dividend. But overall, the growth rates are similar, and MA's yield stays very low as a result.
In the last five years, MA's yield remained in a band between 0.44% and 0.69%, except when the market tanked on fears about the rapidly spreading COVID-19 virus. At that time, MA's yield ballooned to about 0.79%:
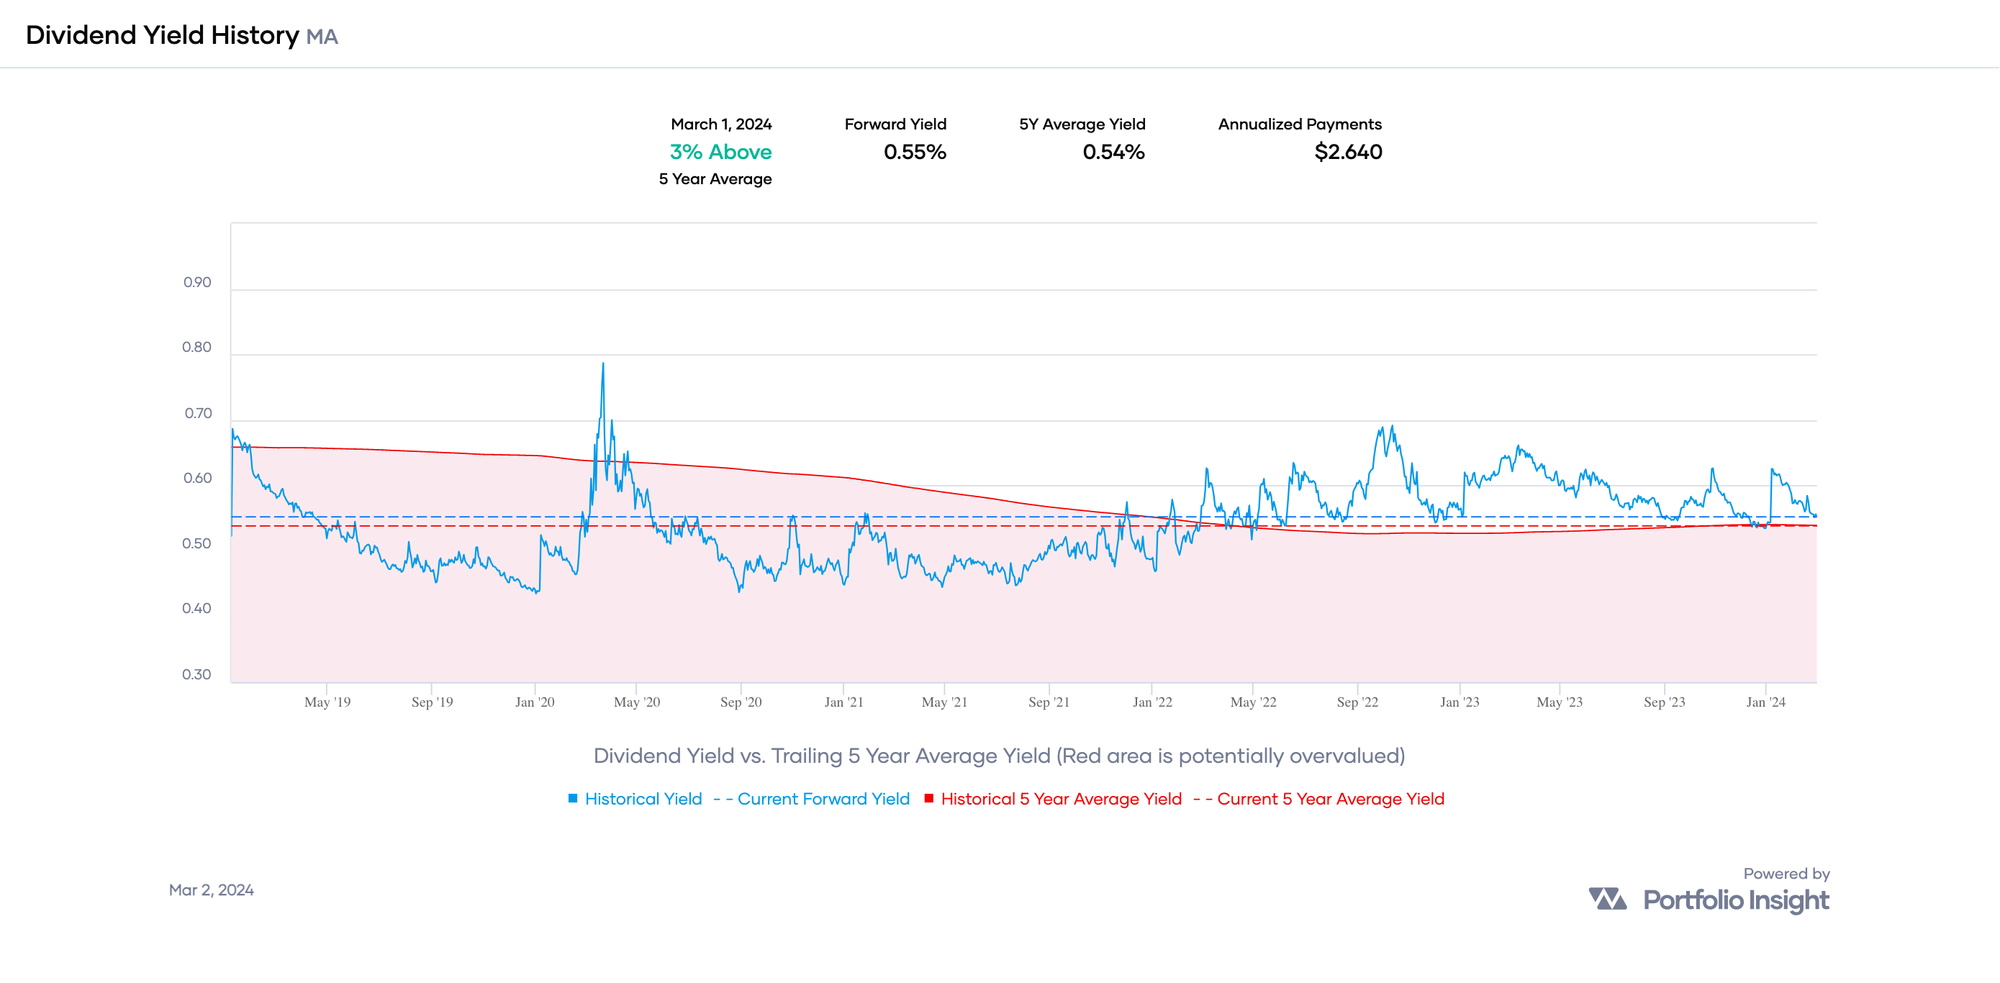
Source: Portfolio Insight
Comparing the current forward yield to the trailing 5-year average yield is one way to tell if a stock is potentially undervalued or overvalued. MA's current forward yield is 0.55%, and its 5-year average yield is 0.54%. So, MA is slightly undervalued relative to historical yield patterns.
Calculating Current Forward Yield
In December 2023, MA declared a quarterly dividend of 66¢ per share, a 15.79% increase over the previous dividend of 57¢ per share. MA closed at $476.63 per share on 1 March 2024, so its current forward yield is:
Yield = Dividend / Price
Yield = 4⨉$0.66 / $476.63
Yield = $2.64 / $476.63
Yield = 0.55%
Many dividend growth investors have stock selection criteria that include a minimum acceptable yield. I made a similar mistake when I formulated DivGro's original stock selection criteria in January 2013:
At least I recognized that yields above 7% are likely unsustainable!
A decade of learning has made me realize that a stock's dividend yield is not as important as its total return prospects, which in turn is determined more by dividend growth than by dividend yield.
To see the impact of annual dividend increases exceeding 10%, consider an investment of $10,000 in MA on 31 December 2013. At the end of 2023, your investment would be worth $54,277 with reinvested dividends and $52,561 without reinvested dividends.

Source: Drip Investing
MA easily outperformed SPY, an exchange-traded fund that tracks the performance of the S&P 500 Index. MA outperformed SPY by a ratio of 1.76:1 with reinvested dividends and by a ratio of 1.84:1 without reinvested dividends.
In contrast, a HiY stock like Main Street Capital (MAIN) would be worth $28,677 with reinvested dividends and $21,770 without reinvested dividends. MAIN underperformed SPY by a ratio of 0.93:1 with reinvested dividends and by a ratio of 0.76:1 without reinvested dividends.
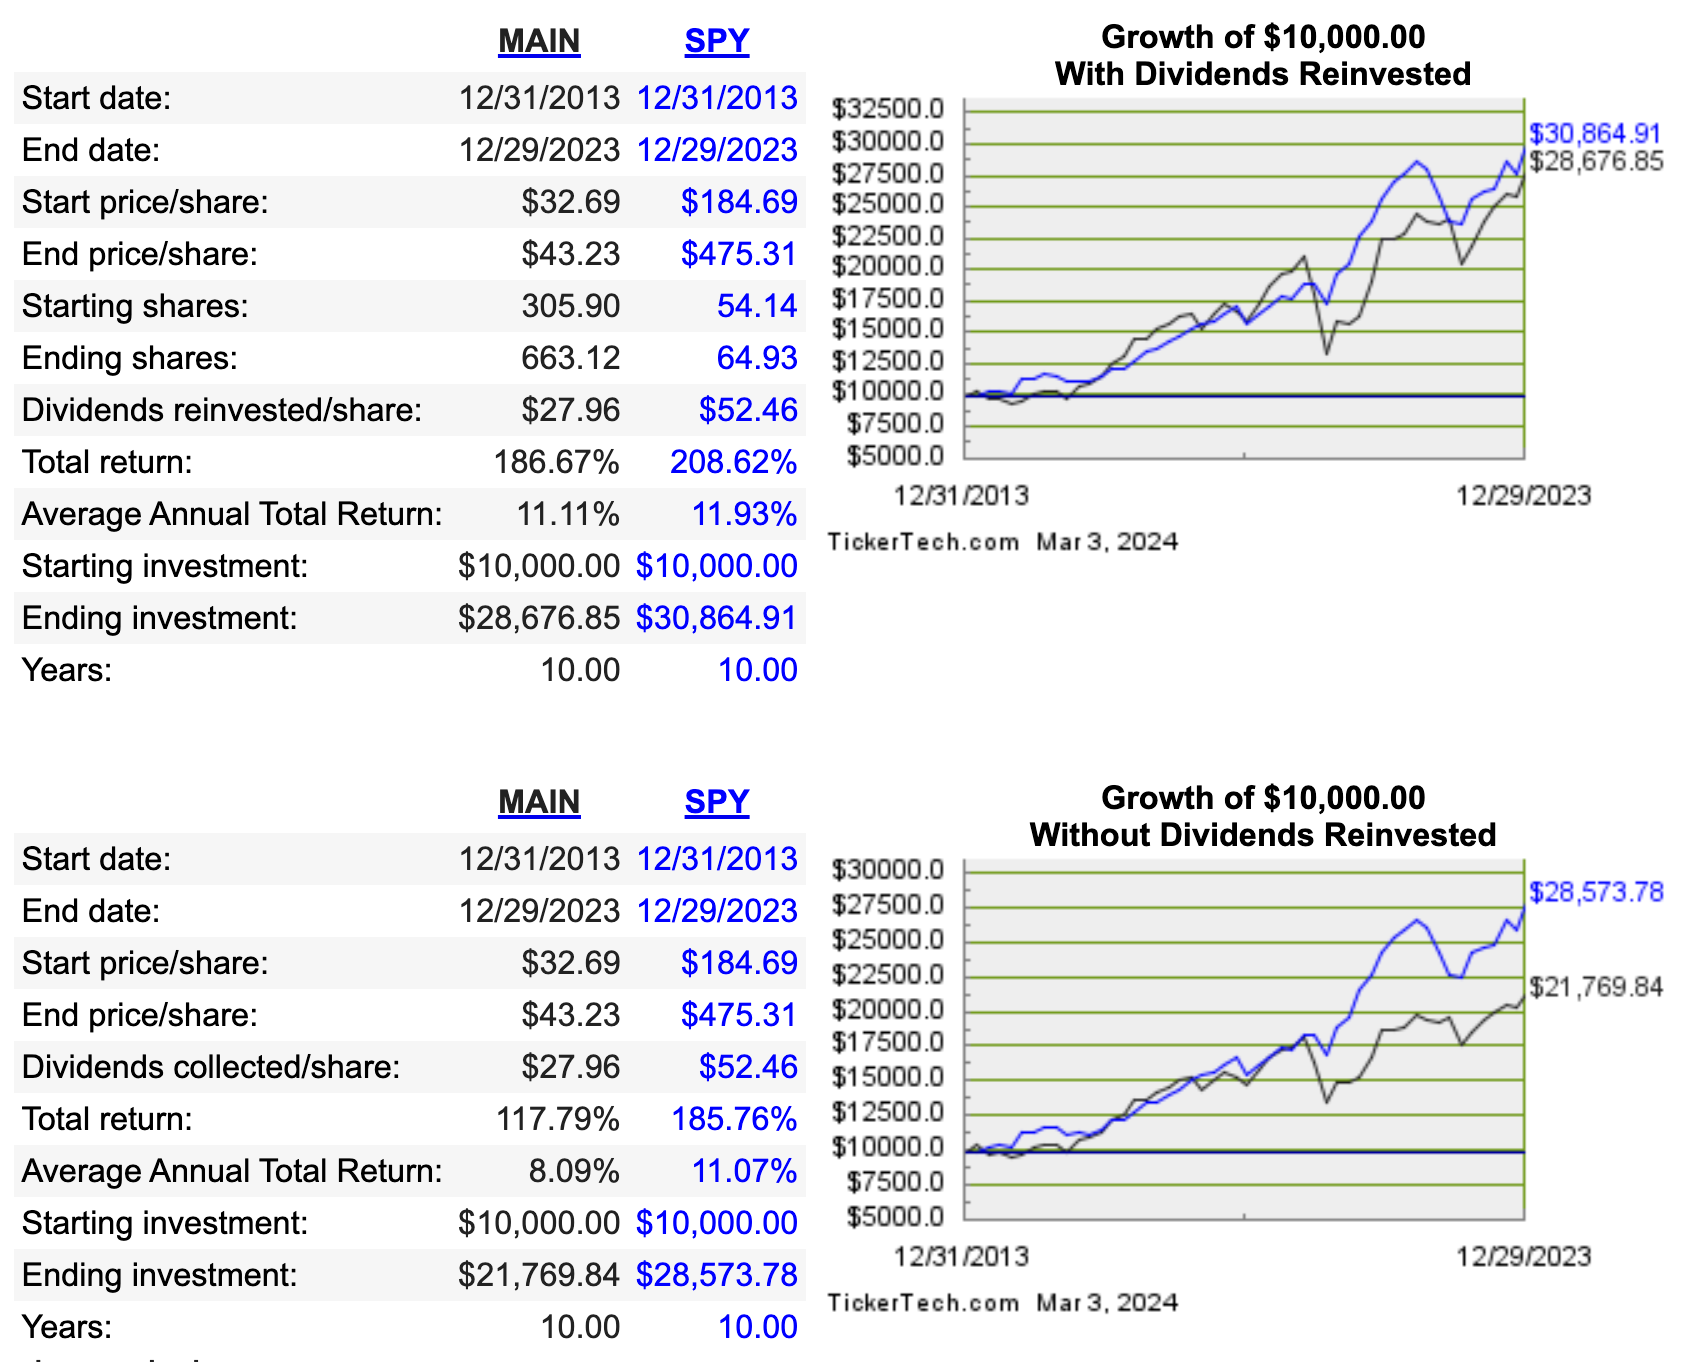
According to Portfolio Insight, MAIN currently yields 6.34% at $45.44 per share and has a 5-year DGR of only 3.60%.
Of course, showing just one example of each of HiG and HiY doesn't prove much.
So I created two portfolios of 10 high-quality stocks, QualityYIELD and QualityGROWTH, each using Portfolio Insight's screener. Here are the specific screens:
QualityYIELD
- Dividend Radar stocks
- Dividend Streak ≥ 12 years
- Dividend Quality Grade A or A+
- Annualized Dividend Yield ≥ 4.1%
- Dividend 3-year CAGR < 10
QualityGROWTH
- Dividend Radar stocks
- Dividend Streak ≥ 12 years
- Dividend Quality Grade A or A+
- Dividend 10-year CAGR ≥ 15
- Dividend 5-year CAGR ≥ 15
- Dividend 3-year CAGR ≥ 15
The QualityYIELD screens produce 11 stocks, but both tickers of John Wiley & Sons (WLY and WLYB) appear in the list, so I removed WLYB to limit the list to 10 stocks.
Portfolio Insight's Dividend Quality Grade determines which companies will likely increase their dividend during the next 12 months and which companies risk freezing or cutting their dividend. Companies with A+ or A dividend quality grades will likely increase their dividends in the next 12 months.
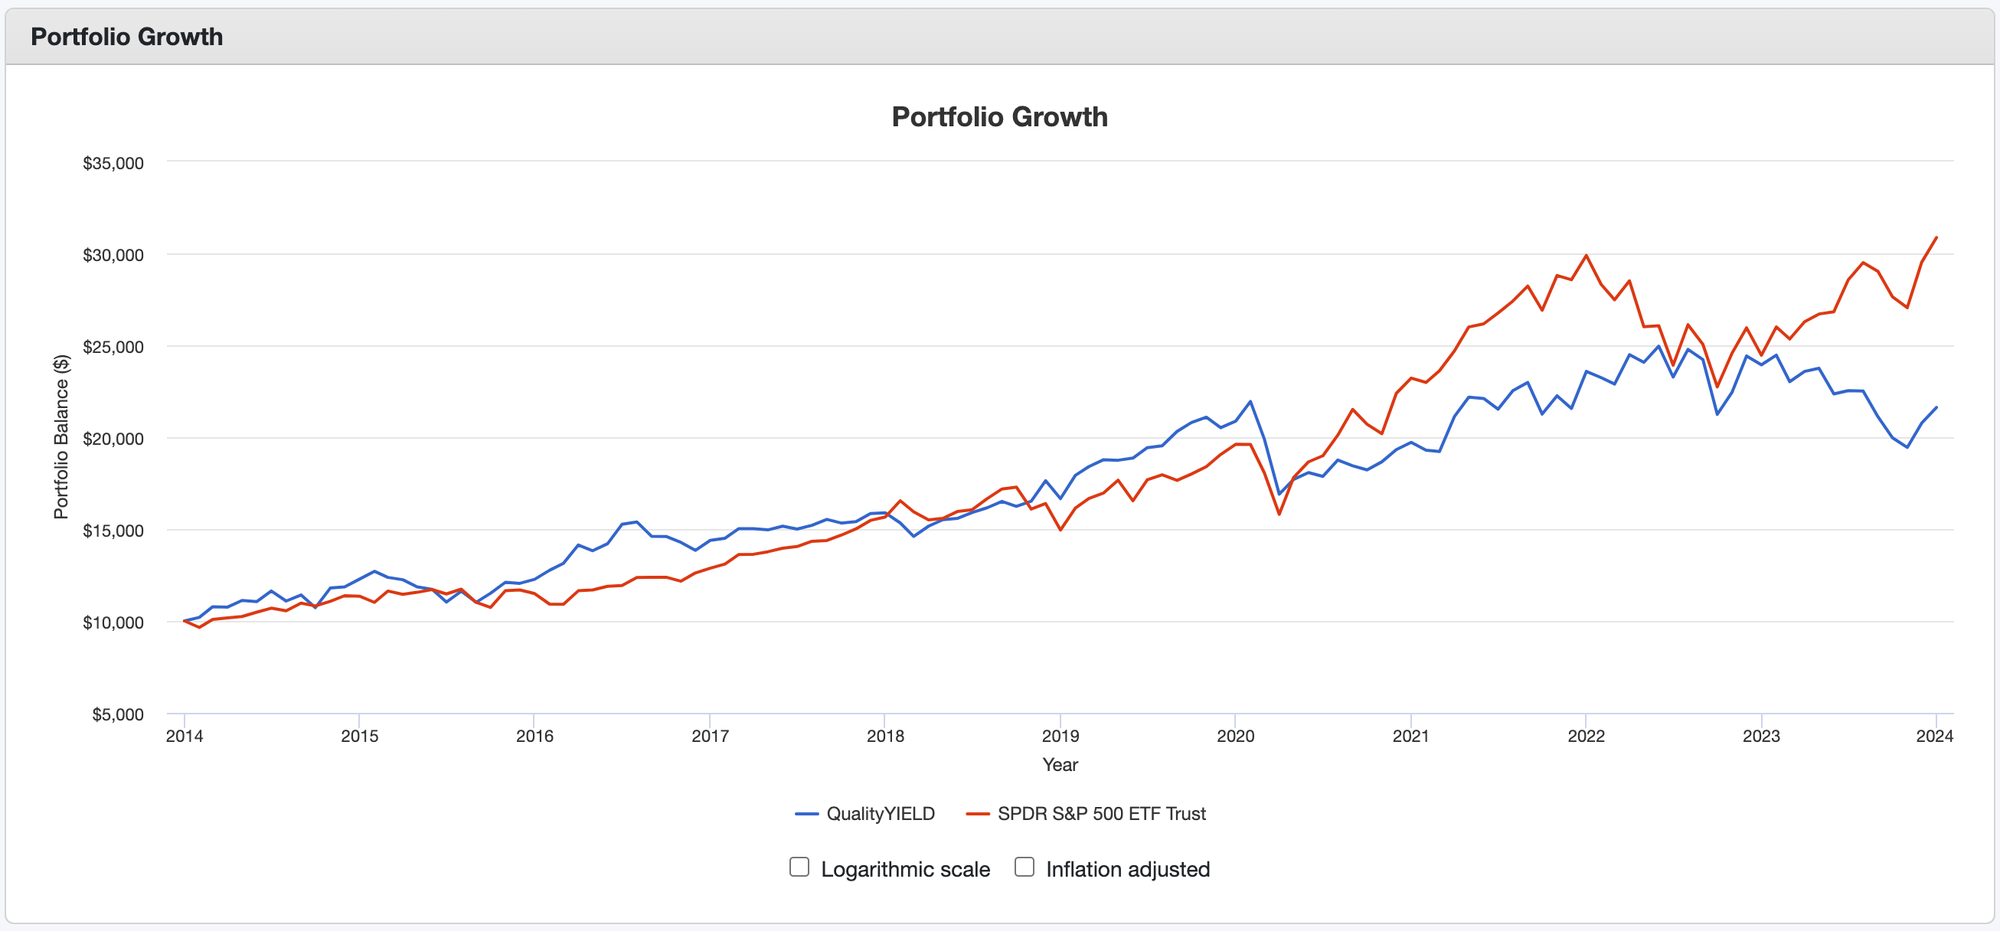
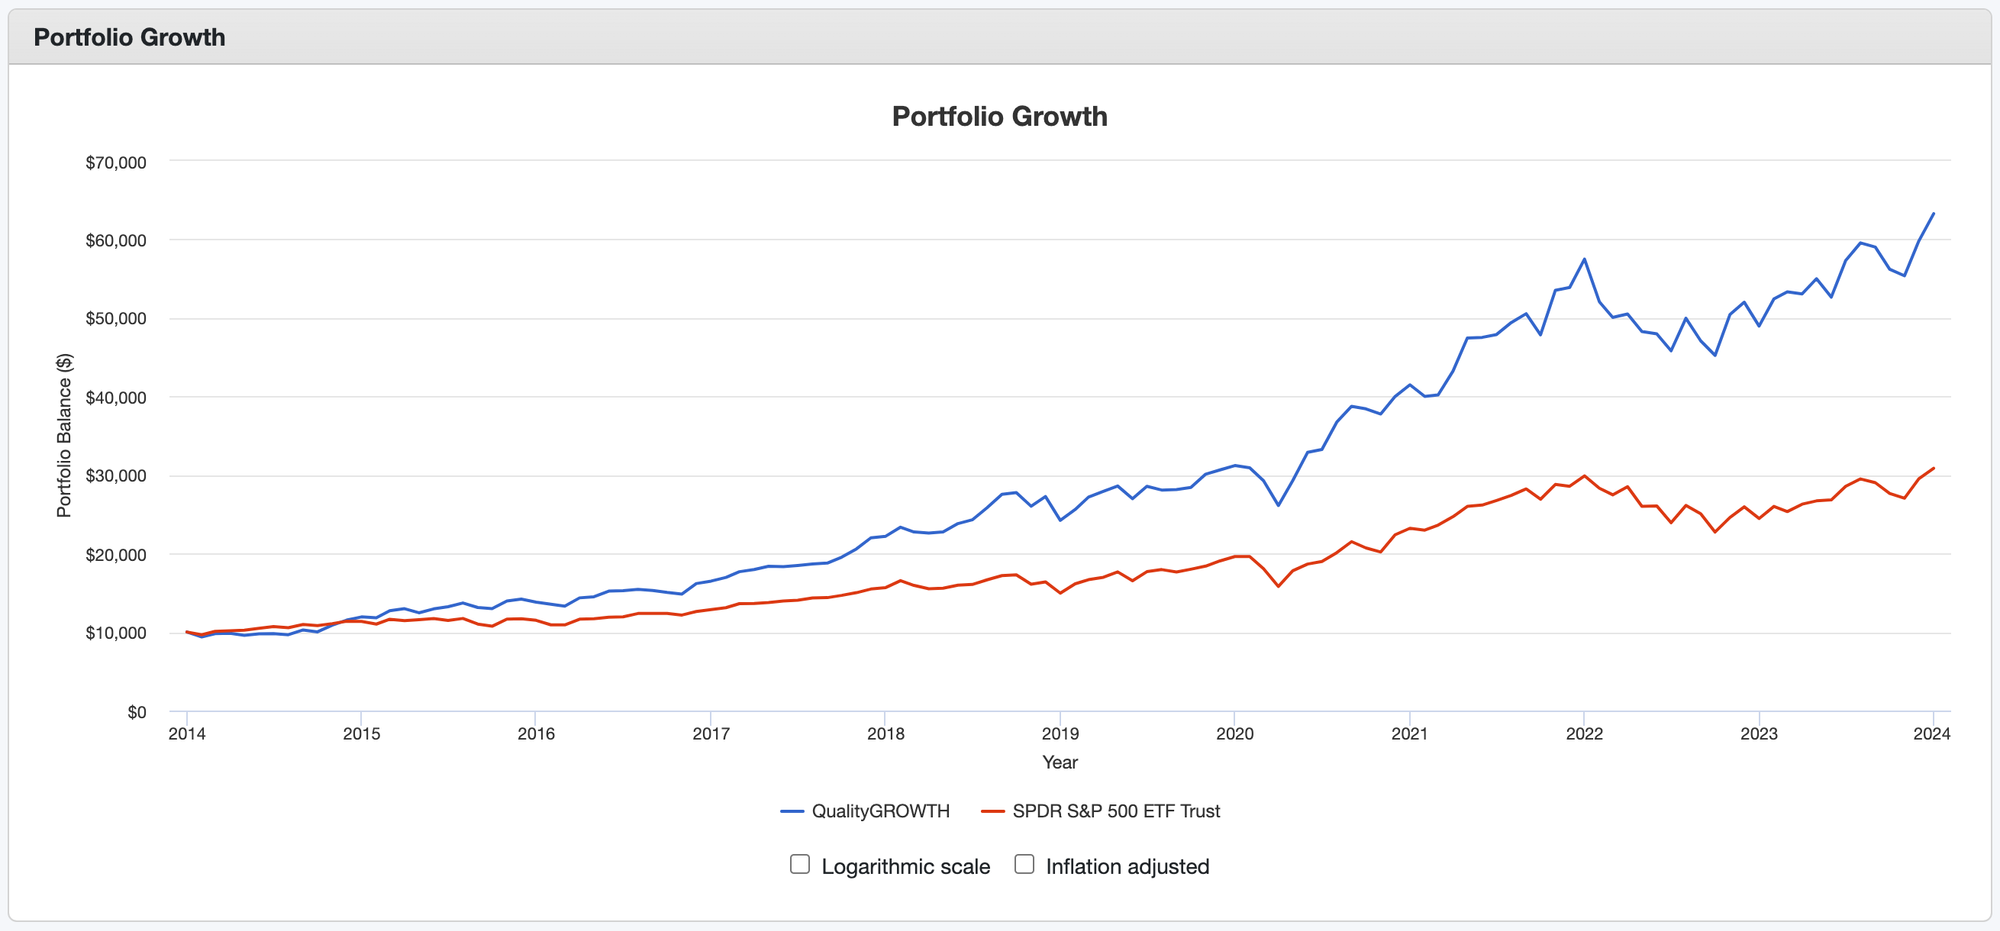
Portfolio Visualizer provides excellent backtesting tools, which I used to test the performance of QualityYIELD and QualityGROWTH for the 10-year period of 2013-2023, with no rebalancing and reinvested dividends.
If you invested $10,000 in QualityYIELD on an equal weight basis at the start of 2014, your investment would be worth $21,621 with reinvested dividends, which totaled $6,122 over the 10-year period.
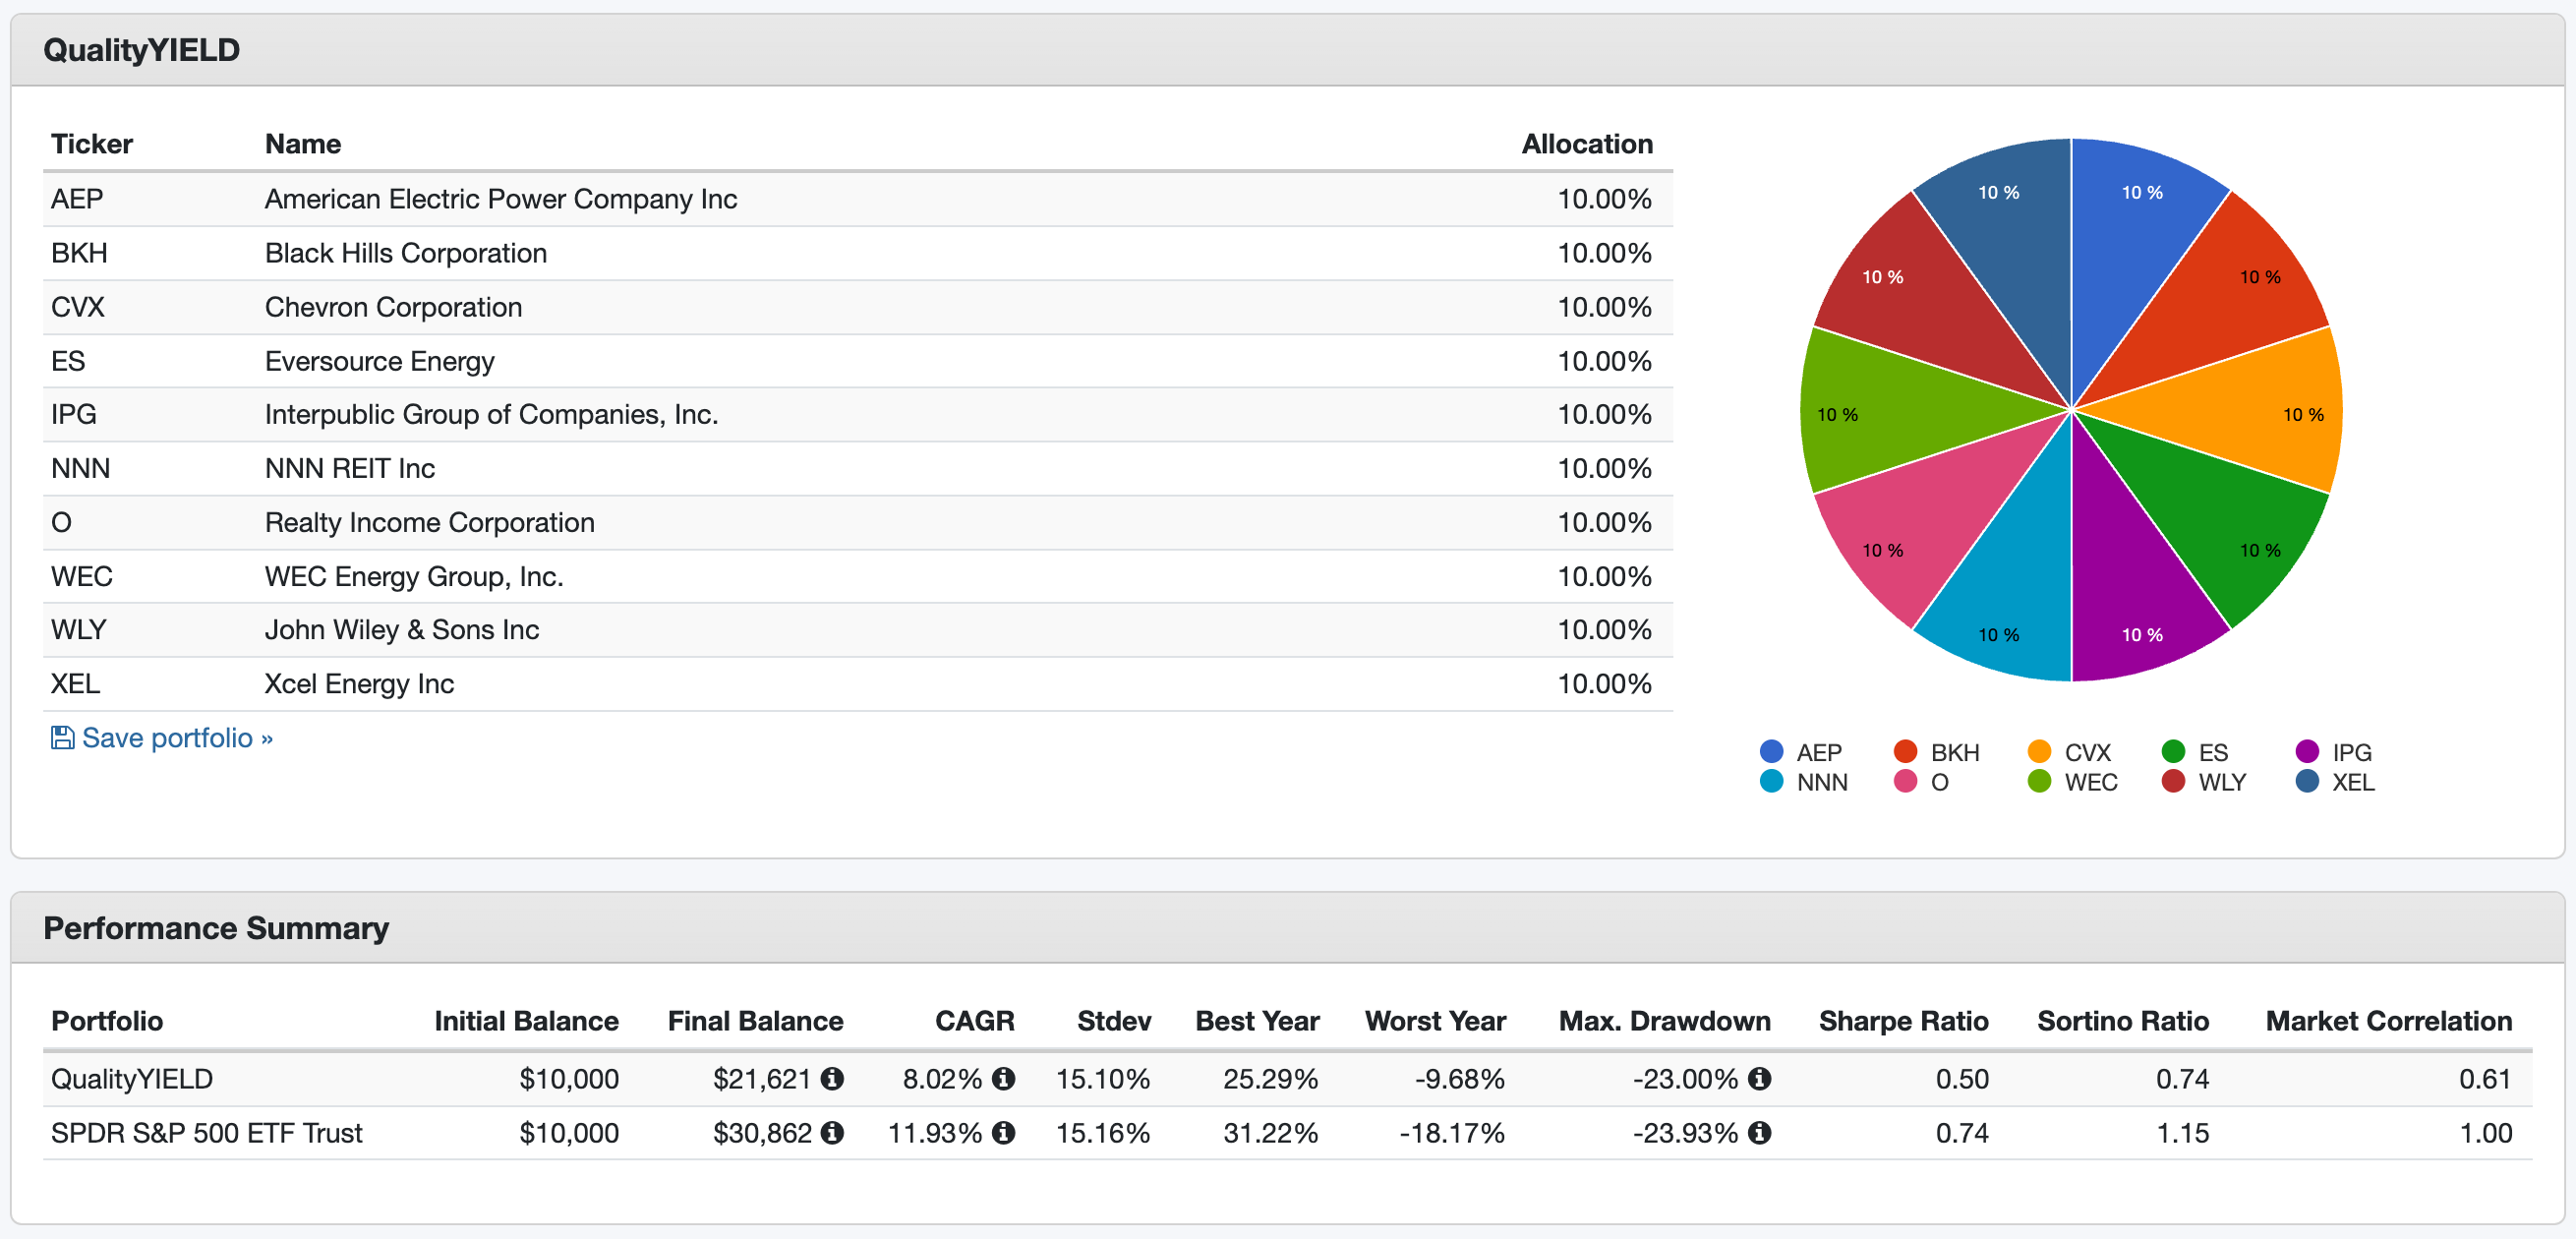
QualityYIELD significantly underperformed the SPDR S&P 500 ETF Trust (SPY) benchmark, with a CAGR of 8.02% versus SPY's 11.93%.
In contrast, if you invested $10,000 in QualityGROWTH on an equal weight basis at the start of 2014, your investment would be worth $63,280 with reinvested dividends, which totaled $3,292 over the 10-year period.

QualityGROWTH significantly outperformed the SPDR S&P 500 ETF Trust (SPY) benchmark, with a CAGR of 20.26% versus SPY's 11.93%.
While the results are certainly compelling, I'd caution against concluding that HiG stocks are the only way to go! Backtesting has survivorship bias risk, and one should be careful about the conclusions you make. For example, the screens I used to constitute QualityYIELD and QualityGROWTH include backward-looking metrics, as do the underlying components that make up the Dividend Quality Grade.
Nevertheless, I think many Dividend Growth Investors mistakenly require a minimum dividend yield when screening for dividend growth stock candidates, and so miss out on fantastic total return prospects from investing in HiG stocks like MA.
Many income investors have minimum income requirements that take precedence over a total return objective. However, I would suggest that any investment exceeding their minimum income requirements would also benefit from considering HiG stocks.
I long ago abandoned my minimum dividend yield screen of 2% and now own several HiG stocks in my DivGro portfolio (yield < 2% • 5-year DGR ≥ 15%):
- Broadcom (AVGO): yield: 1.48% • 5-year DGR: 19.25%
- Cintas (CTAS): yield: 0.86% • 5-year DGR: 22.93%
- Lowe's (LOW): yield: 1.81% • 5-year DGR: 19.29%
- Mastercard (MA): yield: 0.56% • 5-year DGR: 17.92%
- Rollins (ROL): yield: 1.33% • 5-year DGR: 16.75%
- Tractor Supply (TSCO): yield: 1.74% • 5-year DGR: 27.98%
- UnitedHealth (UNH): yield: 1.57% • 5-year DGR: 16.23%
- Visa (V): yield: 0.75% • 5-year DGR: 16.27%
Of these, AVGO, LOW, and UNH are Home Run stocks that have doubled my original investment in total returns. ROL and TSCO are recent investments, and CTAS, MA, and V have annualized returns of 31%, 12%, and 12%, respectively.
I recently added to my UNH position, as well as to other low-yielding, high-DGR positions such as Accenture plc (ACN), Costco (COST), Elevance Health (ELV), and NIKE (NKE). Of these, NKE has the highest yield of 1.49%, and ACN has the lowest 5-year DGR of 11.04%.
I'm curious to see how these positions will perform in the coming years!
More By This Author:
Home Depot Dividend Increase
NextEra Energy Dividend Increase
Public Service Enterprise Dividend Increase
Disclaimer: I'm not an investment professional or a licensed financial advisor. This article represents my personal views and decisions, which may not be appropriate for other investors. ...
more


Agreed, those results are compelling!
I'm certainly restoring the balance between HiG and HiY stocks in my portfolio. Of course, I also own stocks that offer both yield and growth, like ABBV.