VIXEQ-VIX Spread Signals A Critical Week For Markets
August 2, 2026
Major macro data and Treasury funding announcements place the 10-year yield at a pivotal 4.8% resistance level.

Fifty-five years after the gold window closed, the dollar faces trust erosion fueled by financial weaponization.

Skeptics like Michael Burry warn that aggressive accounting and circular financing may inflate AI earnings.

REITs are outperforming the S&P 500 and Nasdaq year-to-date as the crowded AI narrative faces growing skepticism.

What has changed between Berkshire's early decades and today's AI-driven market, told through the data.

Markets are weighing AI monetization against rising capex as Mag 7 growth remains the primary driver for the S&P 500.

August 2, 2026
Major macro data and Treasury funding announcements place the 10-year yield at a pivotal 4.8% resistance level.
August 2, 2026
Establishing a consistent buying rhythm for gold and silver prevents common mistakes driven by market volatility.

August 2, 2026
Rising long-term yields are pressuring valuations even as major indexes remain near highs.
August 2, 2026
Apple delivers strong free cash flow margins, signaling the stock is undervalued with an 11% upside potential.

August 2, 2026
Silver is repeating its 2011 cycle at double speed, signaling a potential move toward $50.

August 2, 2026
While a move toward 1.1850 is possible, fragile sentiment and technical resistance suggest volatility will persist.

August 2, 2026
U.S. Treasuries historically lead performance at the start of a recession, averaging 14% returns.

August 2, 2026
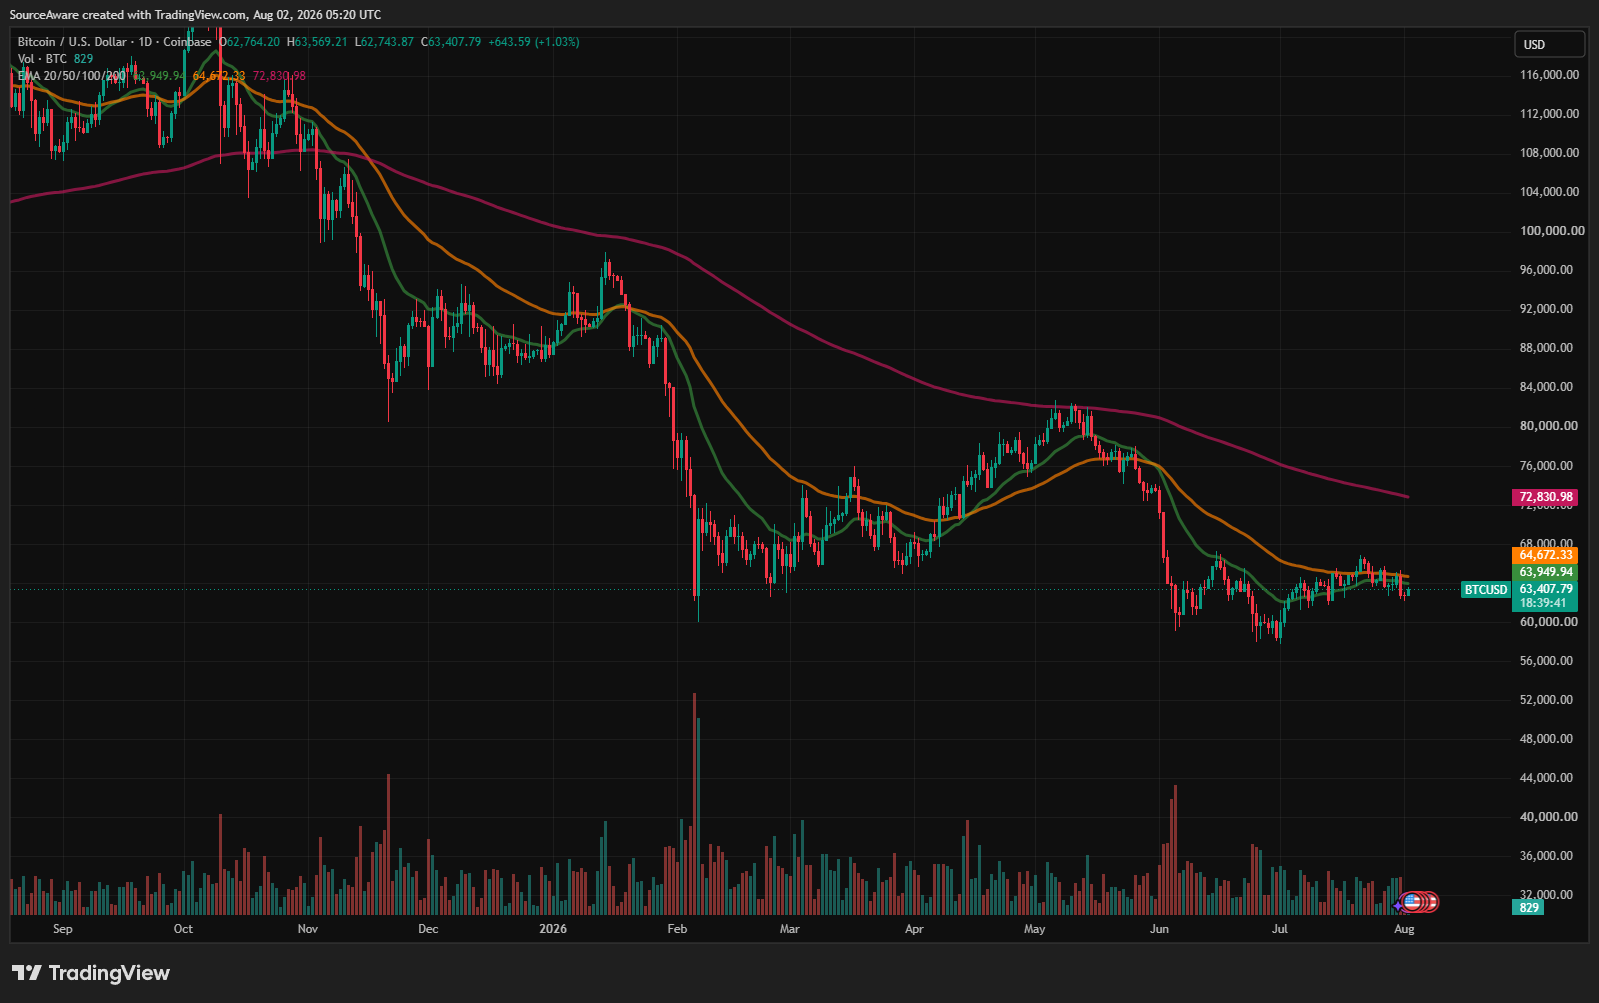
Bitcoin faces technical pressure as the crypto market struggles with weak breadth.

August 2, 2026
Fitch reports record-high private credit defaults, challenging the narrative that the downturn is safely contained.

August 2, 2026
Inflation erodes fiat currency like a melting ice cube, while silver remains a resilient store of value.

August 2, 2026
Technicals suggest a potential slide to 155, though wide interest rate differentials favor an eventual dollar rebound.

August 2, 2026
EUR/USD eyes 1.16 after strong Eurozone growth, while Gold holds above $4,000 and Bitcoin tests rangebound support as ETF inflows resume.

August 2, 2026
Treasury yields are testing critical resistance levels, signaling a major technical breakout that could reset market expectations.
Fifty-five years after the gold window closed, the dollar faces trust erosion fueled by financial weaponization.
Skeptics like Michael Burry warn that aggressive accounting and circular financing may inflate AI earnings.
REITs are outperforming the S&P 500 and Nasdaq year-to-date as the crowded AI narrative faces growing skepticism.
U.S. Treasuries historically lead performance at the start of a recession, averaging 14% returns.
Diversifying a funded account with two systems can backfire if traders fail to account for overlapping drawdowns...
Buda Juice scales its profitable cold-chain platform via new national rollouts at Walmart and Kroger.
Mensch und Maschine Software faces continued price pressure as negative momentum offsets its high 5.94% dividend yield.
The German DAX is outperforming U.S. equities as it challenges all-time highs, but an ending diagonal pattern warns of...