Will The SPX Reach 2600?
I last wrote about the SPX:VIX ratio on September 30.
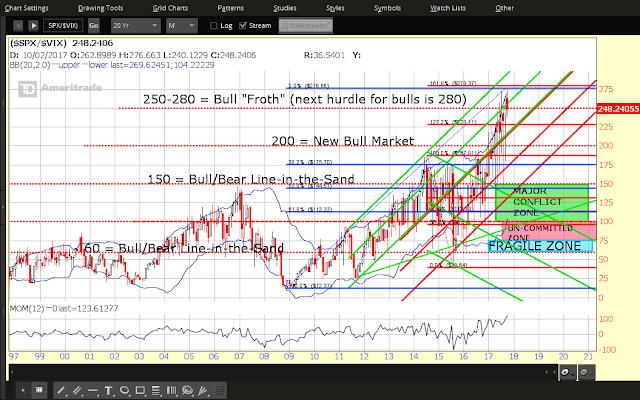
Price action on the Monthly ratio chart below shows an inability, so far, for volatility to be held at bay, while the SPX continues to make new highs, almost daily.
It has failed to hold, with conviction, above the 250 level and advance above its next resistance level, which is a 161.8% external Fibonacci level at 280.
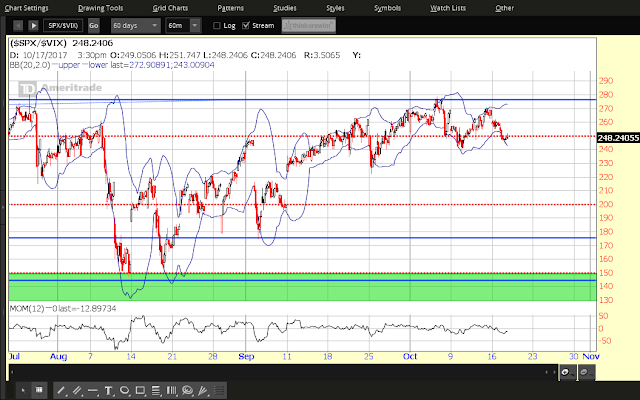
Price action, typically, doesn't like to leave unfilled gaps on the 60-Day 60-minute ratio chart. It gapped up on September 11 and remains unfilled. I'd expect that it will be filled in the near term, inasmuch as momentum has been fading on this timeframe and it has dropped below zero, once again. Watch for momentum to remain below zero on any gap fill.
Should price drop and hold below 200, we could see a significant drop occur in the SPX. Keep an eye on momentum on this timeframe for any confirmation of such a move.
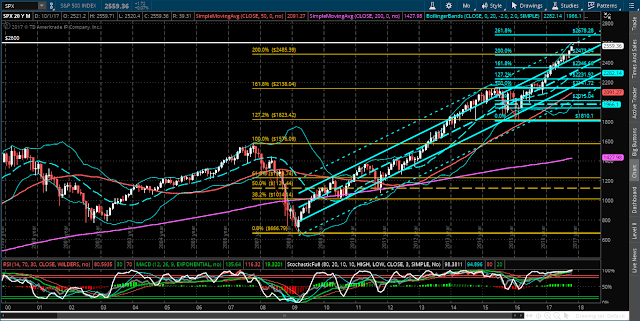
One possible scenario that may occur (before any such gap fill) is for the SPX to make a last gasp to reach 2600 (a +2 deviation level of a very long-term regression channel, as shown on the Monthly chart below.
Keep an eye on momentum on the above chart to see if it pops back, and holds, above zero to confirm that such a rally may be imminent.